Google Map Tutorial
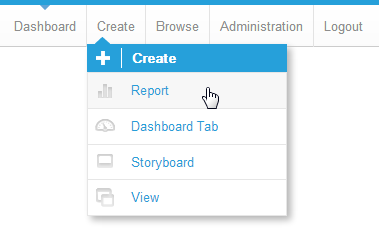
1. Click on the Create link and select Report to begin building your report.
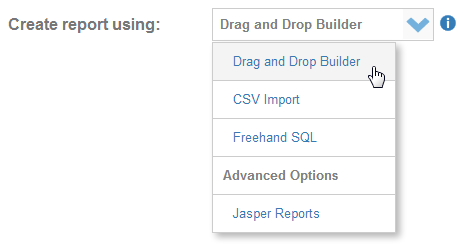
2. You should now be on the Initialise Report page. Select the Drag and Drop Builder as the build tool.
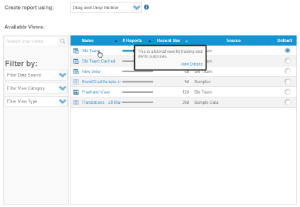
3. Select Ski Team as the View.
4. Now click the  button to proceed.
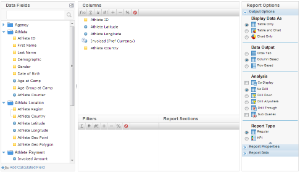
5. Add the Athlete ID, Athlete Longitude, Athlete Latitude, Invoiced (Pref Currency), and Athlete Country fields to your report.
6. Set the report to display as a Chart Only.
7. Click the Next image to continue.
8. On the output page click on the Chart Icon to edit the chart and set up your Google Map.
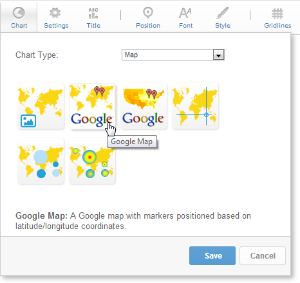
9. From the Chart Menu select Map.
10. Next select the Google Map type. Click Save to save your selection.

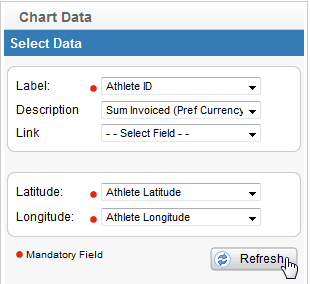
11. You will now see the Chart Data section updated with fields relevant to Google Maps.
12. Select the following:
Label: Athlete ID
Description: Sum Invoiced (Pref)
Latitude: Athlete Latitude
Longitude: Athlete Longitude
13. Click Refresh to display your chart.

Note: The Link can be used to insert a Hyperlink field into the map rollover.
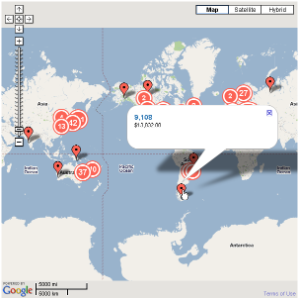
The data will be displayed as:
 Clusters (Grouped Points); and
 Points.
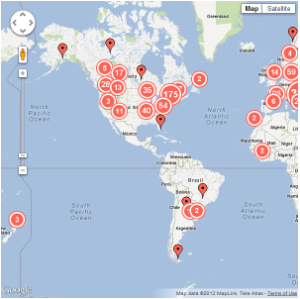
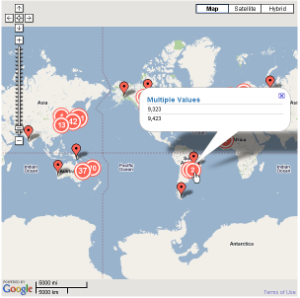
14. The cluster behaves differently from a point. In the number in the middle of the cluster indicates the number of points. If you click on a cluster it will display the values within it.
As you zoom in the clusters will open up to show the individual points.
15. The single data point will show the Label, Description and if selected, the Linked field on the roll over.