Page History
...
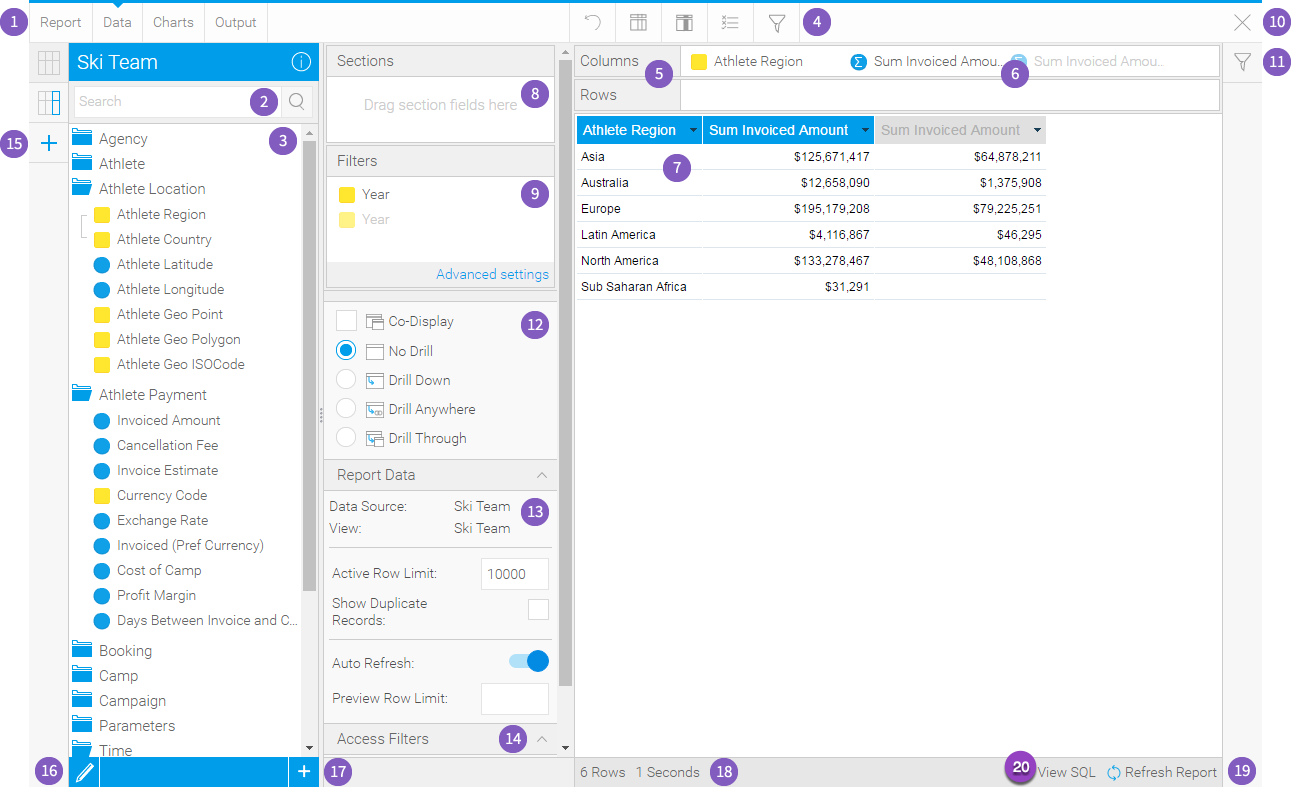
The Report Data page is where you build, edit and view the report data definitions used to generate Yellowfin reports. These definitions include both the queries you use to retrieve data for your document, and the data formatting.
# | Function/Panel | Description |
|---|---|---|
1. | Navigation | Access various builder steps by clicking on the links in the navigation bar. The Report link provides the user with save options throughout the building process, rather than waiting until the final step. See Report & Edit Menus for more information. |
2. | View Fields Search | Search for fields to use in the report here, accessing all fields provided by the selected View in the previous Create step of the builder. |
3. | View Fields List | Select fields to use in the report from the list provided by the selected View in the previous Create step of the builder. To add multiple fields at once, simply hold down Ctrl/Command or Shift while selecting fields. |
4. | Formatting Menus | Access various formatting menus from this section of the navigation bar. This allows the user to apply formatting changes to the report and preview the output while still on the Data step, rather than having to toggle between it and the Output step. See Formatting for more information. |
5. | Table Body Fields | Drag fields into the Columns and/or Rows lists to build the body of the report. Adding fields to both lists will create a cross tab report automatically. See Fields for more information. |
6. | Field Drop Down Menus | Apply aggregations, formatting, advanced functions, totals, and other options to a field via its drop down menu. See Fields for more information. |
7. | Table Preview | View a preview of the final report output. The user can also drag fields into this preview area, rather than adding them to the Columns or Rows list to add them to the table. Fields can also be reordered here by dragging the field headers into position. See Table Preview for more information. |
8. | Section Fields | Select fields to be used as sections in the report, these will create splits in the table for each value of the section field(s). See Sections for more information. |
9. | Filter Fields | Select fields to be used as filters in the report, values for these can either be defined during the report creation process, or left as user prompt. See Filters for more information. |
10. | Close Builder Button | Leave the builder using this button. |
11. | Filter Panel | Apply values to filters defined as user prompt here in order to restrict the results in the table preview. Values applied here are only used to adjust the preview, not the final report output. See Filter Preview for more information. |
12. | Analysis Style | Enable Related Reports and Drill functionality through this panel. See Related Reports for more information. |
13. | Report Data | View the Data Source and View name that the report is built on. The user can also limit the rows returned in the report, the preview, and switch the Auto Refresh off if they wish to build with dummy data, rather than continually querying the database after each field change. See Report Data for more information. |
14. | Access Filters | If there are access filters applied to the View selected to build off, they will appear here to be enabled/disabled. If the user does not have the Access Filter role permission they will not see this section. See Access Filters for more information. |
15. | Sub Query Panel | Create and switch between sub queries through this panel. If the user does not have the Sub Queries role permission they will not see these buttons. See Sub Queries for more information. |
16. | Edit View | The user can access the view via this button in order to make changes required for the report creation. If the user does not have the appropriate Database Views role permissions they will not have access to this button. |
17. | Add Calculation | The user can create calculated fields to use within the report. Depending on the user's role permissions they may be able to create Freehand SQL calculations as well as using the builder interface. See Calculations for more information. |
18. | Table Preview Info | View the number of rows and time taken to return the table preview. See Table Preview for more information. |
19. | Refresh Report | Refresh the data displayed in the table preview. See Table Preview for more information. |
| 20. | View SQL | View the report’s SQL compiled in the background. See View SQL for more information. |
...