Like what you see? Have a play with our trial version.

Error rendering macro 'rw-search'

null

Versions Compared

Key

  • This line was added.
  • This line was removed.
  • Formatting was changed.


Overview

Tooltips are a great way of finding out values of data points. Hovering the cursor over a chart point will reveal the tooltip to reveal exact values and interact with the data.


Image Added


Here are some of the functions you can perform using the tooltip:

...

Expand
titleView data values


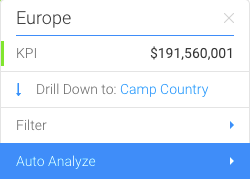
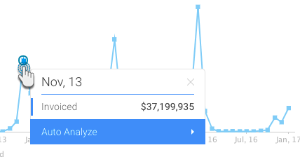
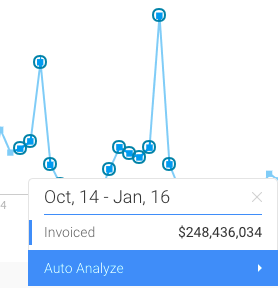
You can view the exact value of a data point, or multiple data points using the tooltip. On making the tooltip appear, you will be able to also view any functions that can be performed.


  1. For a single data point, simply hover your cursor over a point or bar in a chart to make the tooltip appear.
  2. Then right-click to extend the tooltip.
  3. The tooltip will clearly indicate the exact select value name (date, region or any type) and provide its value.

    Image Added

  4. But to discover the values of multiple data points, select them through brushing (dragging and selecting).
  5. The tooltip will display the exact values of the selected points with their combined result.

    Image Added


Expand
titleFilter data


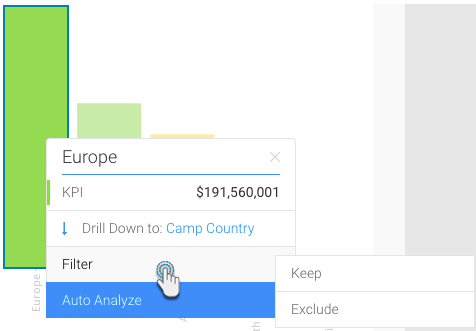
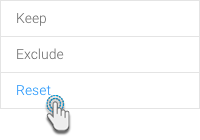
You can filter data on a chart by using these options.

OptionDescription
KeepThis saves the selected data point and removes the rest. Note: keep works best for big charts when you want to select a few values and keep them.
ExcludeThis deletes the selected point(s) and keeps the rest.
ResetThis appears when a chart has been filtered, to undo that action and go back to displaying the original chart data.


  1. Make the tooltip appear on a selected data point(s), and select the Filter option.

    Image Added

  2. Click on Keep to save the selected data. The rest of the content will be removed from the chart.
  3. Or click on Exclude to delete the chosen data. It will disappear from the chart.
  4. On performing either of these actions, a new option will be added to the Filter menu called Reset.

    Image Added

  5. Use this to undo the filtering done on the chart. The chart will go back to its original form.


Expand
titleDrill into data


Expand
titleAuto analysis