Page History
...
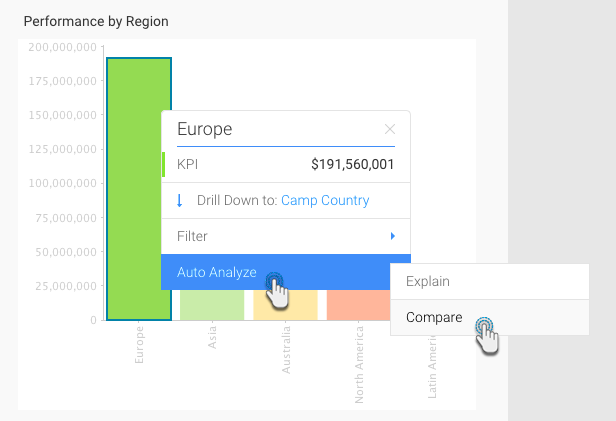
- Navigate to the chart that you want to analyse (perhaps there is a large difference between two elements on a chart that you are interested in exploring).
- Right-click on a chart element (bar, data point) or hover your cursor over it to bring up the tooltip.
- Click on the Auto Analyze option, and then select Compare.
- Select the data that you want to compare to from the list in the popup that appears.
- Click on the Compare button.
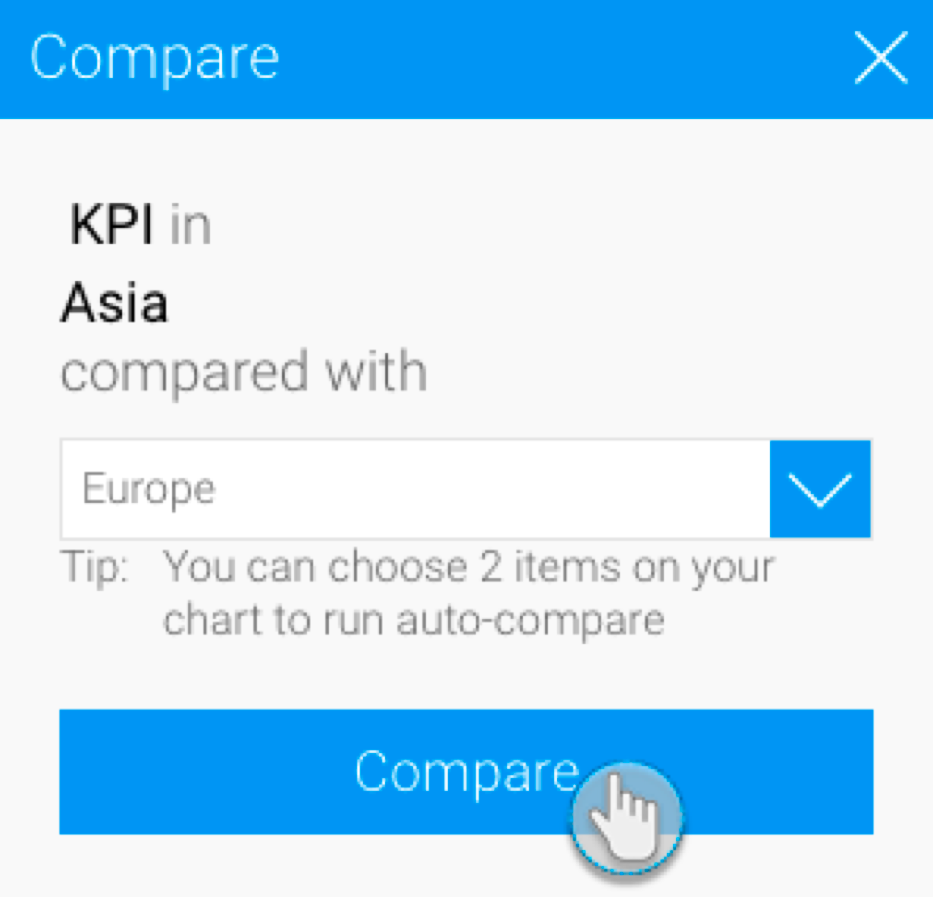
- Note: Alternatively, you can select two bars to compare by clicking and dragging the cursor over them (brushing).
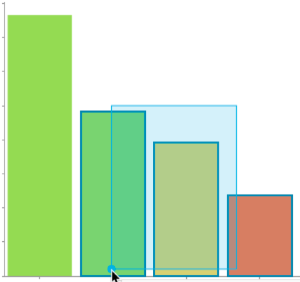
- Or, clicking on one, pressing the Shift key and selecting the other one.
- Note: Alternatively, you can select two bars to compare by clicking and dragging the cursor over them (brushing).
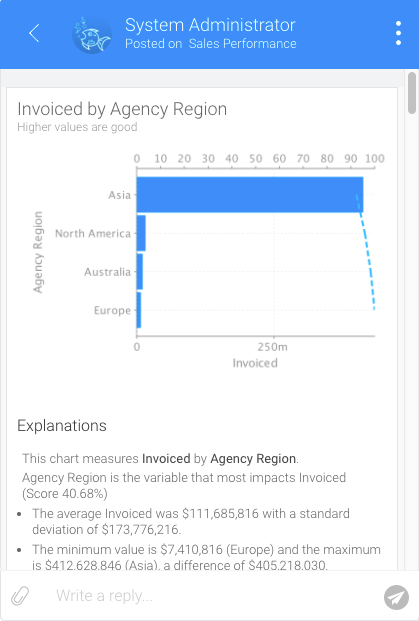
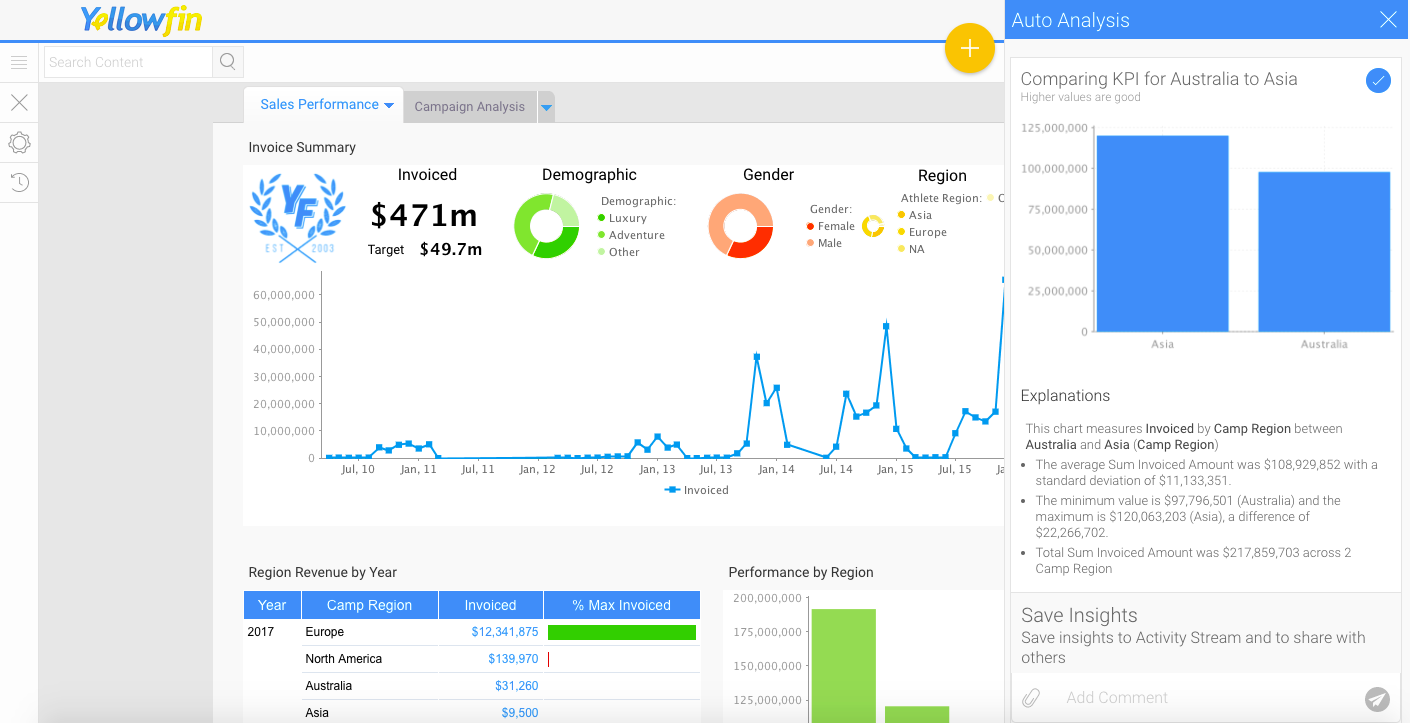
- The result of the comparison will appear in the form of an Insights Auto Analysis panel displaying charts with explanations, based on your selected data.
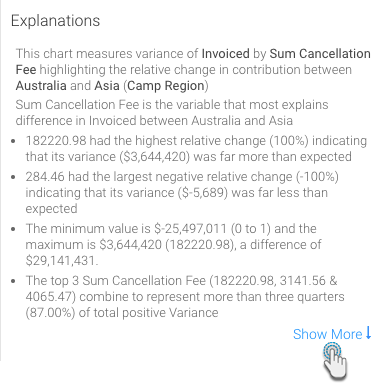
- Click on Show More at the end of the explanations, to view the complete set of narratives that are provided with your insight.
...
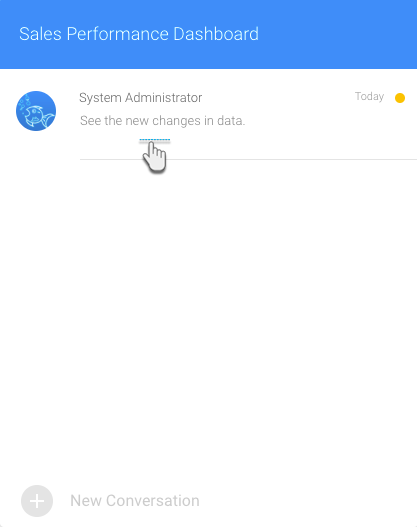
Once insights appear in the Auto Analysis panel, you can save these to the activity stream be used later, or to share them with other users.
- Choose the insights that you wish to save
- Insights can be saved or shared using the Save Insights section at the bottom of the Auto Analysis panel.

- Enter a comment.
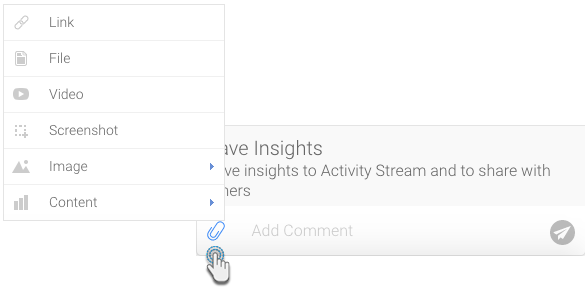
- You can also attach a file by using the attachment icon.
Then click on the send icon.

This will be added to the activity stream of the chart or dashboard. Click here to learn more about this.

- Click on this comment to view the saved insights in the activity stream.