Page History
...
Overview
| Styleclass | ||
|---|---|---|
| ||
...
Yearly Comparison
| Styleclass | ||
|---|---|---|
| ||
...
Units
| Styleclass | ||
|---|---|---|
| ||
...
Visible Unit Selection
| Styleclass | ||
|---|---|---|
| ||
...
Date Slider
| Styleclass | ||
|---|---|---|
| ||
...
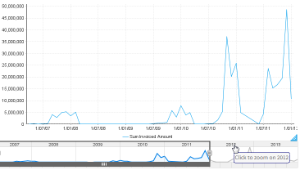
- Enable the Date Slider option through the chart Settings menu
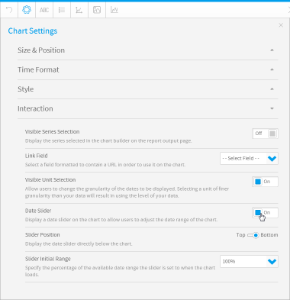
- Your chart will now have a slider the user can manipulate to view subsets of the data
Date format for time series
Change the date format on your charts to a different style. This is available for all charts that support time series.
Type | Description | Format/Example |
|---|---|---|
Report | This shows the date format as it is in the report. For example, if the date is in a numeric format, then it will be displayed as dd/mm/yyyy here. Note: This format can only be selected for continuous time series. | |
Long | Shows the full name of the selected date unit. For example, if month is the selected unit, it will display the full name of the month. | E.g.: Monday, August, or Quarter 1. |
Short | Shows the shorter version of the selected date unit. Note: Some time units have no difference between their long and short versions, such as Year. | E.g.: Mon, Aug, or Q1. |
Create a report with at least one date value.
Navigate to the chart section.
Select a chart that supports the time series. Ensure that you use the date field.
Click on the series setting button in the chart builder’s header.

Select the date field from the left side panel.
Choose and apply a date format.

| horizontalrule |
|---|
| Styleclass | ||
|---|---|---|
| ||