Like what you see? Have a play with our trial version.

Error rendering macro 'rw-search'

null

Versions Compared

Key

  • This line was added.
  • This line was removed.
  • Formatting was changed.

...

Overview

Styleclass
ClasstopLink

top

The Chart step formatting menu bar provides you with all the formatting options for your chart. You can use these options to change settings such as the legend, background, axis and label.

...

Reset

Styleclass
ClasstopLink

top

The Reset menu allows you to reset your chart or formatting options:

...

Chart Settings

Styleclass
ClasstopLink

top

The chart format options are the most dynamic options and are based on the type of chart selected. For example for a pie chart you will be able to set the shadow colour and exploding slice options. The common options found in the chart format drop down include interactivity options such as visible series selection.

...

Title

Styleclass
ClasstopLink

top

The title option allows you to change the title of the chart as well as the style – such as the font settings.

...

Legend

Styleclass
ClasstopLink

top

The Legend is a box that identifies the patterns or colours that are assigned to the data series or categories in a chart. This section of the menu lets you set the following options.

...

Axis

Styleclass
ClasstopLink

top

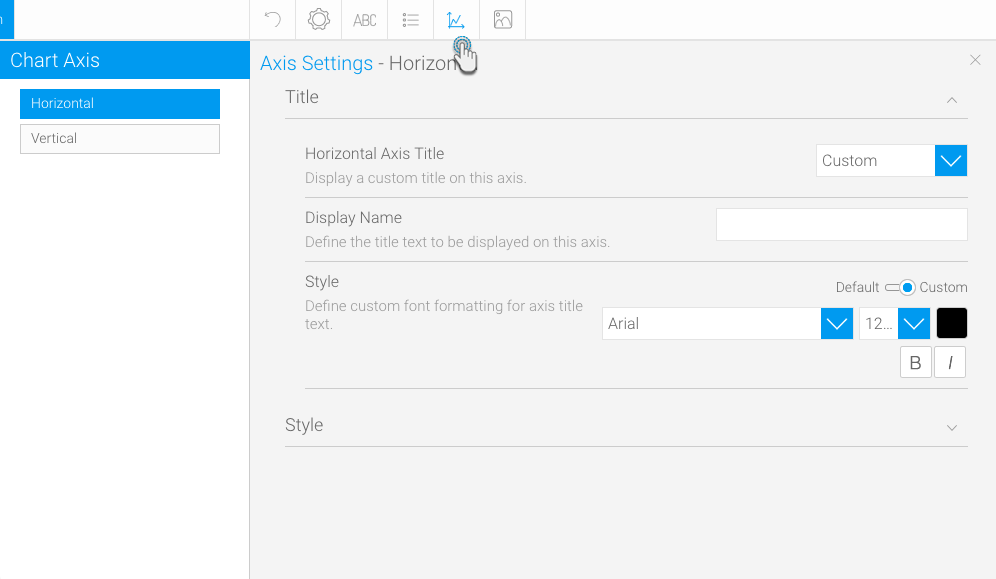
A line bordering the chart plot area used as a frame of reference for measurement. The y axis is usually the vertical axis and contains data. The x-axis is usually the horizontal axis and contains categories.

Image Removed

 Image Added

Expand
titleTitle

Option

Description

Axis Title

Note: This option is only specific to auto-charts.

This drop down menu lets you choose whether to display the auto generated title (Auto), enter a manual one (Custom) or not display a title at all (None).

Display NameDefine the title text to be displayed on this axis.

Style

Define the formatting for axis title text.

...

Background

Styleclass
ClasstopLink

top

The Background options let you set the style and colour of the main chart elements such as the plot and chart areas. You can apply elements such as background images and or gridlines.

...

Labels

Styleclass
ClasstopLink

top

Labels can be added to charts to print out the values of the data point onto the chart in text format. Generally the formatting of label options are only available for pie charts.

...

Series

Styleclass
ClasstopLink

top

Series


Expand
titleSeries

Option

Description

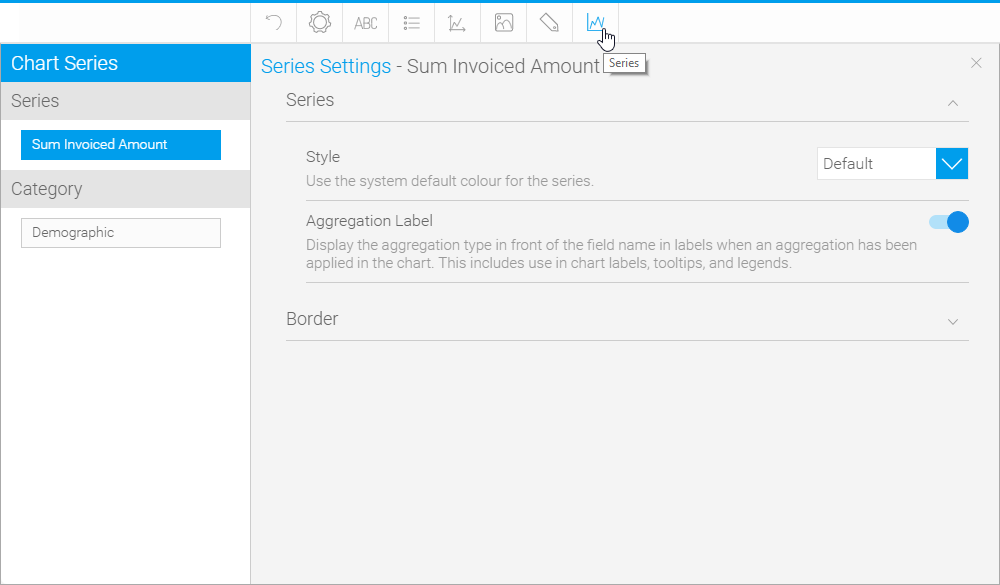
Aggregation LabelThis allows you to toggle the display of a label in front of the field name, based on the chart level aggregation applied.

Style

Specify the shading style for the series.

Direction

Select the direction of the gradient shading to be applied to the series.

Colour

Define the colour(s) to be applied to the series.

Combination Sub Chart

Specify which sub chart this series belongs to. This will define the type of chart, and which vertical axis it will use.

Shapes

Define whether line shapes are on, off, or system default.

Thickness

Define the width of the line in pixels.

...

GIS Settings

Styleclass
ClasstopLink

top


Expand
titleLayer Settings

Option

Description

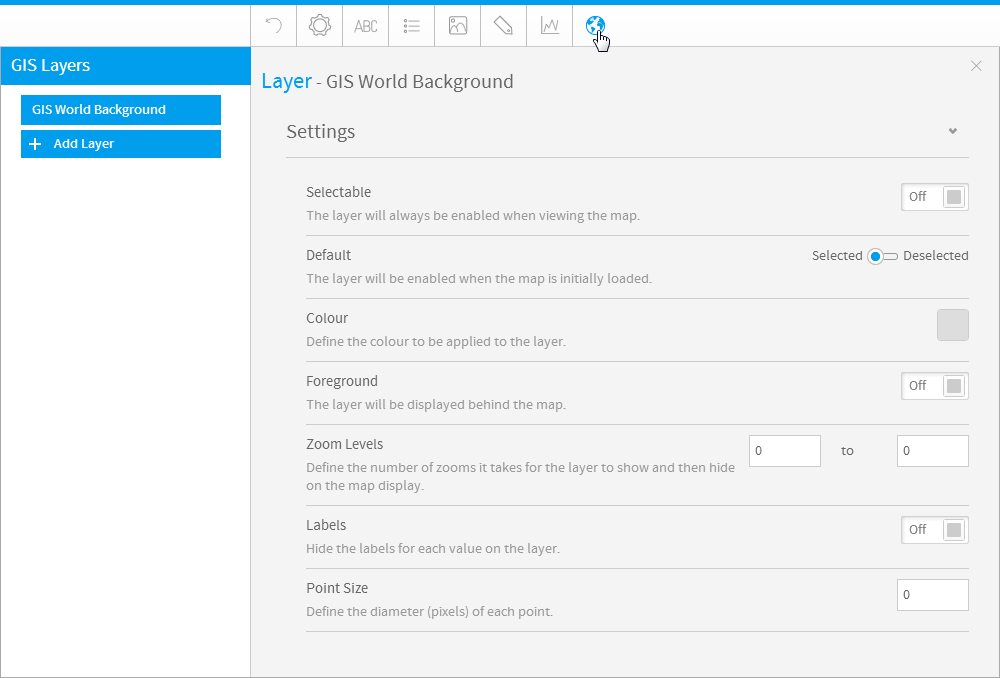
Selectable

Allow the user to enable and disable the layer when viewing the map.

Default

The layer will be enabled when the map is initially loaded.

Colour

Define the colour to be applied to the layer.

Foreground

The layer will be displayed in front of the map.

Zoom Levels

Define the number of zooms it takes for the layer to show and then hide on the map display.

Labels

Display the labels for each value in the layer.

Point Size

Define the diameter (pixels) of each point.

Bubble Fill Type

Define the shading effect to be applied to the bubbles.

...

Combination Charts

Styleclass
ClasstopLink

top


Expand
titleCombination Charts

Option

Description

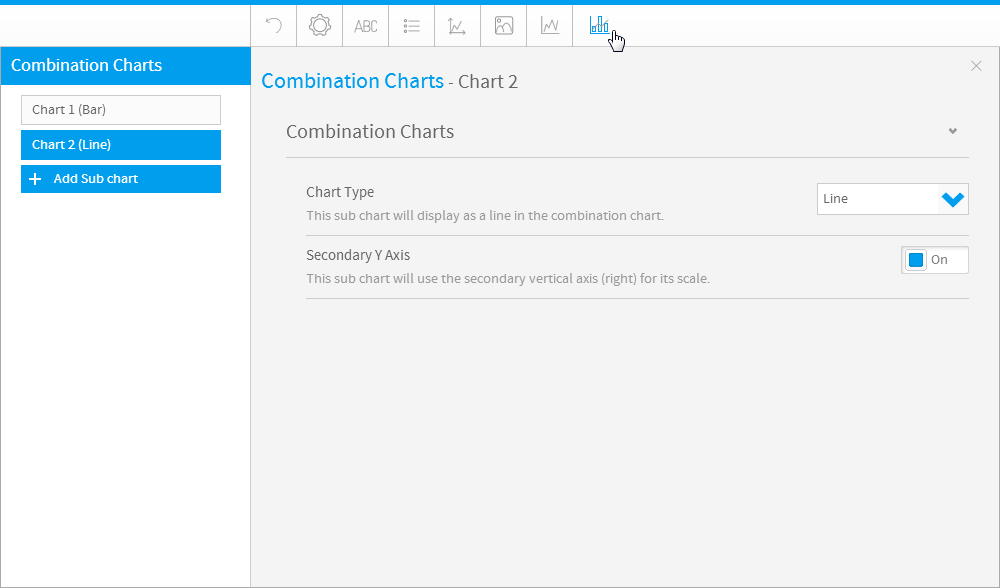
Chart Type

Define the type of display this chart will use.

Secondary Y Axis

Define which vertical axis this chart will use.

...

horizontalrule
Styleclass
ClasstopLink

top