Page History
...
Feature | Description | With feature | Without feature |
Outline | |||
Show Outline | This option can make an outline appear around the chart | ||
Outline Color | Note: This setting will only appear if you Show Outline feature is switched on. You can use this option to select a colour for the chart outline. |
|
|
Outline Width | Note: This setting will only appear if you Show Outline feature is switched on. Fidget with this setting to alter the width of the chart outline. |
|
|
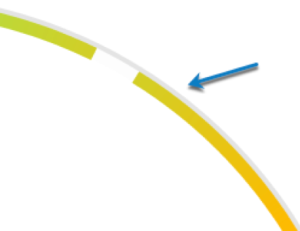
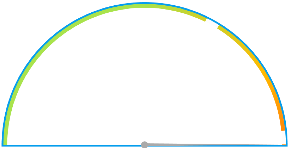
Example: With the Show Outline switched on and a blue outline colour of 5 cm set up for it, here’s a glimpse at what the meter chart would look like. | |||
Ticks | |||
Show Tick Lines | This dropdown list lets you choose whether to include tick lines in the chart; you can also opt for only the major, minor or both types of scale increments. |
|
|
Tick Line Color | Use this to toggle the color of the tick lines. |
|
|
Major Tick Units | Set the increment level of the major tick units. Warning: If you add a lesser value in this field, the data on the labels will go missing. Note: The chart will display up to 20 units max, evenly spacing them out. |
|
|
Major Tick Length | Alter the length of the major tick units. |
|
|
Minor Tick Length | You can change the size of the minor ticks as well. |
|
|
Show Tick Labels | Enable this setting to display labels against the major ticks. |
|
|
Font | This appears if you have opted to show tick labels. You can alter the labels’ font, including changing the type of font, its colour, scalability and even bold or italic styles. |
|
|
Summarize | Switch on this setting to summarize or shorten the tick labels if they have a numeric value. |
|
|
Decimal Places | If the above setting is on, use this to establish a decimal place for the tick labels. |
|
|
Rounding | Select how to round off numeric labels. |
|
|
Color Band | |||
Conditional Format | Leave this setting enabled to apply the conditional formatting rules you created to the meter chart. Note: If disabled, the meter chart will go back to its default look. |
|
|
Gradient | Use this button to apply the gradient effect to your meter. |
|
|
Color | Note: This will only appear if you disable the conditional format button. If you have opted for the default look for your meter chart, you can change the color of the chart band through here. |
|
|
Opacity | You can control the opacity of the chart’s color band through here. |
|
|
Width | You can set the color band’s width using this. |
|
|
Offset | Use this field to add space between the color band and the outline. |
|
|
Background Color | You can choose a background colour |
|
|
Background Opacity | Toggle with the background transparency with this feature. Note: The level of opacity will be a percentage of the color band’s opacity value. |
|
|
Value Indicator | |||
Show Needle | Use this to show or hide the needle indicator |
|
|
Needle Point Color | If the needle is being displayed, you can select any colour for its pointer part |
|
|
Needle Dot Color | If you’re displaying a needle, use this to set a color for its dot part |
|
|
Show Value Tick | If you’ve chosen to hide the needle indicator, you can highlight a tick as an indicator by enabling |
|
|
Value Tick Length | If you’ve opted for a tick indicator, you can alter its length through this field |
|
|
Value Display | |||
Show Value | Switch this button on to display the value of the measure on the chart |
|
|
Value Font | If you display the measure value, you can alter the font, including changing its type, colour and styling |
|
|
Summarize | Switch on this setting to summarize or shorten the measure value. |
|
|
Decimal Places | If the above setting is on, use this to establish a decimal place for the value. |
|
|
Rounding | Select how to round off numeric labels. |
|
|
Show Field Name | Display the name of the measure field if enabled |
|
|
Field Name Font | Change the font of the measure field's name |
|
|
| Show Target | If this button is enabled, it shows the target on the meter chart | ||
| Target Font | Change the font of the target value | ||
General Target Settings | |||
Manual Target | Establish a target on your meter chart. This field will only appear in the meter settings if a target hasn't already been set through the target field on the chart canvas. |
|
|
| Dial Start Angle | Note: This setting only appears for dial charts. You can use this to set a start angle for the dial. | ||
| Dial Extent | Note: This setting only appears for dial charts. Use this to set an extent on the dial display. | ||
...
| Tip |
|---|
You can edit the thermostat chart to make it appear as a bar chart. |
| horizontalrule |
|---|
| Styleclass | ||
|---|---|---|
| ||
...


