Page History
...
| Note |
|---|
|
| Styleclass | ||
|---|---|---|
| ||
...
On generating Instant Insights, the Auto Analysis panel will appear, displaying the insights produced by Yellowfin.
Select the charts that you want to edit or view the reports of, by clicking on their select icon.
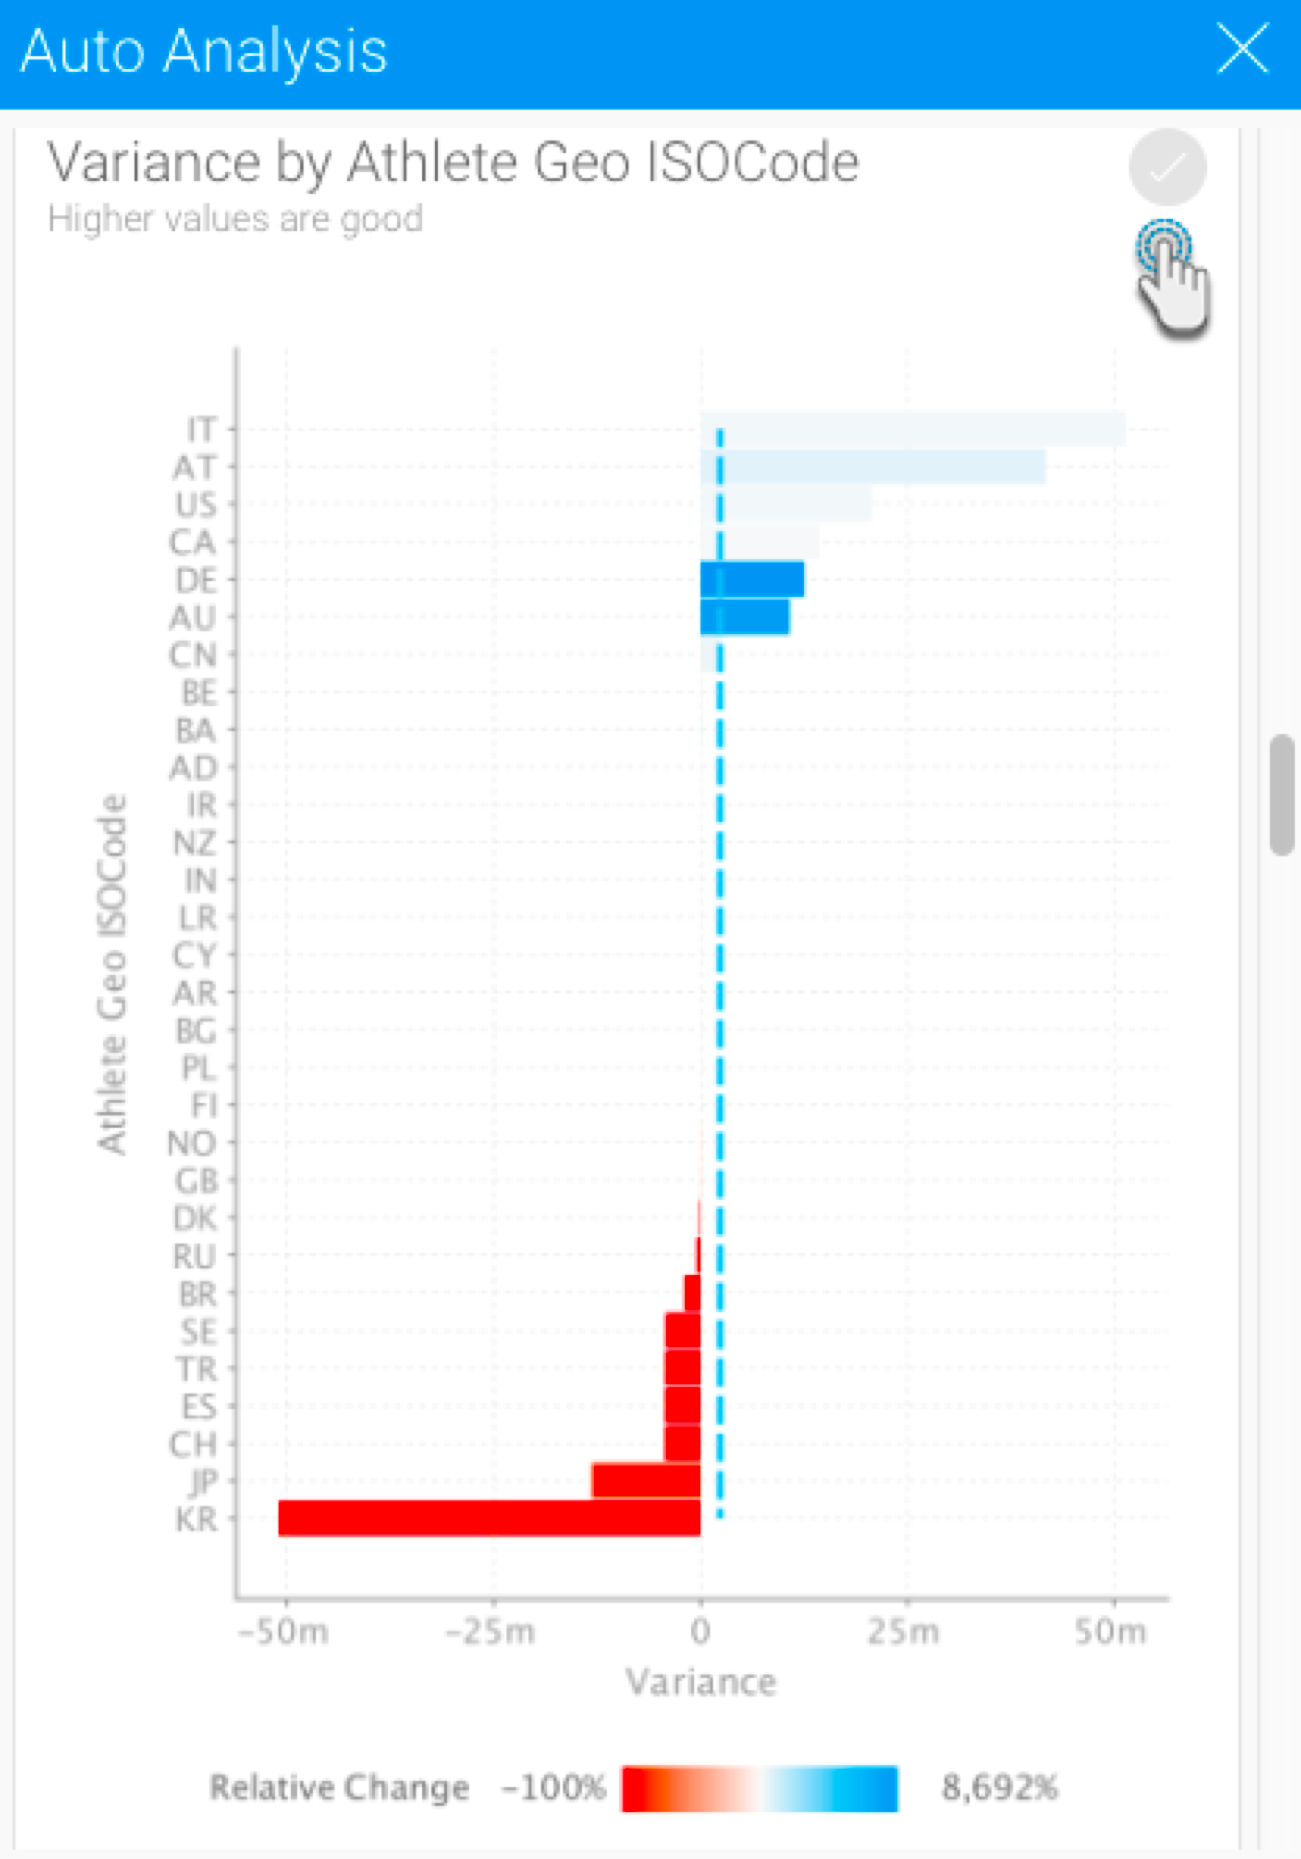
Note: All the charts will be selected by default; un-select the ones that you don’t want to edit or view in detail, by clicking on the their select icon.
Click on the menu option in the Save Insights panel, and click Edit Analysis. Note: This function is only available to users with report editing security access.
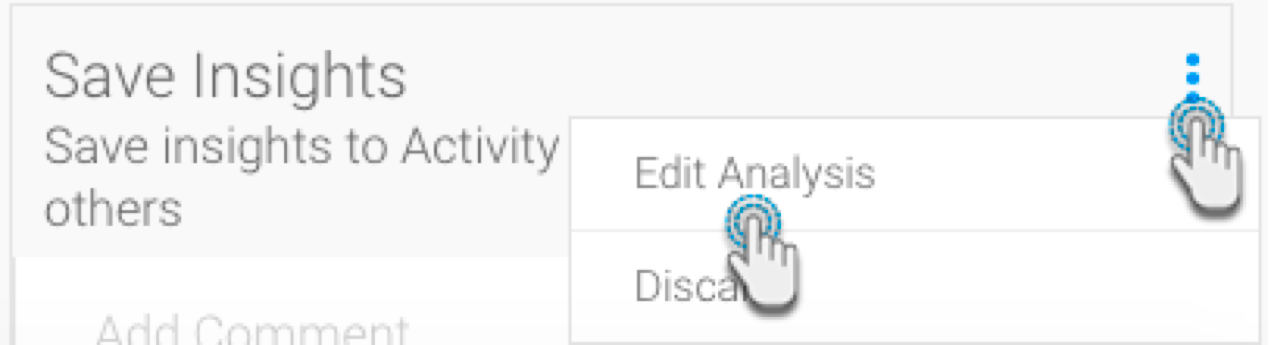
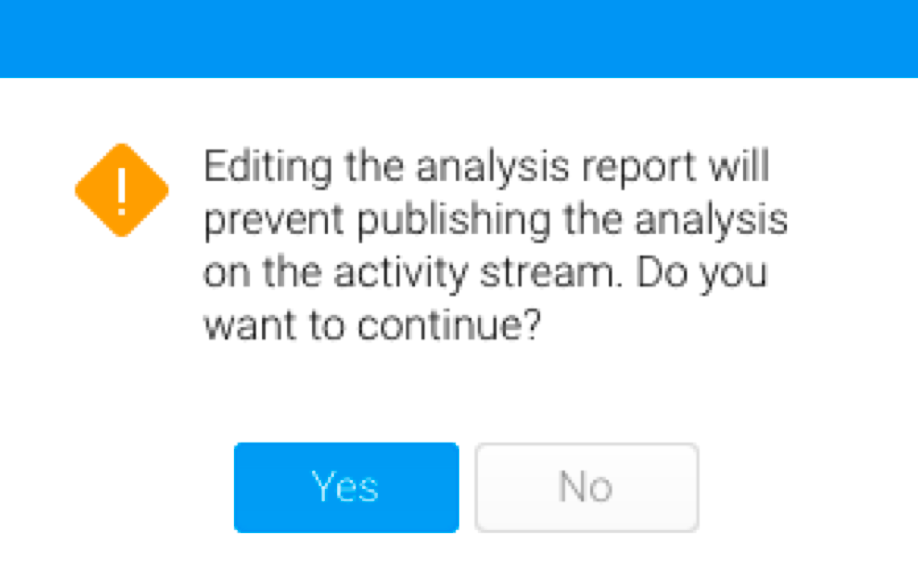
Note: Or click Discard to discard the Instant Insights generated(If you choose the Discard option instead, then the Insights will be discarded, without saving the report.)An alert will appear indicating users that editing the analysis will prevent them from publishing the results on the activity steam. To continue, click Yes.
You will be taken to the Report builder, where you can view the reports and charts that you have selected.
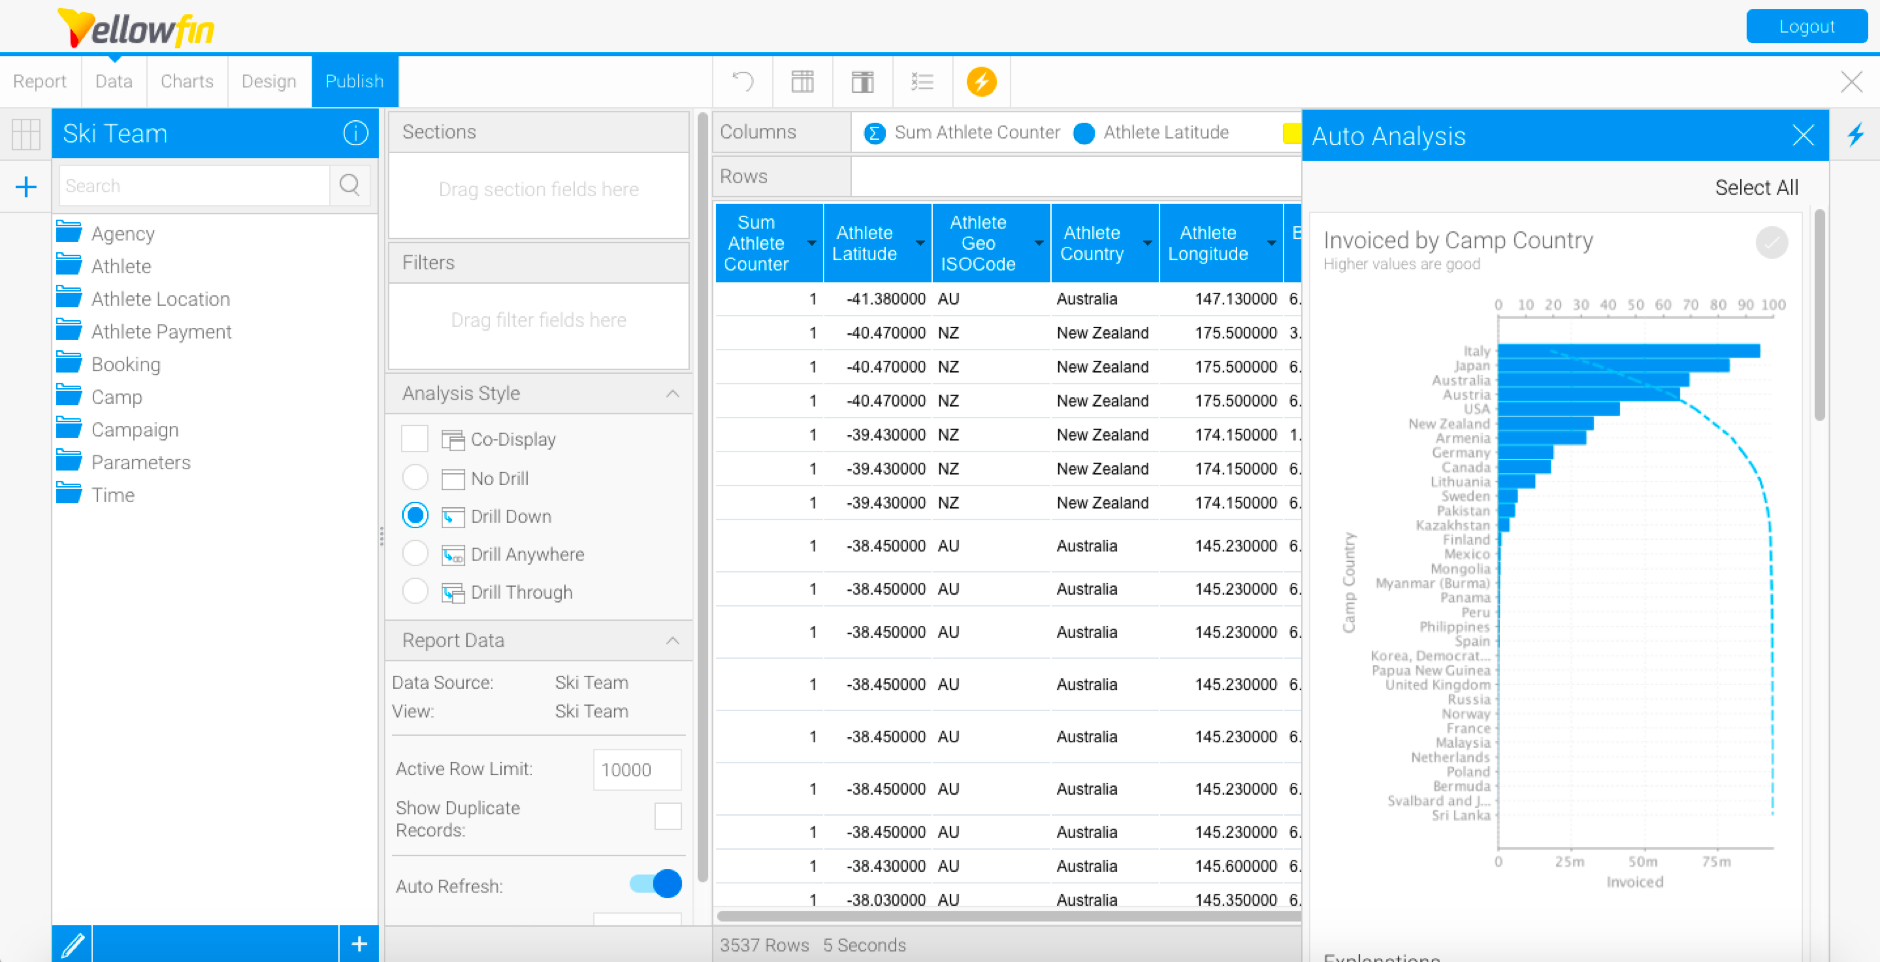
If you wish to make any changes to the reports, you can do that here.
To see an enlarged version of a chart and clear narratives, simply click on it.
Note: To close the Auto Analysis panel, simply click on the Insights button on the right side of the screen.

To update charts, click on the Charts button to navigate to the Chart Builder.
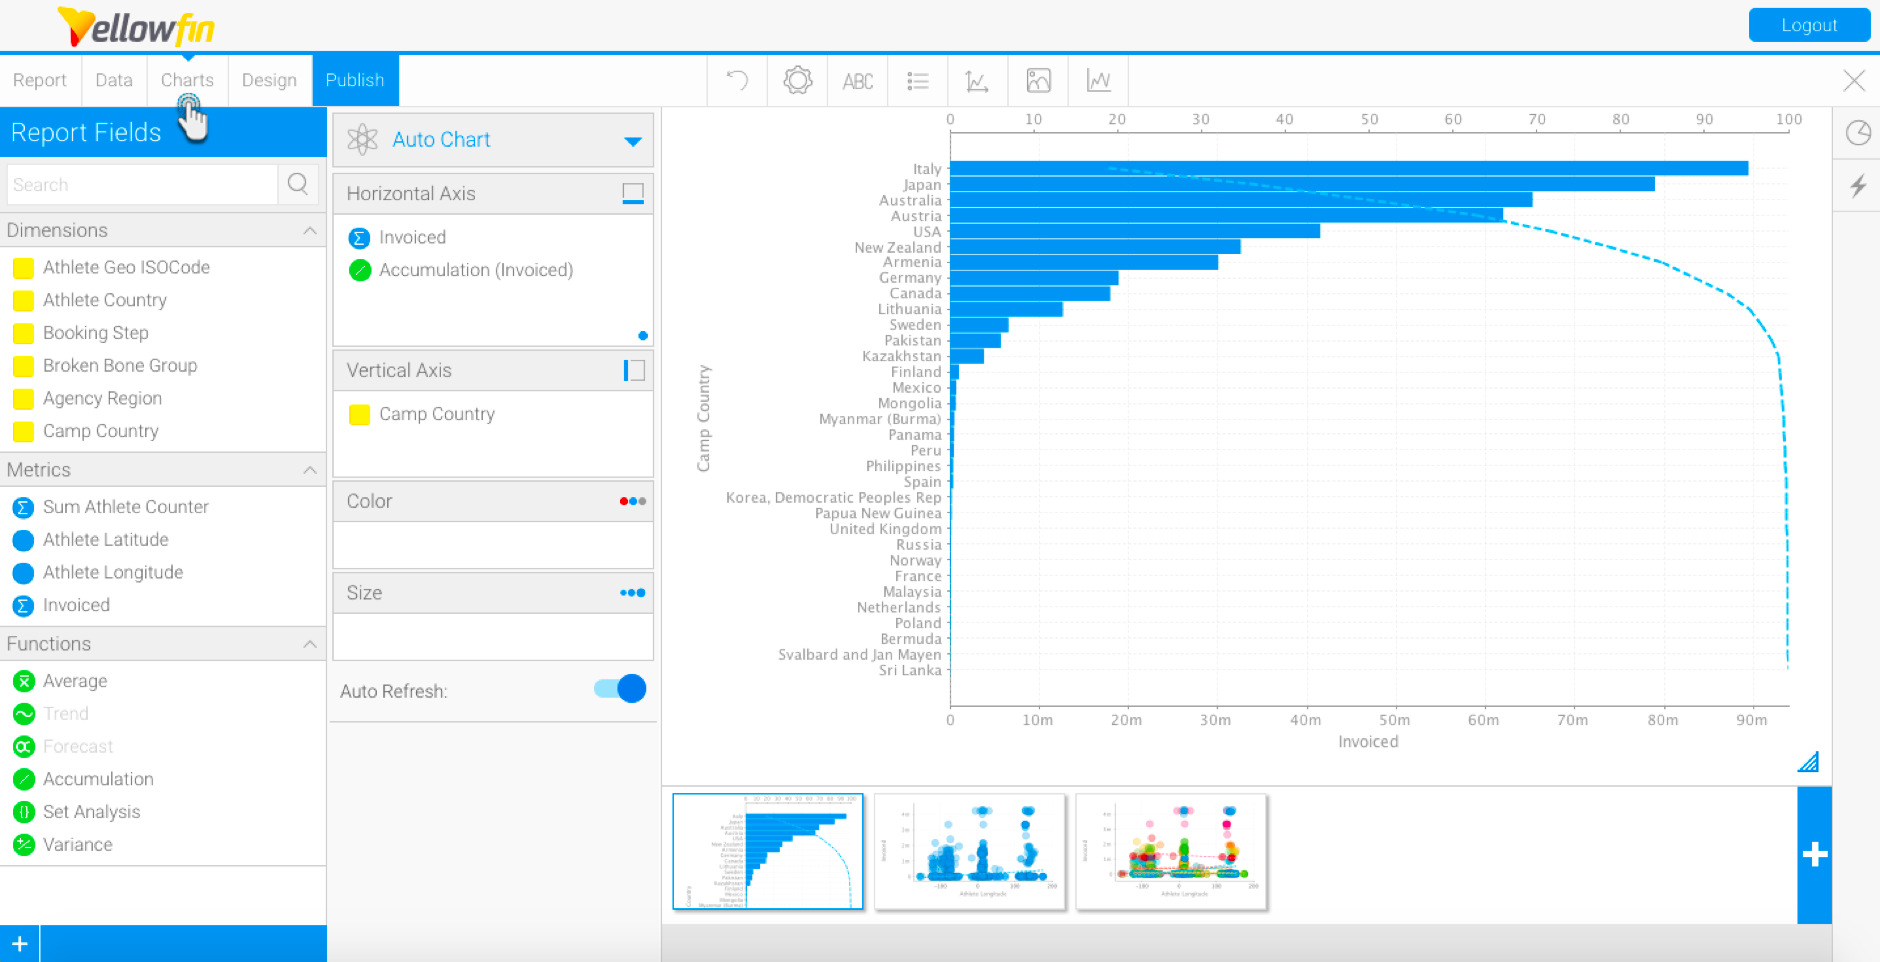
You can edit the chart(s) further if you wish to.
Then save the new report by clicking on the Publish button.

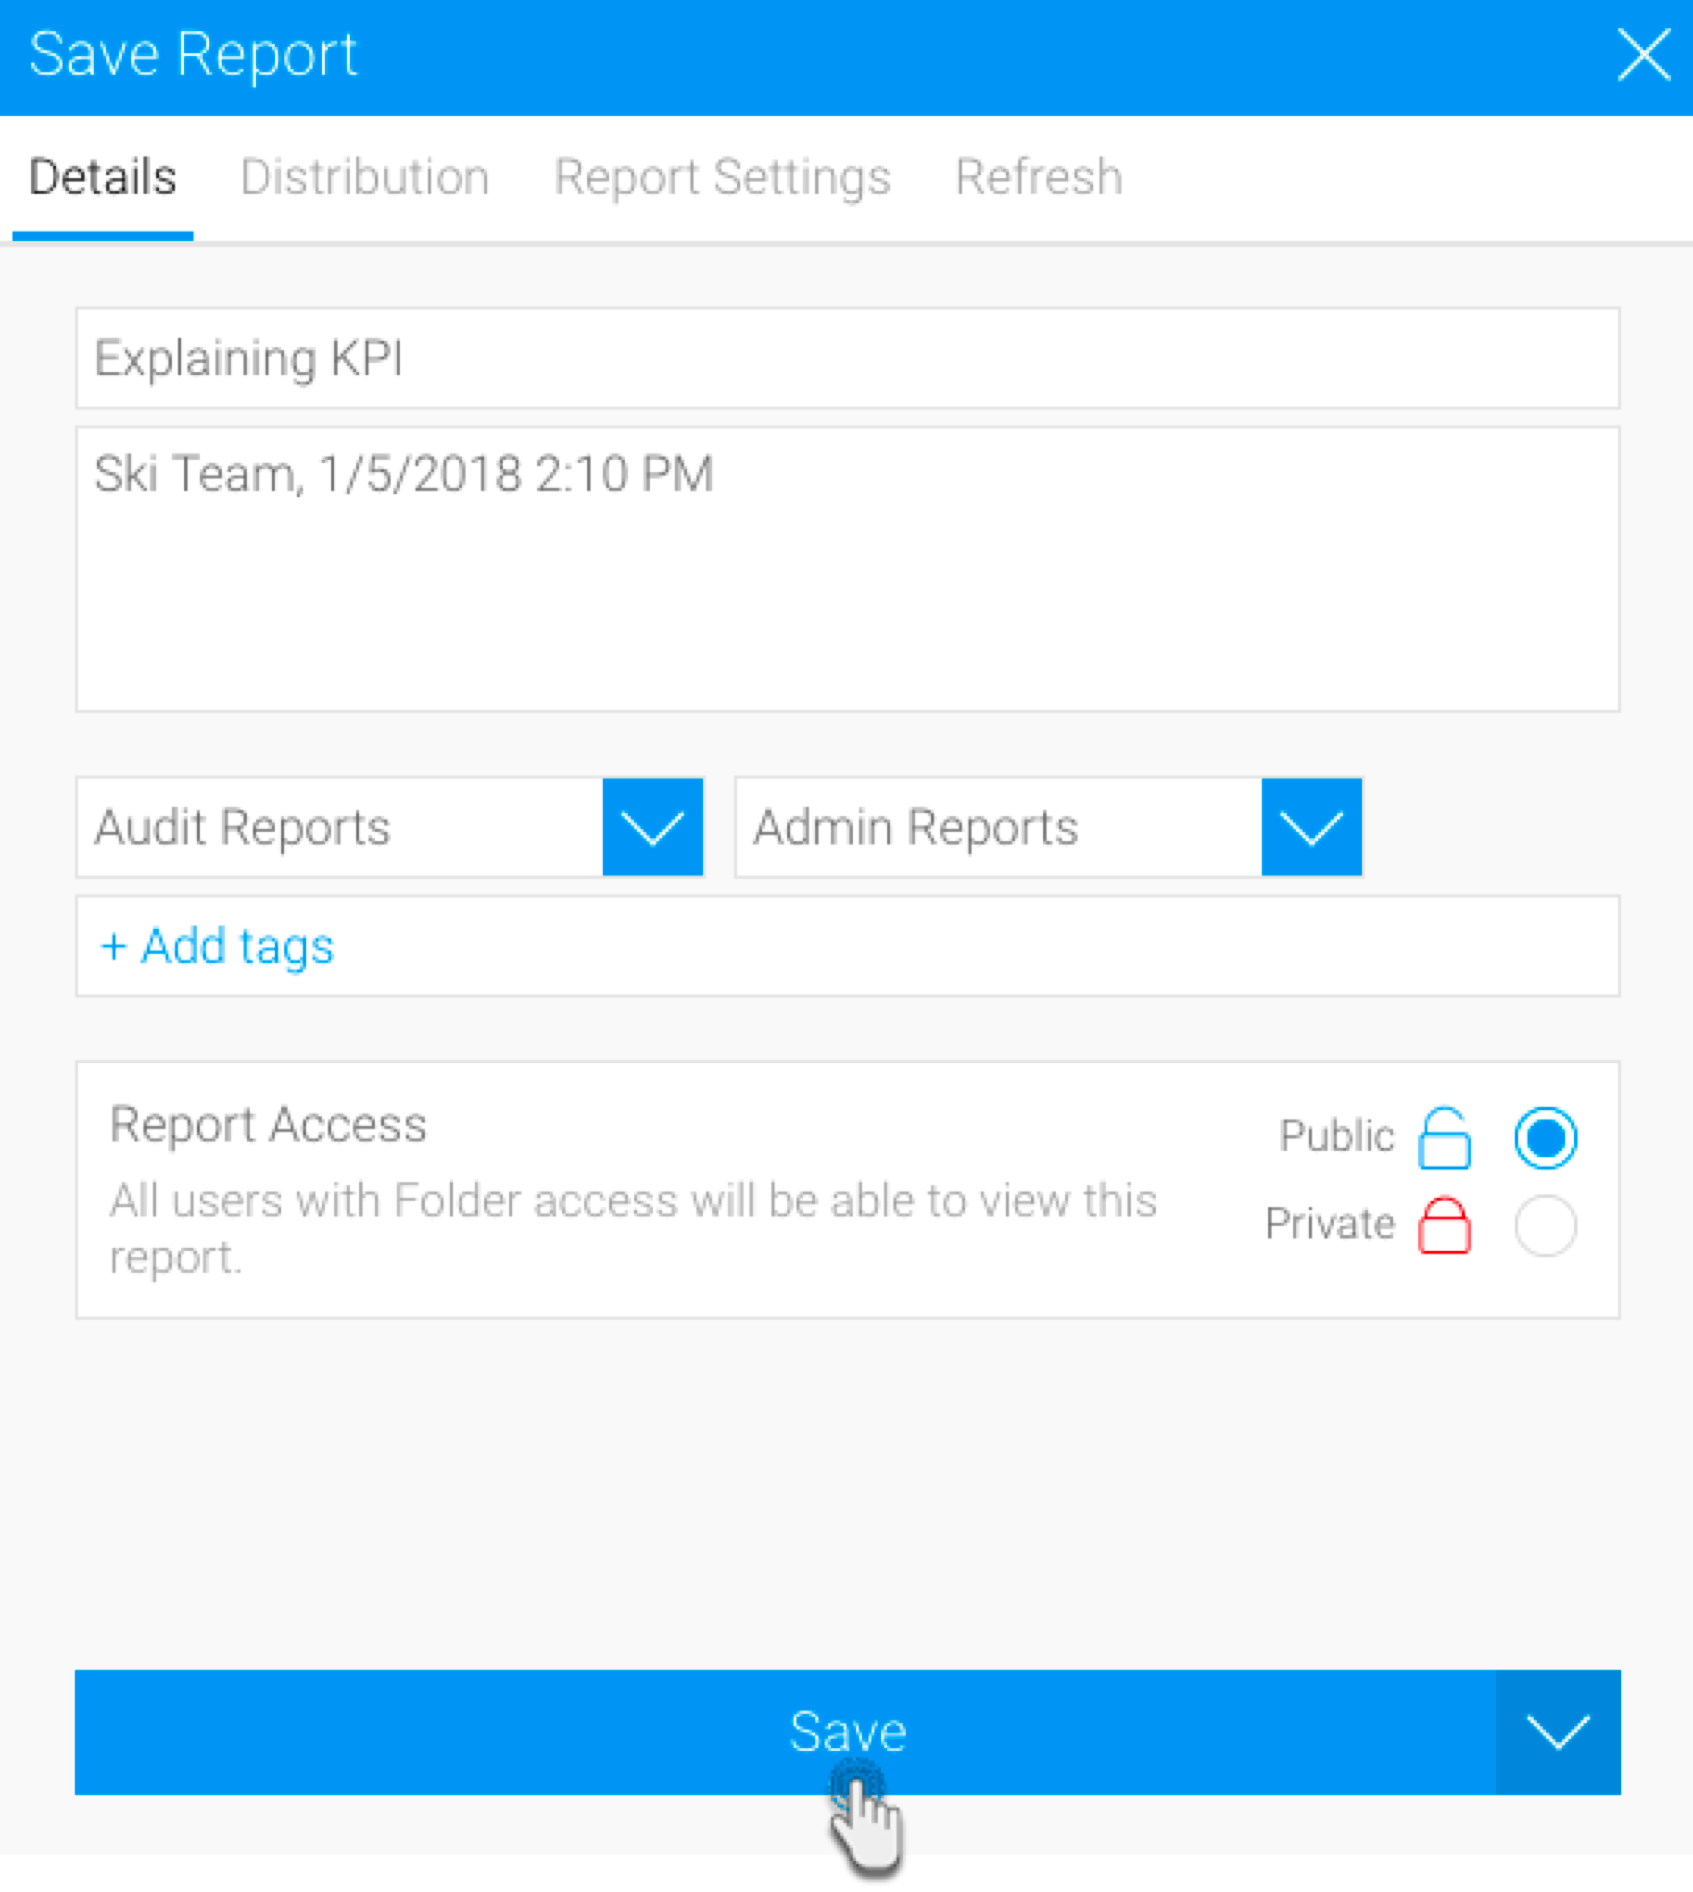
Provide report details, and select it’s destination folder, and then click Save.
These reports and charts can now be used as any other Yellowfin reports.

...
- Choose the insights that you wish to save.
- Insights can be saved or shared using the Save Insights section at the bottom of the Auto Analysis panel.

- Enter a comment.
- You can also attach a file by using the attachment icon.
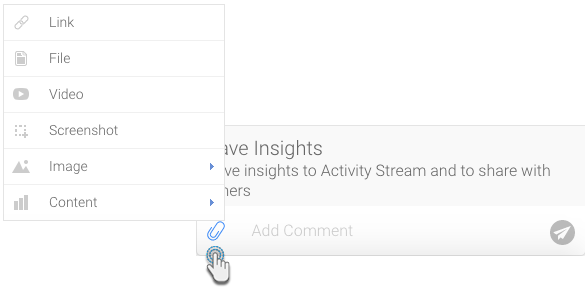
Then click on the send icon.

This will be added to the activity stream of the chart or dashboard. (For more information on the activity stream, click here.)
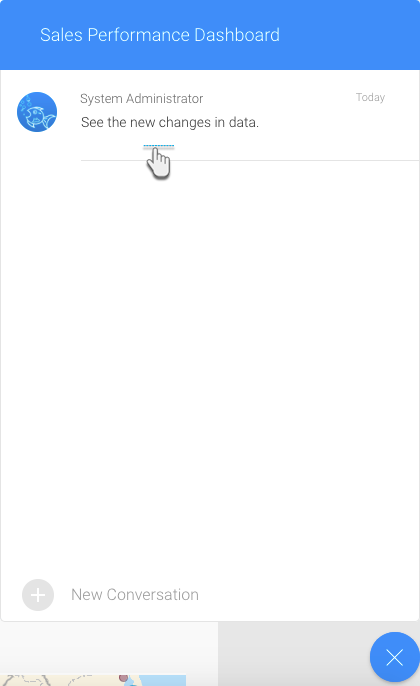
- Click on this comment to view the saved insights in the activity stream.
...