Like what you see? Have a play with our trial version.

Error rendering macro 'rw-search'

null

Versions Compared

Key

  • This line was added.
  • This line was removed.
  • Formatting was changed.

...

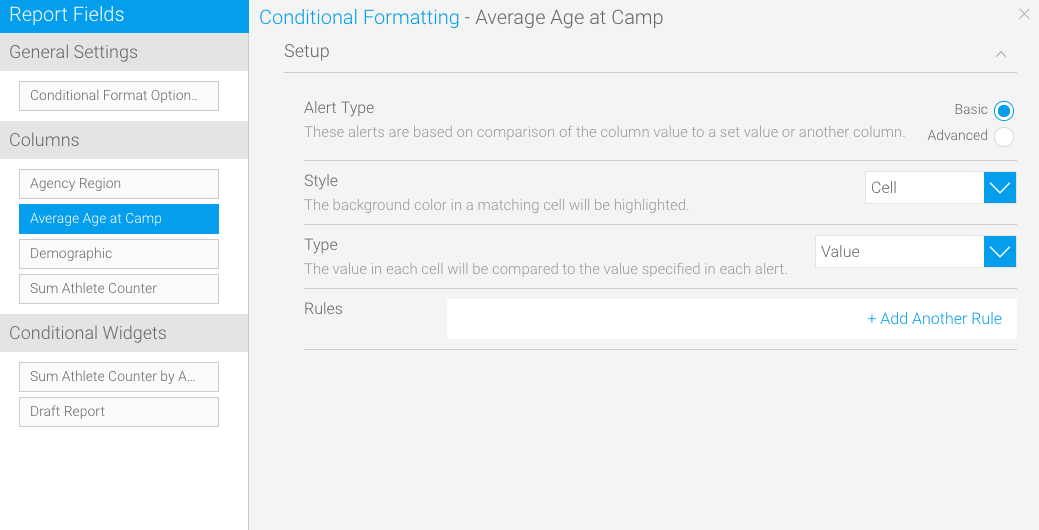
You can create rules on report columns and even canvas widgets to highlight or alter data when a match is made on the content. 


Note

Based on the data type of the column, the styling options will differ.


Rules on Report Columns

While on the Conditional Formatting popup window, you can create rules with different types of styling. Yellowfin allows users to add three types of styles when rules are matched, as explained below:

Based on the data type of the column, the styling options will differ.

  • Choose the Basic option from the Alert Type
  • Select Cell from the Style dropdown
  • Choose the type of comparison
  • Click on the +Add Another Rule link; a new pop to format matching cells in the report will appear
    1. Start creating a rule by choosing an operator and then adding a value
    2. Set a style to highlight the matching cells

  • Expand
    titleCell

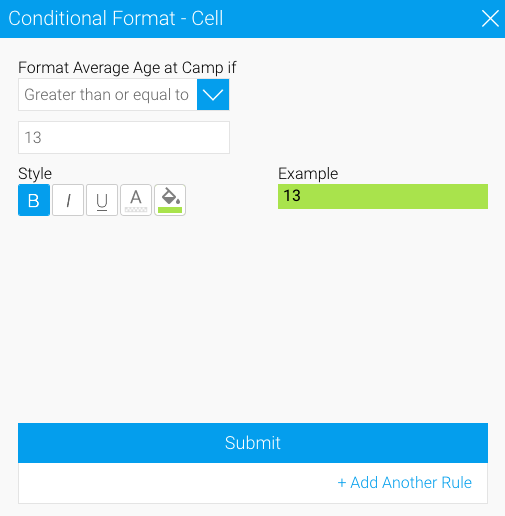
    This can be used to highlight the background colour in a matching cell. For example, you can make it so that if the profits on your monthly report hit a number greater than 500,000, that data will be highlighted with a blue colour.

    Follow these steps:

    1. Choose a column from the left side, on which the formatting will be applied

    Note
    IconStyle typeDescription
    BoldTo make the matching values appear bold.
    ItalicMake your values italic with this option.
    UnderlineAdd an underline to the matching values.
    Font colourChange the colour of the font.
    Background colourChange the background colour of the matching cell.

  • Click on the Submit button to save the rule
  •  

    Expand
    titleIcon

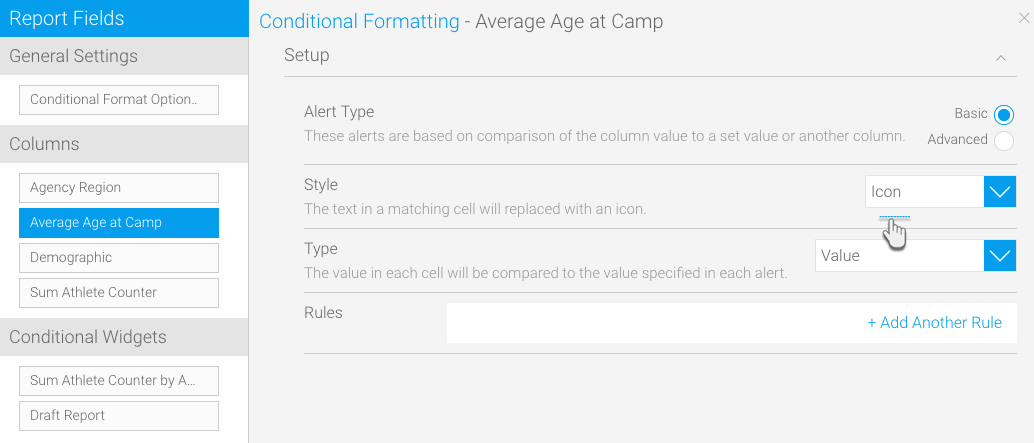
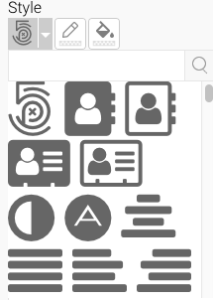
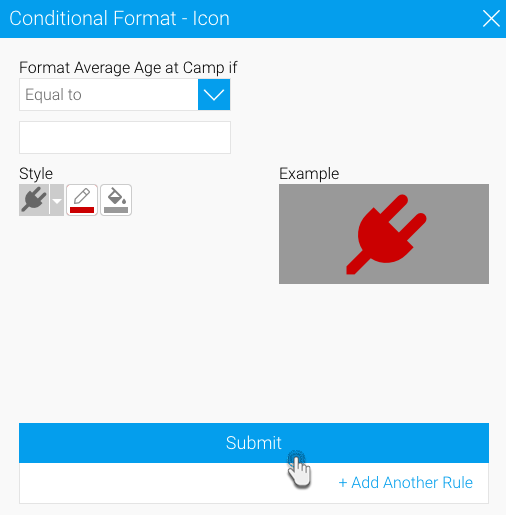
    This can be used to replace the text in a matching cell with an icon.

    Follow these steps:

    1. Choose a column from the left side, on which the formatting will be applied

    2. Choose the Basic option from the Alert Type

    3. Select Icon from the Style dropdown
    4. Choose the type of comparison
    5. Click on the +Add Another Rule link; a new popup to format matching cells in the report will appear
      1. Start creating a rule by choosing an operator and then adding a value
      2. Choose an icon; you can also alter its colours

        IconStyle typeDescriptionScreenshot
        Select iconChoose from a range of icons
        Forefront colourChange the forefront colour of the icon. 
        Background colourChange Update the background colour of the icon. 
      3. Click on the Submit button to save the rule
      4. This icon will now appear wherever matched data is found in your report


    Expand
    titleBar

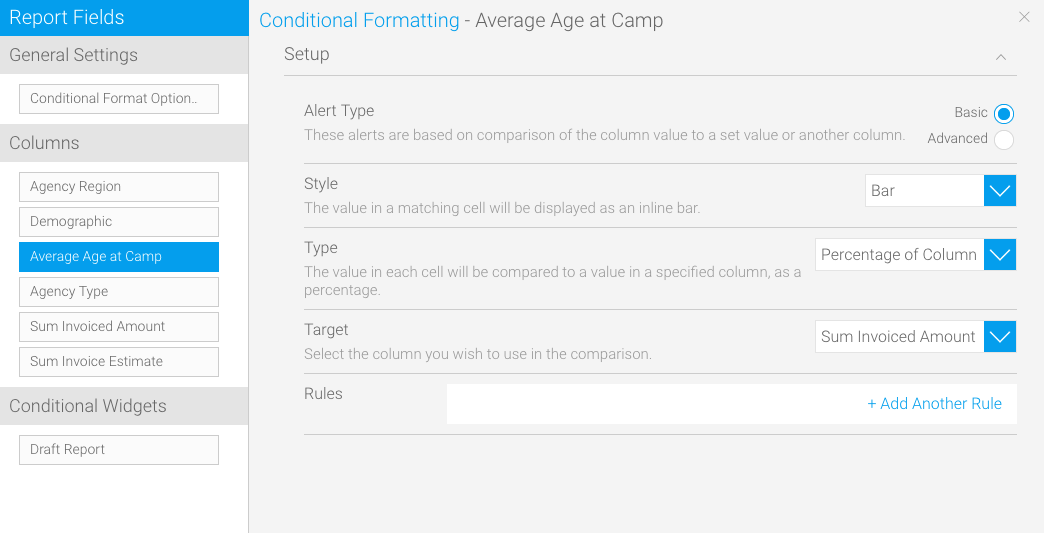
    This is used to make the value in a matching cell display as an inline bar. (Note: This type of styling can only be applied to certain types of content.)

    Follow these steps:

    1. Choose a numeric column from the left side, on which the formatting will be applied.

    2. Choose the Basic option from the Alert Type

    3. Select Bar from the Style dropdown
    4. Choose the type of comparison
    5. Select a target value
    6. Click on the +Add Another Rule link; a new popup to format matching cells in the report will appear
      1. Start creating a rule by choosing an operator and then adding a value
      2. Style the bar you want to make appear on the matching cells

        IconStyle typeDescription 
        Select iconChoose from a range of icons  
        Image AddedForefront colourChange the forefront colour of the icon.  
        Image AddedBackground colourChange the background colour of the icon.  
        Image Added   
            
      3. Click on the Submit button to save the rule
      4. This icon will now appear wherever matched data is found in your report


    ...