Page History
...
| Location | Screenshot | Description |
|---|---|---|
| Function List |  | You can drag a function from the function list on the left side of the chart builder screen. These fields will become available once required field components have been added to the chart. For example, some functions require a metric to be based on. |
| Field List | 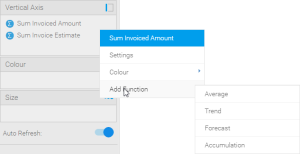 | You can add a function directly from the field you wish to base it on , by hovering:
|
Selecting a Function
Once you have added a function to your chart, you can change the specific function being applied by clicking on the drop down menu on the field (hover the mouse over the field name).
...
| Styleclass | ||
|---|---|---|
| ||
Set Analysis
| Styleclass | ||
|---|---|---|
| ||
| Option | Description |
|---|---|
| Set Name | |
| Set Metric | |
| Filter |
Variance
| Styleclass | ||
|---|---|---|
| ||
| Option | Description |
|---|---|
| Variance Name | |
| Variance Between | |
| Display Variance as |
| horizontalrule |
|---|
| Styleclass | ||
|---|---|---|
| ||