Like what you see? Have a play with our trial version.

Error rendering macro 'rw-search'

null

Versions Compared

Key

  • This line was added.
  • This line was removed.
  • Formatting was changed.

...

LocationScreenshotDescription
Function ListImage RemovedImage Added

You can drag a function from the function list on the left side of the chart builder screen.

These fields will become available once required field components have been added to the chart.

For example, some functions require a metric to be based on.

Field List

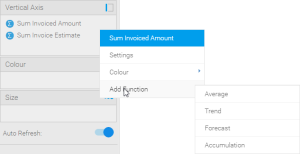
You can add a function directly from the field you wish to base it on:

    1. Hover the mouse over the field in the chart area,
    2. Select Add Function from the drop down list, and
    3. Choose the function group to be used.

...

OptionDescription
Variance NameThis specifies the display name of the resulting variance field, used in the chart labels and/or legend.
Variance Between

This allows you to select two fields or data sets to apply the variance calculation to. The values in the second field will be subtracted from the values in the first field, as part of the calculation, so order is important.

There These are two the types of field available to be used as part of a variance (selected through the drop-down):

  1. Chart Fields - all standard fields used in a chart will be available, as well as:
    1. Chart Aggregated fields - this means you could calculate the variance between the chart aggregated field and it's original report field.
    2. Set Analysis fields - this means that you can calculate the variance between two sets that have already been created.
  2. Report Fields - all metrics included in your table. This means that you don't necessarily have to use a metric in your chart to include it in the variance calculation.


Or enable the Custom Set toggle to perform set analysis through the Create button.
Image Added

Display Variance as

This allows you to select how the resulting variance values are displayed. There are two four options:

  1. # Value - this This will display the result of subtracting field one from field two, as a number.
  2. % Percentage - this This will display the result of subtracting field one from field two, divided by value one (a percentage result).
  3. % of Total Variance - This calculates the  percentage of the total variance. (The total variance is either set on the report/chart field or is the default sum.)
  4. % Change in Relative Proportion - Use this formula to calculate the percentage change in relative proportion. That is, the percentage of the total second value is subtracted from the percentage of the total first value, and this amount is divided by the percentage of the total second value. (The total is either set on the values, or is the default sum.)


Learn how to use a Variance function here.


horizontalrule
Styleclass
ClasstopLink

top