Page History
...
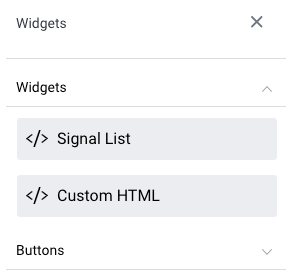
The following types of code widgets are available in Yellowfin out-of-the-box.
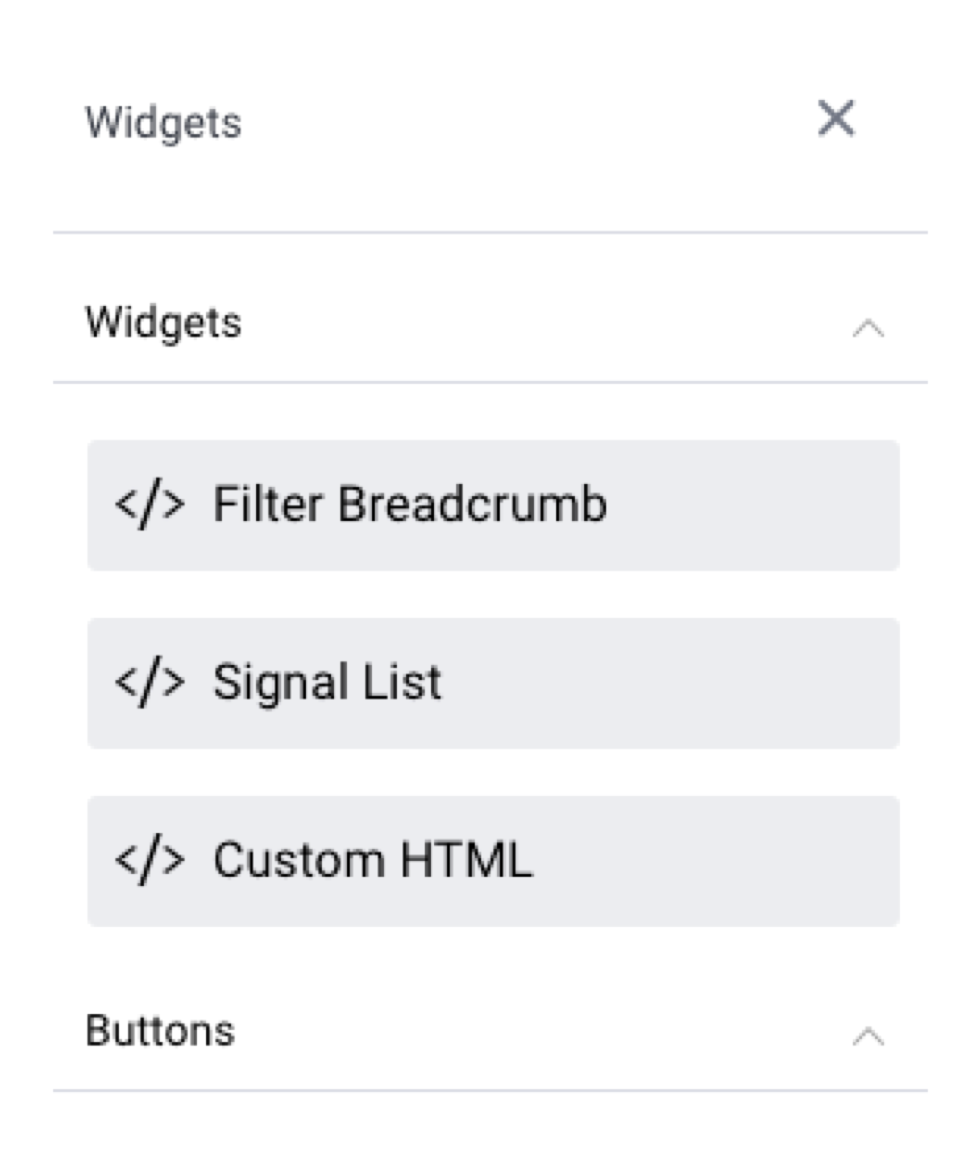
Code Widget type | Description | Used to display a filter breadcrumb trail to aid in filter navigation on the dashboard. Learn more. | |
|---|---|---|---|
Add a Signal List to a dashboard. | |||
Drag in this widget anywhere on your canvas, and then jump to Code Mode to instantly start coding HTML within the widget’s tags. | |||
Expand this section to add buttons that perform actions and functions on a dashboard. |
...
Here's how to use the out-of-the-box Yellowfin Code Widgets.Anchor
Filter Breadcrumbs
This widget displays a breadcrumb trail of selected filter values on your dashboard. This is useful when you have co-dependent filters (where one filter selection updates another filter’s values), and you wish to display which filter values a dashboard user has applied.
...
Code Widgets
...
.
...
| Anchor | ||||
|---|---|---|---|---|
|
...
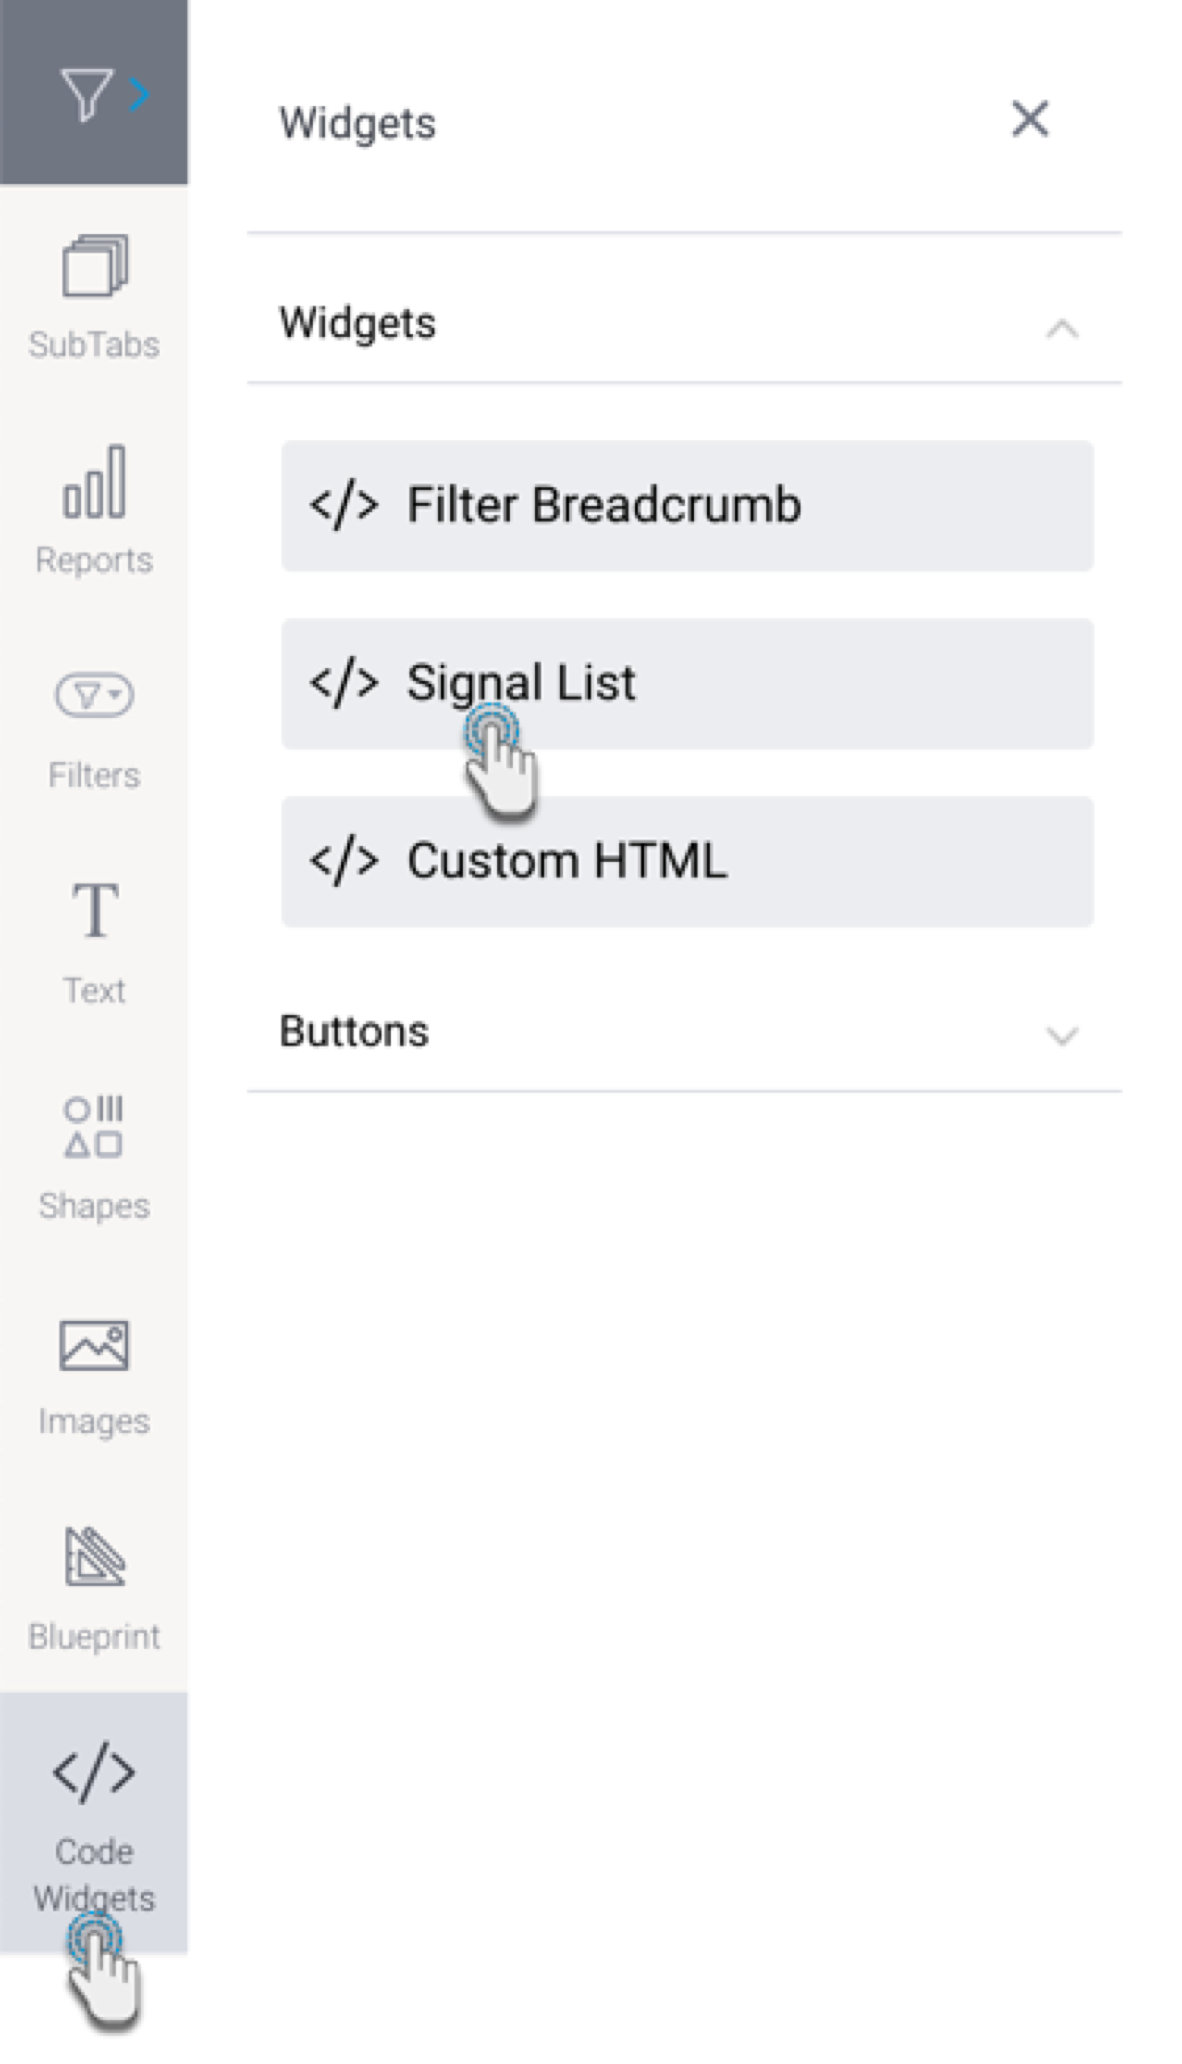
- Click on the Code Widgets button on the left.
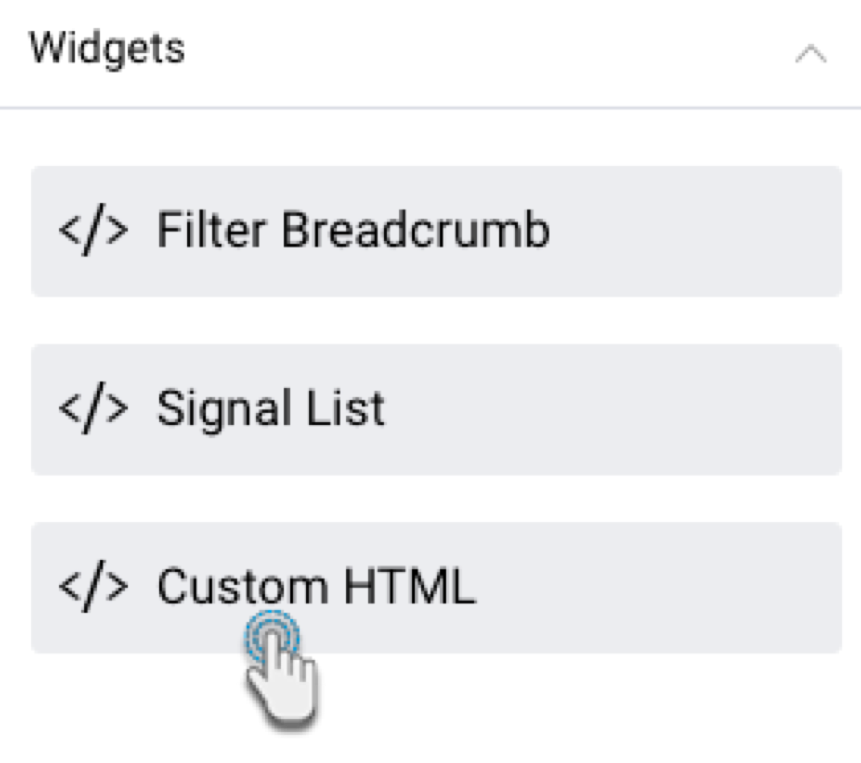
- From the Widgets section in the list that appears, drag the Custom HTML widget onto the canvas.

- Switch to Code Mode through to toggle on top of the dashboard.
- From the list of objects on the left, click on the Custom HTML object to highlight or navigate to the exact code section. Tip: this object list displays all objects added to the dashboard and is used to find the exact code for a particular object so it can be edited.
- Once located, enter your HTML code into the widget’s code.
- If you navigate back to Visual Mode, you will be able to see the output of your HTML content.
...
- Click on the Code Widgets button, and expand the Widgets section (expanded by default).
- Drag the Signal List widget onto the canvas.

- Upon doing so, the Properties panel will be updated to show properties of this widget.
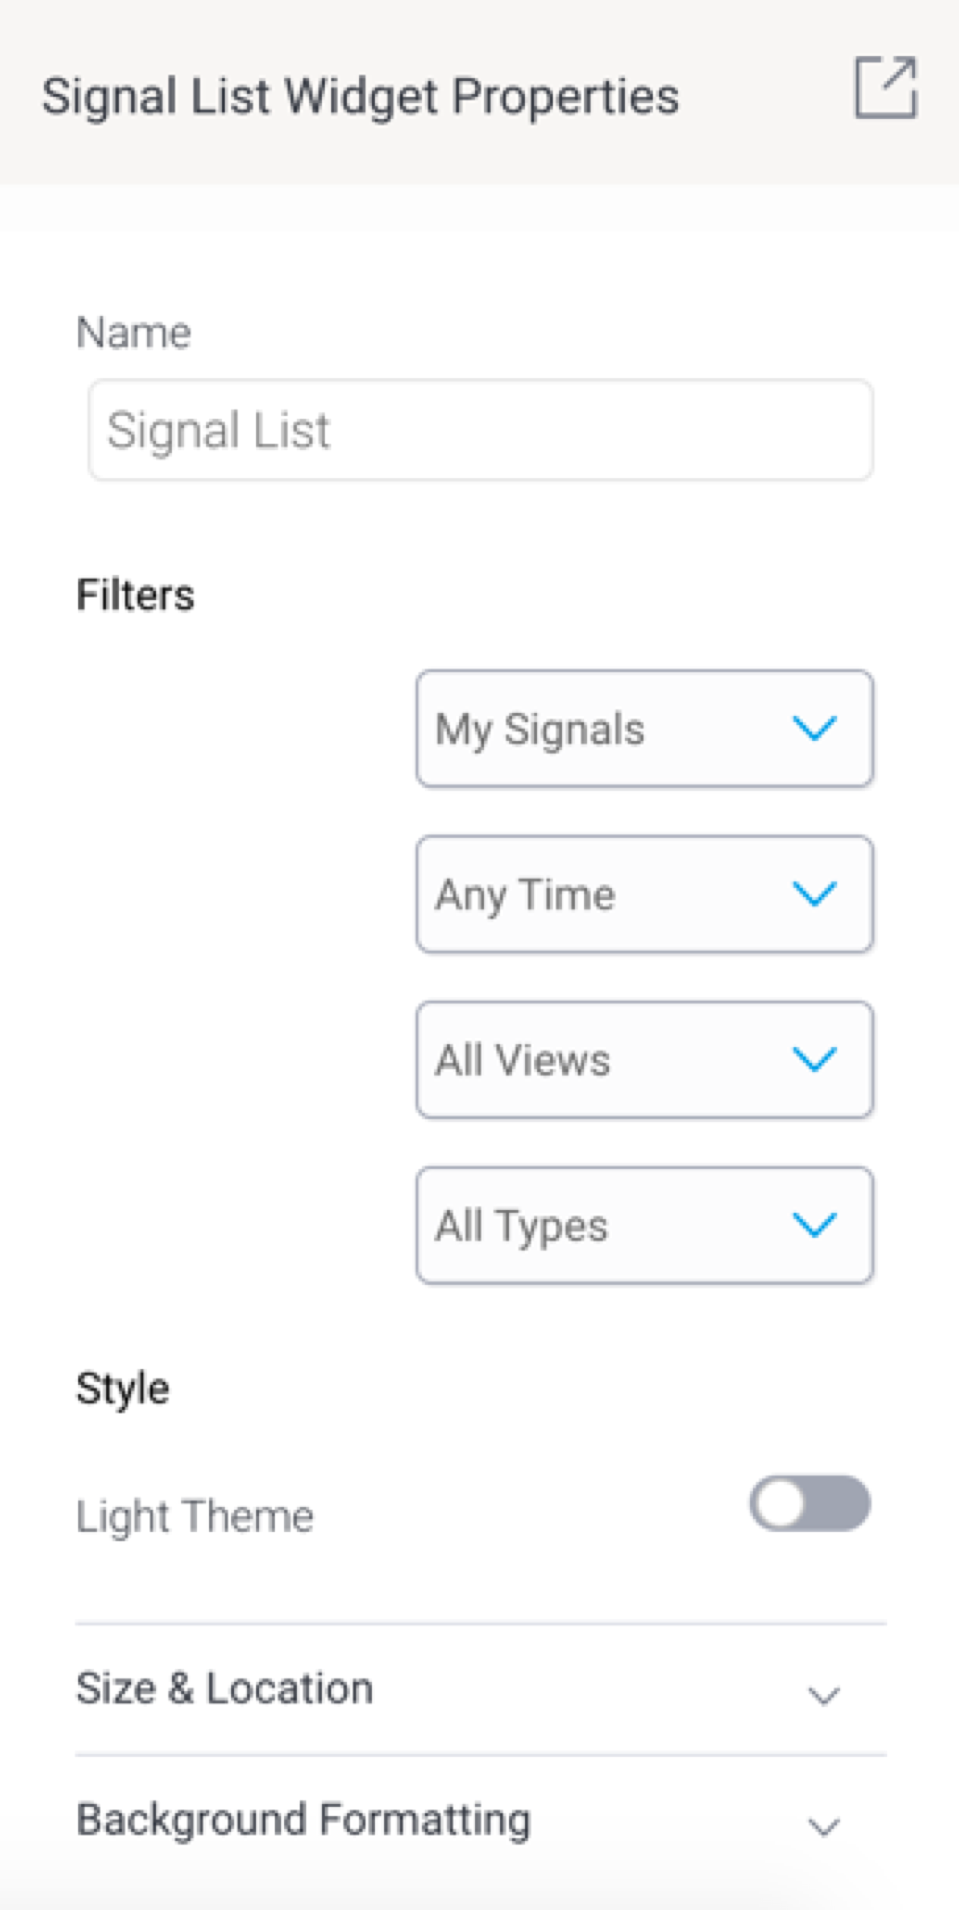
- You can select filters values to filter the signal widget list. The available options allow you to view Signals according to:
- Signal Status: this includes Signals added to your watch list, ones that were recently viewed, those that have been closed, or dismissed signals.
- Time: view signals according to a pre-selected time range, such as those occurring in the last 30 days. Choose Anytime if you do not want to limit signals according to time.
- Views: display signals that were detected within a specified view.
- Signal Type: display signals of a specific type, such as only show Spikes and Drops.
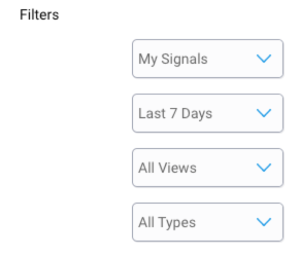
- Note that the list will be saved according to the filters applied. This ‘filtered’ list will appear on the published dashboard.
- Refer to the properties section for a description on all properties related to this widget and how to configure them.
...