Page History
| Anchor | ||||
|---|---|---|---|---|
|
| Table of Contents | ||
|---|---|---|
|
Overview
| Styleclass | ||
|---|---|---|
| ||
...
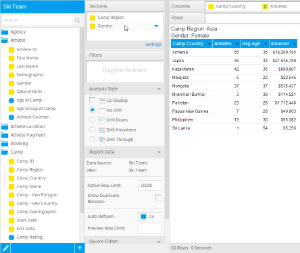
Breaking a report into sections is a way of spitting large tables of data into smaller, more comprehensible parts. Each section contains at least one table, and at least one section cell, as illustrated above.
Adding a Section
| Styleclass | ||
|---|---|---|
| ||
Single Section Breaks
To create a section, just drag an item from your report data field list or move an item from an existing column in the report.
In the example below the Athlete Region is dragged from the column fields to the report sections box. This will split the tables on the report into one section for each Athlete Region.
...
You can insert any number of section breaks on a table or crosstab table. When you have more than one section in a table or crosstab table, the breaks are assigned levels. Yellowfin assigns level 1 to the first break you insert, level 2 to the second and so on. You can rearrange these levels in the Report Section Edit box.
Changing Break Order
| Styleclass | ||
|---|---|---|
| ||
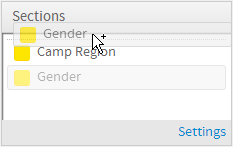
- Select the field that you wish to change the order of.
- Drag and drop that item to the position in the list that sets the order you require.
Deleting a Section Break
| Styleclass | ||
|---|---|---|
| ||
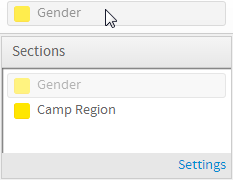
- Click on the section field you wish to remove
- Once highlighted, drag off to an area that can't contain a field
Sections & Charts
| Styleclass | ||
|---|---|---|
| ||
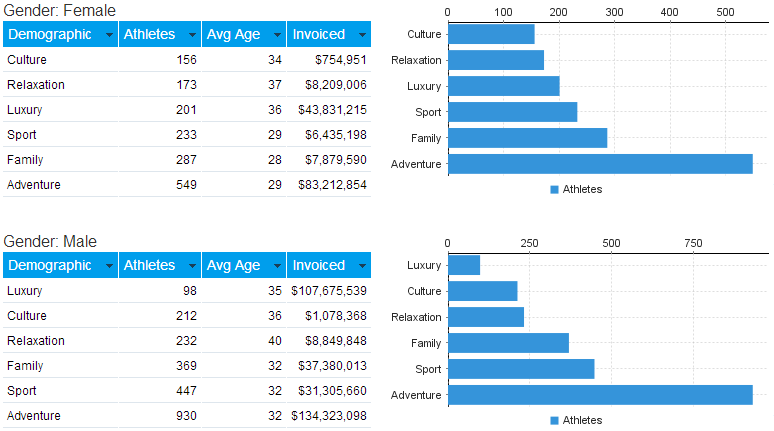
In the example below a separate chart is displayed for both the Female and Male sections.
| horizontalrule |
|---|
| Styleclass | ||
|---|---|---|
| ||