Page History
...
The result is the option for the user to select which series they are viewing on the chart itself, as shown:
Series Selection Types
| Styleclass | ||
|---|---|---|
| ||
...
If you are using a chart type that only has the capacity to display one metric at a time, such as a pie, you will have a drop down list appear at the bottom of your chart, as shown here.

Multiple Series Display
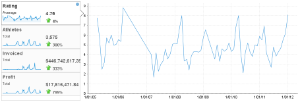
If you have selected a chart type that is compatible with multiple metric display, such as a bar or line, the result will be check boxes, as below.

Time Series Display
If you are using a time series label, you will be able to choose from a standard series selection display (as above), or a panel display, shown below.
...