Page History
| Anchor | ||||
|---|---|---|---|---|
|
| Table of Contents | ||
|---|---|---|
|
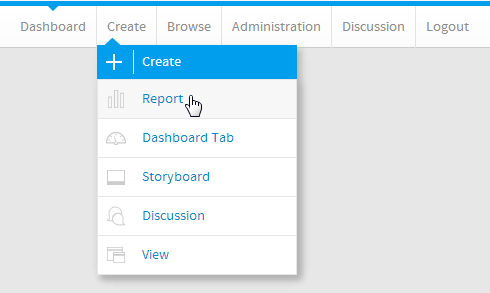
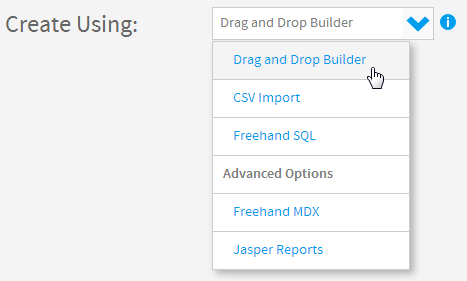
Create Report
| Styleclass | ||
|---|---|---|
| ||
| Section | ||||||||||
|---|---|---|---|---|---|---|---|---|---|---|
|
| Section | ||||||||||
|---|---|---|---|---|---|---|---|---|---|---|
|
| Section | ||||||||||
|---|---|---|---|---|---|---|---|---|---|---|
|
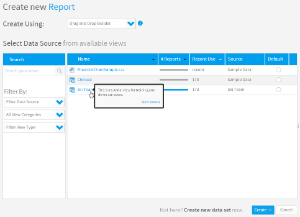
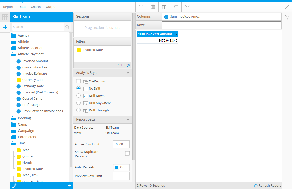
Data Setup
| Styleclass | ||
|---|---|---|
| ||
| Section | ||||||||||
|---|---|---|---|---|---|---|---|---|---|---|
|
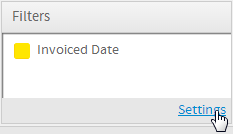
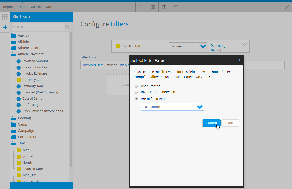
Filter Setup
| Styleclass | ||
|---|---|---|
| ||
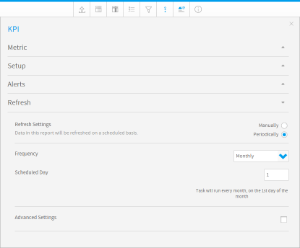
I this example we are going to set the refresh schedule to run on the first of each month. This means that we want the snapshot to capture a month's worth of data. In order to set this up we will add a filter to restrict the results to last month's data.
| Section | ||||||||||
|---|---|---|---|---|---|---|---|---|---|---|
|
| Section | ||||||||||
|---|---|---|---|---|---|---|---|---|---|---|
|
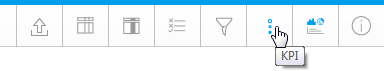
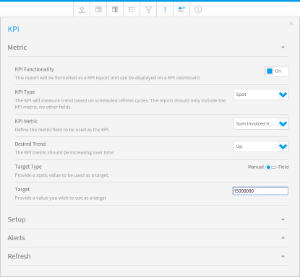
KPI Setup
| Styleclass | ||
|---|---|---|
| ||
| Section | ||||||||||
|---|---|---|---|---|---|---|---|---|---|---|
|
| Section | ||||||||||
|---|---|---|---|---|---|---|---|---|---|---|
|
Spot
KPI reports require several components to be defined that are not required by standard reports. The metric to be monitored must be configured first.
| Section | ||||||||||
|---|---|---|---|---|---|---|---|---|---|---|
|
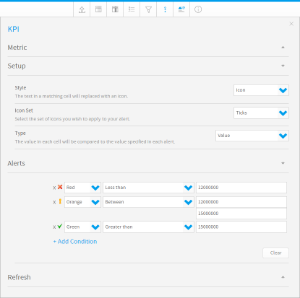
KPI Alerts
The next component required for KPI reports is the Conditional Formatting Alerts displayed to the left of the kpi on the Dashboard. This icon or colour displays an alert for the current status of the value.
| Section | ||||||||||
|---|---|---|---|---|---|---|---|---|---|---|
|
KPI Refresh Schedule
| Section | ||||||||||
|---|---|---|---|---|---|---|---|---|---|---|
|
Report Save
| Styleclass | ||
|---|---|---|
| ||
| Section | ||||||||||
|---|---|---|---|---|---|---|---|---|---|---|
|
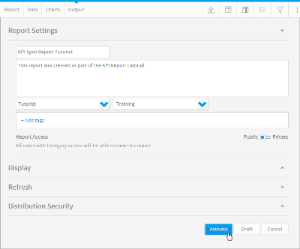
Your KPI report is now complete and ready to be added to a KPI Dashboard Tab.
See KPI Tabs for more information.
| horizontalrule |
|---|
| Styleclass | ||
|---|---|---|
| ||