Yellowfin also lets you create conditional rules using canvas widgets, such as charts, text, images and shapes on the canvas. This way you can, for example, hide charts when a rule's condition is matched.
Charts, titles and images can be hidden as a result of these rules; however shapes can also be stylised.
Formatting Setup
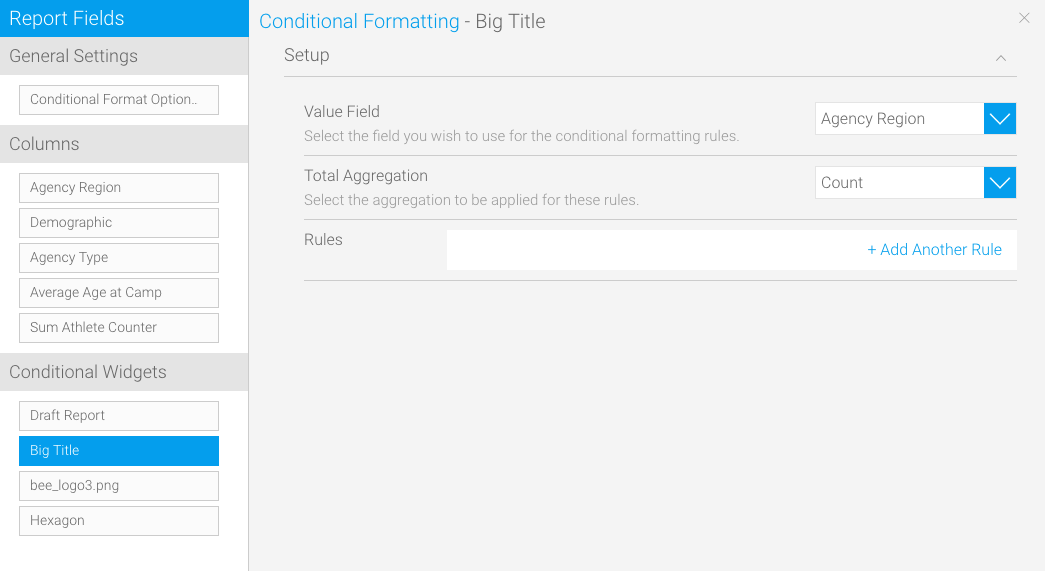
This is what the conditional formatting setup page for a widget looks like:
Image Modified
Option
Description
Value Field
Select the field you wish to use for the conditional formatting rules from the list.
Total Aggregation
Select the aggregation to be applied for these formatting rules.
The Process
Before creating a widget rule, ensure that the widget's conditional formatting feature is switched on. To learn how to do that, see below.
Expand
title
Enable Widget Conditioning
Follow these steps to switch on the conditional formatting feature on a widget:
Once a widget is added to the canvas, click on it to make a menu appear on top of it
Click on the dotted menu icon here to control with the widget's settings
Image Modified
Expand the Conditional Formatting label
Click the button to enable its feature
You can also click on the Edit Rules button at the bottom to jump to the conditional formatting window Image Modified
Follow the steps below to create a rule on the different types of widgets:
Expand
title
Charts, Images, Titles
You can simply hide charts, images and text titles from your canvas as a result of meeting a conditional format rule.
Follow these steps:
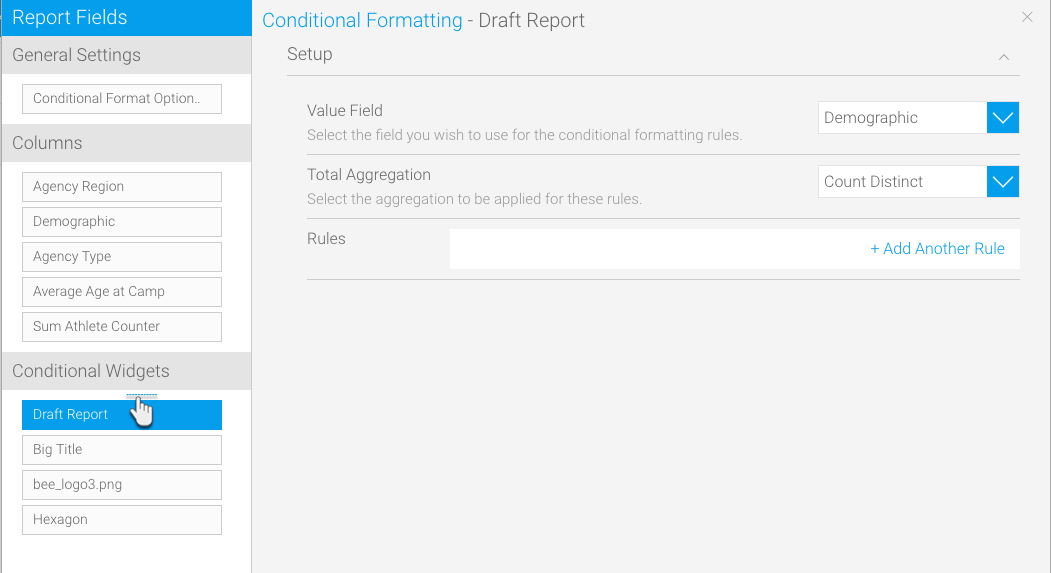
Choose a widget from the left side under the Conditional Widgets section, on which the formatting will be applied.
Select the value field
Choose a total aggregator Image Modified
Click on the +Add Another Rule link; a new popup to format canvas widgets will appear
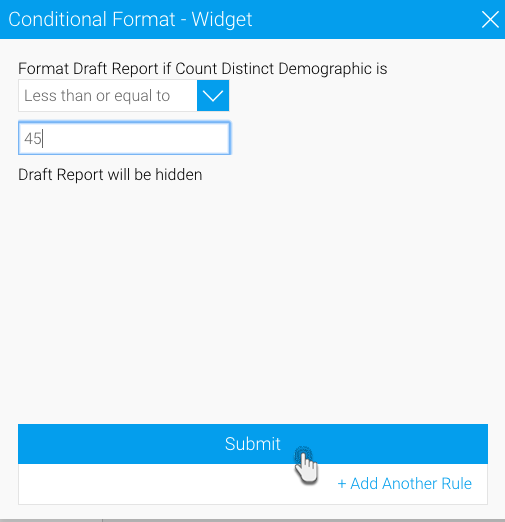
Start creating a rule by choosing an operator
Then enter a value
Click on the Submit button to save the rule Image Modified
The widget will now disappear whenever the rule is matched
Expand
title
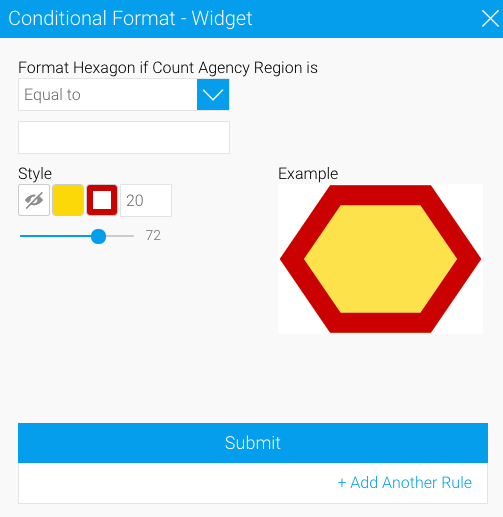
Shapes, Lines, Icons
For shapes, lines and icons in your canvas, you can set a style for them whenever the rule's condition is met.
Follow these steps:
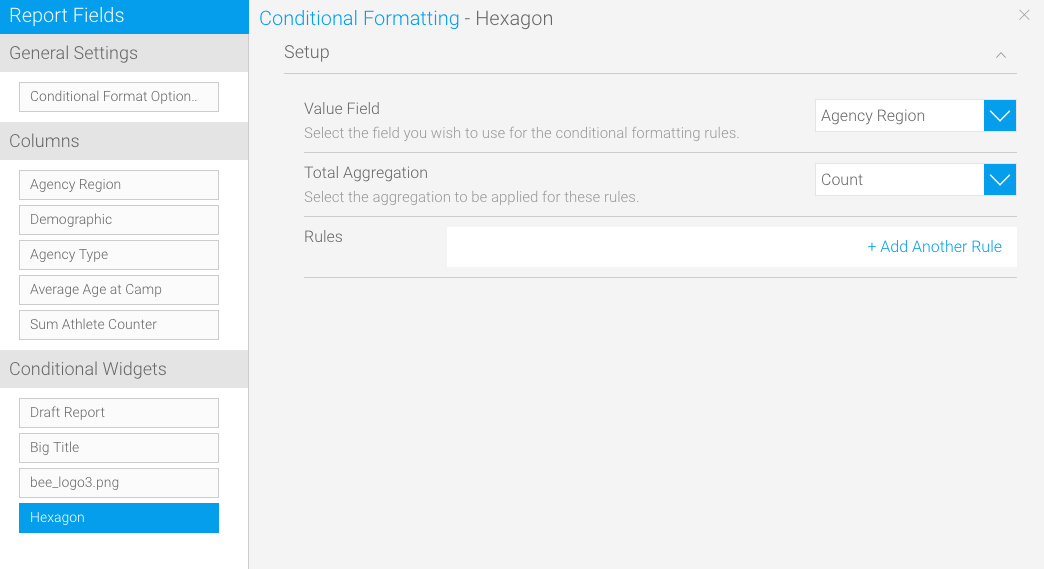
Choose a shape widget from the left side under the Conditional Widgets section, on which the formatting will be applied.
Select the value field
Choose a total aggregator Image Modified
Click on the +Add Another Rule link; a new popup to format canvas shapes will appear
Start creating a rule by choosing an operator
Then adding a value
Style the widget so that its appearance changes on meeting the condition
Icon
Style type
Description
Image Modified
Hide shape
Hide the widget shape from the canvas.
Image Modified
Shape colour
Change the inner colour of the shape widget.
Image Modified
Border colour
Change the border colour of the shape widget.
Image Modified
Border size
Set up the size of the border.
Image Modified
Opacity
Drag this bar to change the value of the opacity, making is lighter or more vivid.
Click on the Submit button to save the rule Image Modified
This shape will alter its appearance wherever matched data is found in your report