Page History
...
Chart Data Options
Option | Description |
|---|---|
| JavaScript Code Panel | Use this panel to enter the JavaScript code. |
| CSS Panel | This panel is used to provide the CSS code. |
| Preview Panel | You can generate a preview of the your code in this panel. |
Security
To switch on JavaScript chart functionality within Yellowfin, the administrator needs to engage a 2-layer system. To switch it on, you need to:
- Enable it within the Configuration page (Admin Console- >Configuration->System->Security->JavaScript Charts)
- Enable the function within the selected Role (Role->Report Builder->JavaScript Charts)
It is recommended to have a new role set up just for JavaScript chart creators and editors. This ensures that JavaScript chart functionality is carefully managed and can be revoked when not needed.
Click here to learn how to enable the JavaScript functionality.
What happens when JavaScript chart functionality is switched off?
If JavaScript Chart functionality is switched off at the Configuration level:
- All JavaScript charts stop executing
- All JavaScript/CSS for the JavaScript charts will not be able to be exported out of the platform
- No JavaScript charts can be imported into the platform
Note that it is also not possible for someone to import a JavaScript chart into the platform without the function enabled against their role.
It is recommended to have your chart developers utilize proper content development and migration strategies in regards to development and testing environments, as well as leveraging our Approval Workflows to ensure governance.
How the generateChart function works
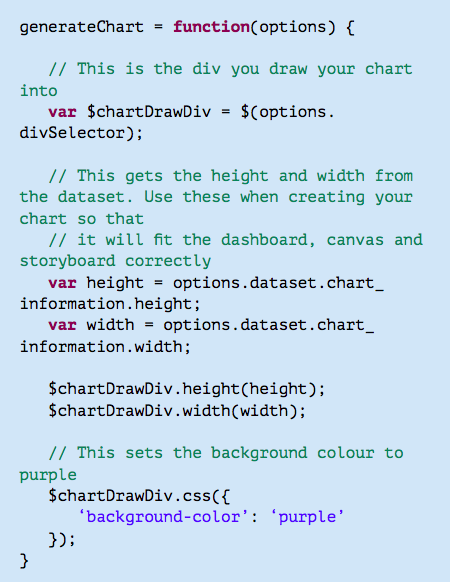
The only function required when creating a JavaScript chart is generateChart. The other functions provided in the example code are recommendations. Yellowfin will call generateChart to execute your JavaScript code.
All the options and data that you need from Yellowfin will be sent as part of the Options JSON object to the generateChart function.
You will be drawing everything into a provided div (options. divSelector) which the dataset will give you the id for.
JavaScript chart Example
This is an example of a very simple piece of JavaScript which will use the width and height sent in via the Options object and set the chart div to be purple.
Require and Shim
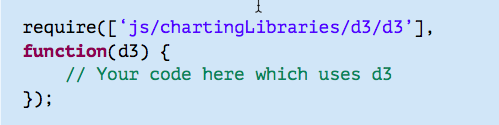
Use Require to load any libraries that you need for your JavaScript chart. If you are planning to embed via JavaScript API or publicly share the report, you will need to use absolute paths. Otherwise, relative paths will be fine.
To use Require, simply define the path of what you need to load as follows:
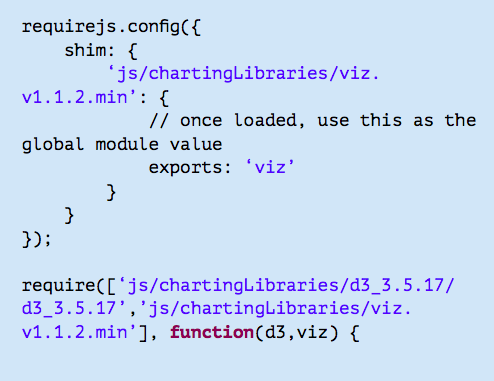
In certain scenarios where a non-AMD JavaScript library is used, Shim is required. While the shipped charting libraries within Yellowfin does not require Shim, you might need it for specific libraries sourced from the Web.
For more information about Shim, please see the requireJS documentation.
Here is an example of using Shim to require the non-AMD library VizJS:
Options JSON object
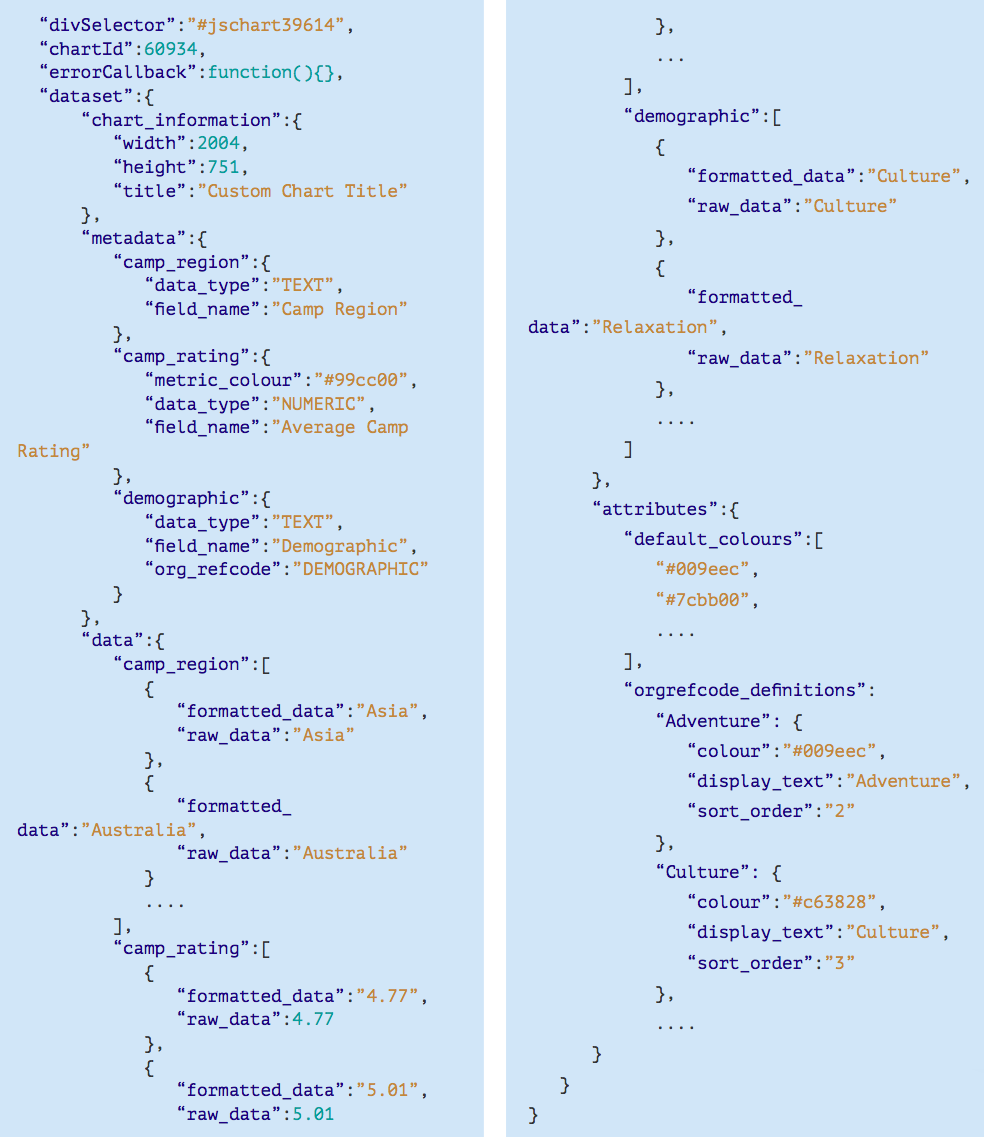
Example of a data set
We will be using the example shown below in our explanations. Please note that some of the data in this example is abbreviated (as shown by . . . . )
1. divSelector (options.divSelector)
A CSS selector using the ID of the div which the chart should be drawn within. This can be used with jQuery, D3 or any library which uses CSS style selectors.
E.g: to select the chart div in jQuery, you would do the following
var $chartDrawDiv = $(options.divSelector);
2. chartId (options.chartId)
The internal Yellowfin ID of the current chart.
3. errorCallback (options.errorCallback)
This is a function you can call to show the default Yellowfin error message. Use this if you want errors from the JavaScript chart to look consistent with Yellowfin styling. It is not required that you use this. This will also print to console the error which occurred.
4. dataset (options.dataset)
The options.dataset object contains attributes which represent report data as well as some rendering information. It can take any of the properties, functions and events from the Report API and the Filters API to create charts that are fully customized and interactive.
The dataset object contains the following attributes:
4.1 chart_information (options.dataset.chart_information)
An object containing information used for chart rendering.
- height and width:contains height and width attributes for the area the chart is rendering into (dashboard portlet, canvas widget, storyboard, chart builder output, JavaScript API). When the chart is a single chart on the report output page, it will be the height & width set for the chart. Ensure that these values are used in your JavaScript chart container to ensure proper resizing.
- title: if a chart title is defined, it will be part of the dataset object.
4.2 metadata (options.dataset.metadata)
Information about the fields in the report. Attribute names are based on the fields in the report (all lowercase with spaces replaced by underscores, and duplicate field names will append numbers to the end of the names). Field names used here correspond to the field names used for the data. Within metadata, these objects below contain the following attributes for each field:
| Attribute | Description |
|---|---|
| data_type | A string representing the data type of the field (TEXT, NUMERIC, etc). |
field_name | The formatted name of the field. If translations are switched on, the translated version of the field name for the user’s preferred language will be returned. |
metric_colour | <Optional> If a metric color has been set for this field at the view level then there will be a metric_colour attribute which contains the hex code (eg, #FFFFFF)for the selected color. |
org_refcode | <Optional> If a field has a ref code applied to it on the data page, then this ref code information will be included with the JavaScript chart dataset object. This returns the ref code name e.g “DEMOGRAPHIC” according to our example above. The Attributes object contains the actual data for the ref code (e.g sort order, display text, color, etc). See orgrefcode_ definitions below. |
4.3 data (options.dataset.data)
An object containing the actual data in the report. As with metadata de ned above, attribute names are based on the elds in the report e.g all lowercase with spaces replaced with underscores. These represent arrays of objects with the following attributes for each field:
| Attribute | Description |
|---|---|
| raw_data | The underlying data contained within this field. |
| formatted_data | The formatted data for this field with prefix, suffix, decimal places, etc. These data arrays are in the order that the data appears in the report. This means that options.dataset.data.camp_region[4] and options.dataset.data.camp_rating[4] refer to the same row of data. |
4.4 attributes (options.dataset.attributes)
An object which contains additional rendering information. This contains the following attributes:
| Attribute | Description |
|---|---|
| default_colours | An array of the default chart colors configured on the Administration->Content Settings page. These are also in the order that they are specified within that page. |
| orgrefcode_definitions | Contains all the org ref code definitions used by any fields on the report. This is a map of maps. The key is the org ref code which matches with the org ref code for the field in the metadata object defined earlier above and is keyed by the field name used in the data object. Each definition contains the color and sort order if they exist, as well as the display text for the org ref code. |
Rendering to PDF
Loading a JavaScript chart onto a page typically requires a chart library to be loaded, as well as its accompanying stylesheets. To embed stylesheets, they will be downloaded using XHR requests, so their server must set appropriate CORS response headers. In particular, Google Charts cannot be rendered to PDF.
Additionally, this . This causes an asynchronous load which could lead to a chart rendering after the rest of the report, depending on the code written around it.
This can be problematic during exports to PDF because Yellowfin has no way of knowing when a JavaScript chart has loaded.
To combat this, the options object contains functions to alert Yellowfin that it needs to wait for a JavaScript chart to render and to notify Yellowfin when rendering is complete. The functions blockRenderComplete and renderComplete can be used together to achieve this.
blockRenderComplete
This function tells the report that this chart needs to wait before sending a finished signal to the PDF renderer, as there may be some asynchronous code that needs to be executed. This should be one of the first things that is called as part of your JavaScript chart implementation.
If blockRenderComplete is called, another part of your JS chart code should also call the renderComplete function to tell the report that the chart has completed.
renderComplete
This function tells the report that this chart has finished rendering and can now trigger the report render complete signal to any process that is listening for it (ie, the PDF renderer).
If blockRenderComplete has not been called at some point in your JS chart this will have no effect on the reports render status. If blockRenderComplete has already been called, renderComplete must also be called.
Examples
An example of just adding some text to the $chartDrawDiv element:
| Code Block | ||
|---|---|---|
| ||
generateChart = function(options) {
    options.blockRenderComplete(); //Prevents this report from being marked as renderComplete until "renderComplete" is also called;
    var $chartDrawDiv = $(options.divSelector);

    setTimeout(() => {
        $chartDrawDiv.text('Hello World');
        options.renderComplete();
    }, 5000);
} |
After five seconds, the text ‘Hello World’ will be added to the page, this will also prevent the PDF exporter from exporting until this has completed.
An example including a chart library via require:
...
Useful tips
Here are a few useful things that will aid the development of JavaScript charts:
- Use the ‘debugger’ JavaScript statement to trigger a debug point for your JavaScript when needing to debug. This invokes a pause that you can safely step through with your browser’s dev console.
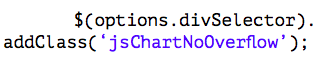
- Add the CSS class ‘jsChartNoOverflow’ Yellowfin has defined to the chart div to stop scrollbars.
E.g:
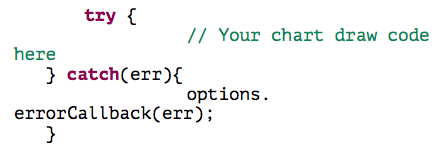
Use a try/catch block in your require statement to catch any errors and use our callback error function defined in the dataset as below so that any errors generated have the same look and feel as other chart errors. Yellowfin will also print the JavaScript error to browser console so that you can debug this.
E.g:
- If you are further processing or massaging your data and you are unsure of its current form, you can always log it into your browser’s dev console and view it. To log it, include the below in your JavaScript code:
E.g.: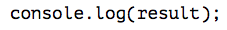
- If you are unsure what is in your current Options JSON object during the creation of JavaScript charts, you can print out the entire object into a long JSON string with:
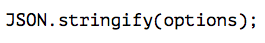
This will get logged into your browser’s dev console. You can copy the entire JSON string and view it with a JSON formatter e.g. https://jsonformatter.curiousconcept.com/
Limitations
Currently, there are a few minor JavaScript charting limitations :
JavaScript reports can be shared like any other Yellowfin content, however if broadcasting a report with JavaScript charts, note that only the report link will be shared, instead of the chart.
- When exporting reports with JavaScript charts, note that these charts will not be displayed in the exported file.