Page History
...
- From the report page, click the Annotation tool
 on the toolbar to open Annotation Settings window
 - Click on the Add Annotation button
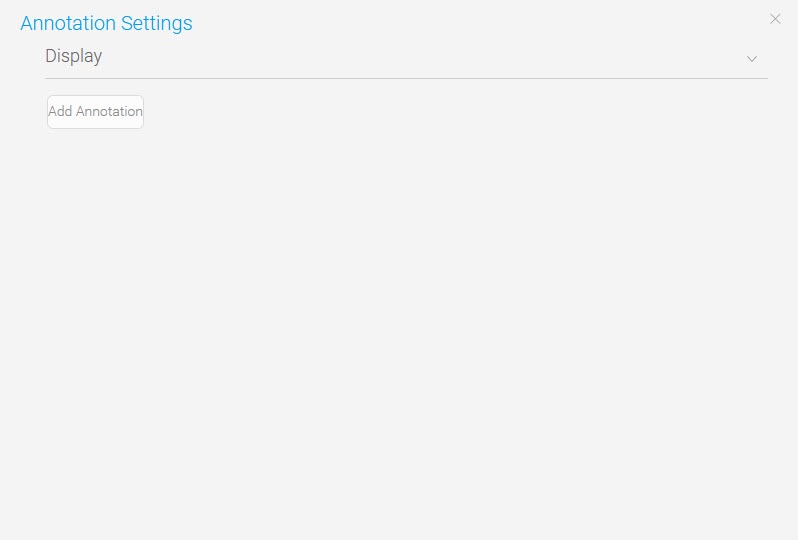
The Annotation dialog box will display, providing you with the following options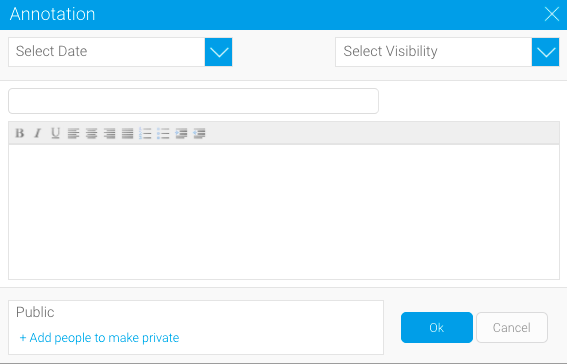
- Nominate the date, or date range for your annotation and click the Submit button
If a date range is selected, choose a highlight color for the chart annotation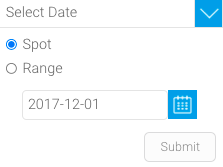
- Click the Select Visibility dropdown and click This Report
- Enter a title and description, and click the OK button
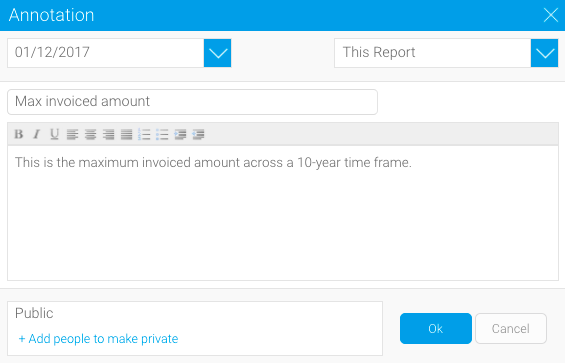
The report page will be displayed with the annotation flag visible at the selected date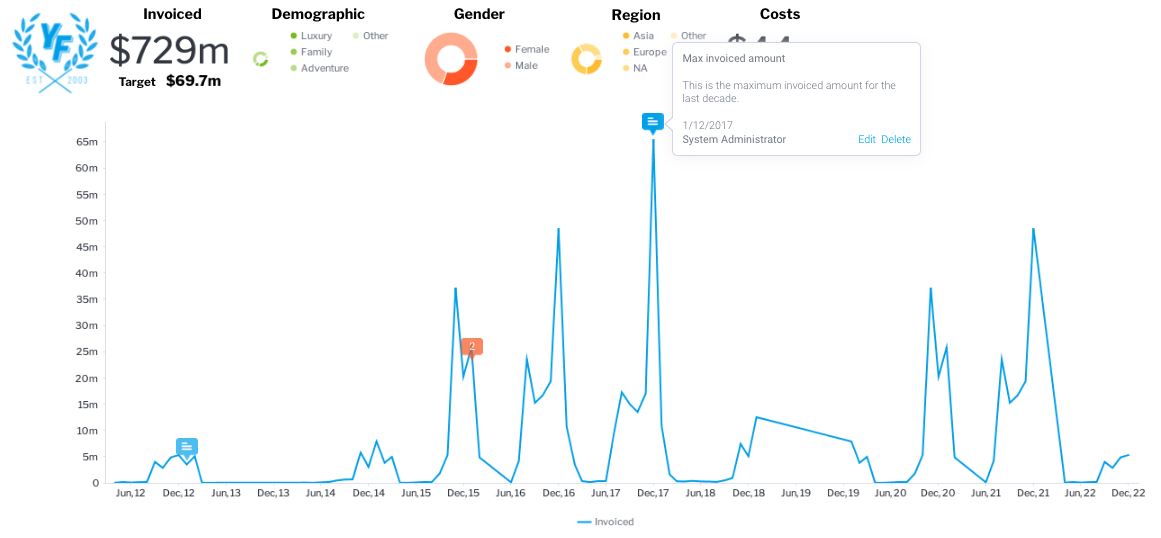
Tip When using multi-chart reports, annotations may not display immediately. Click Preview from the report page toolbar to preview the live report along with your annotations.


...