Page History
...
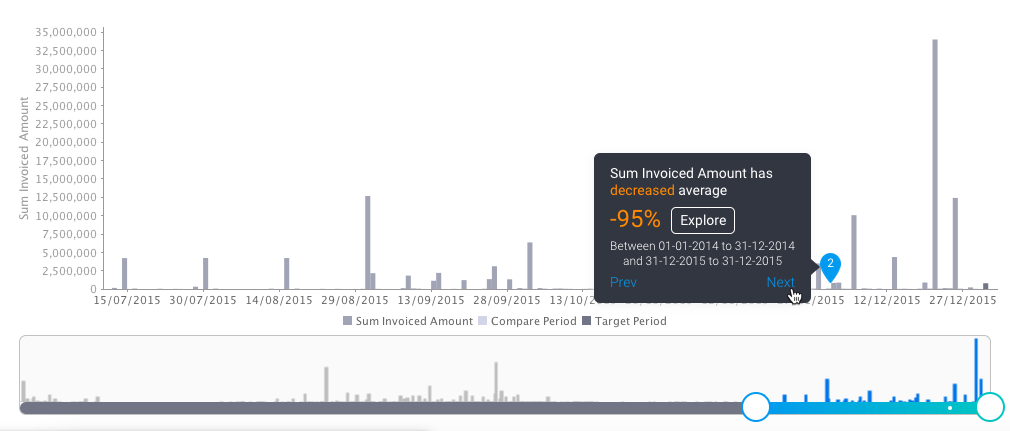
Signals time series chart
...
The Signal time-series chart shows the history of the specific metric - dimension combination. These time series charts will differ depending on the type of analysis.

Signal annotations
Main annotation
Hover over the main Signal annotation; this will bring up a tooltip that displays information on the Signal.

Other Signals annotation
Other previously generated Signals are also visible as annotations on the time series chart. These are Signals that occur in the same time window, for the same dimension granularity. You can view the detail of that signal by hovering over the signal annotation. You can click on the Explore button to open the Signal page for that Signal.
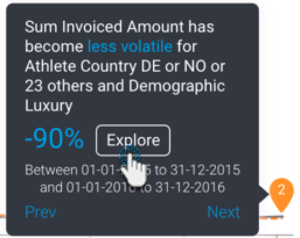
Chart analysis
The time series chart displays different types of analysis based on the nature of the Signal.
Moving Average
The moving average calculated for Signals follows a particular calculation, and therefore will be different from the moving average calculated on a report. This is because the Signal algorithms incorporate a smoothing mechanism to limit the impact of outlier values (such as Spike, Drops) on the shape of the moving average curve. So the curves are unlikely to ever look the same, especially in the presence of one or more outliers.
...
| Anchor | ||||
|---|---|---|---|---|
|
...