Page History
...
Overview
| Styleclass | ||
|---|---|---|
| ||
| Tip |
|---|
The more basic chart functions, such as Average, Trend, Forecast, and Accumulation can be applied to the advanced ones like Set Analysis or Variance. |
Using Functions
When building a chart you can add a function one of two ways:
| Location | Screenshot | Description |
|---|---|---|
| Function List |  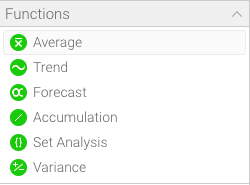 | You can drag a function from the function list on the left side of the chart builder screen. These fields will become available once required field components have been added to the chart. For example, some functions require a metric to be based on. |
| Field List | 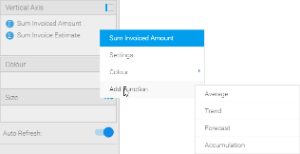 | You can add a function directly from the field you wish to base it on , by hovering:
|
Selecting a Function
Once you have added a function to your chart, you can change the specific function being applied by clicking on the drop down menu on the field (hover the mouse over the field name).
...
Average
| Styleclass | ||
|---|---|---|
| ||
Mean
This displays a line calculated as the sum of all values, divided by the number of values in a dataset.
...
Trend
| Styleclass | ||
|---|---|---|
| ||
Auto Trend
Much like with auto charts, Yellowfin applies what it deems most useful on the particular chart based on some complex algorithms.
...
Forecast
| Styleclass | ||
|---|---|---|
| ||
Auto Trend
Much like with auto charts, Yellowfin applies what it deems most useful on the particular chart based on some complex algorithms.
...
| Option | Description |
|---|---|
| Periods | This specifies the number of periods the moving average will cover. A higher number of periods will result in a smoother, but less responsive trend line. |
| Periods Forward | This specifies the number of periods into the future this function should forecast. The granularity of these periods is controlled by the overall granularity of the chart. |
| Missing Values | This specifies how missing data should be treated. |
| Prediction Intervals | These are used to indicate a range where the actual value is likely to fall. |
| Interval Range (if prediction intervals used) | This specifies the certainty range of values to be displayed.
|
| Hide Non-Forecast Results | This specifies if forecast should be dispalyed either for the whole dataset range OR only after the end of the dataset range. |
...
Accumulation
| Styleclass | ||
|---|---|---|
| ||
| Anchor | ||||
|---|---|---|---|---|
|
Set Analysis
| Styleclass | ||
|---|---|---|
| ||
In order to define a Set Analysis field you will:
- Select a report metric field to base the results on,
- Specify a range of filters that will be applied solely to this field within the chart
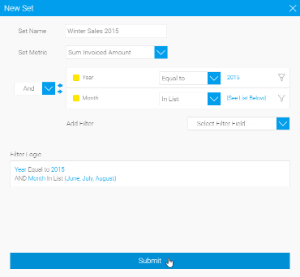
| Option | Description |
|---|---|
| Set Name | This specifies the display name of the resulting set analysis field, used in the chart labels and/or legend. |
| Set Metric | This allows you to select the field to filter down to your specified set. Only metric fields included in your report will be available in this list. |
| Filter | This allows you to specify the filters to be applied to your set field. Only category fields included in your report will be available in this list.
|
Note: Set Analysis filtering happens after the report results are returned from the database. This means that set analysis filters do not appear within the report SQL, and as such will be applied after user prompt filters.
Learn how to perform a Set Analysis function here.
| Anchor | ||||
|---|---|---|---|---|
|
Variance
| Styleclass | ||
|---|---|---|
| ||
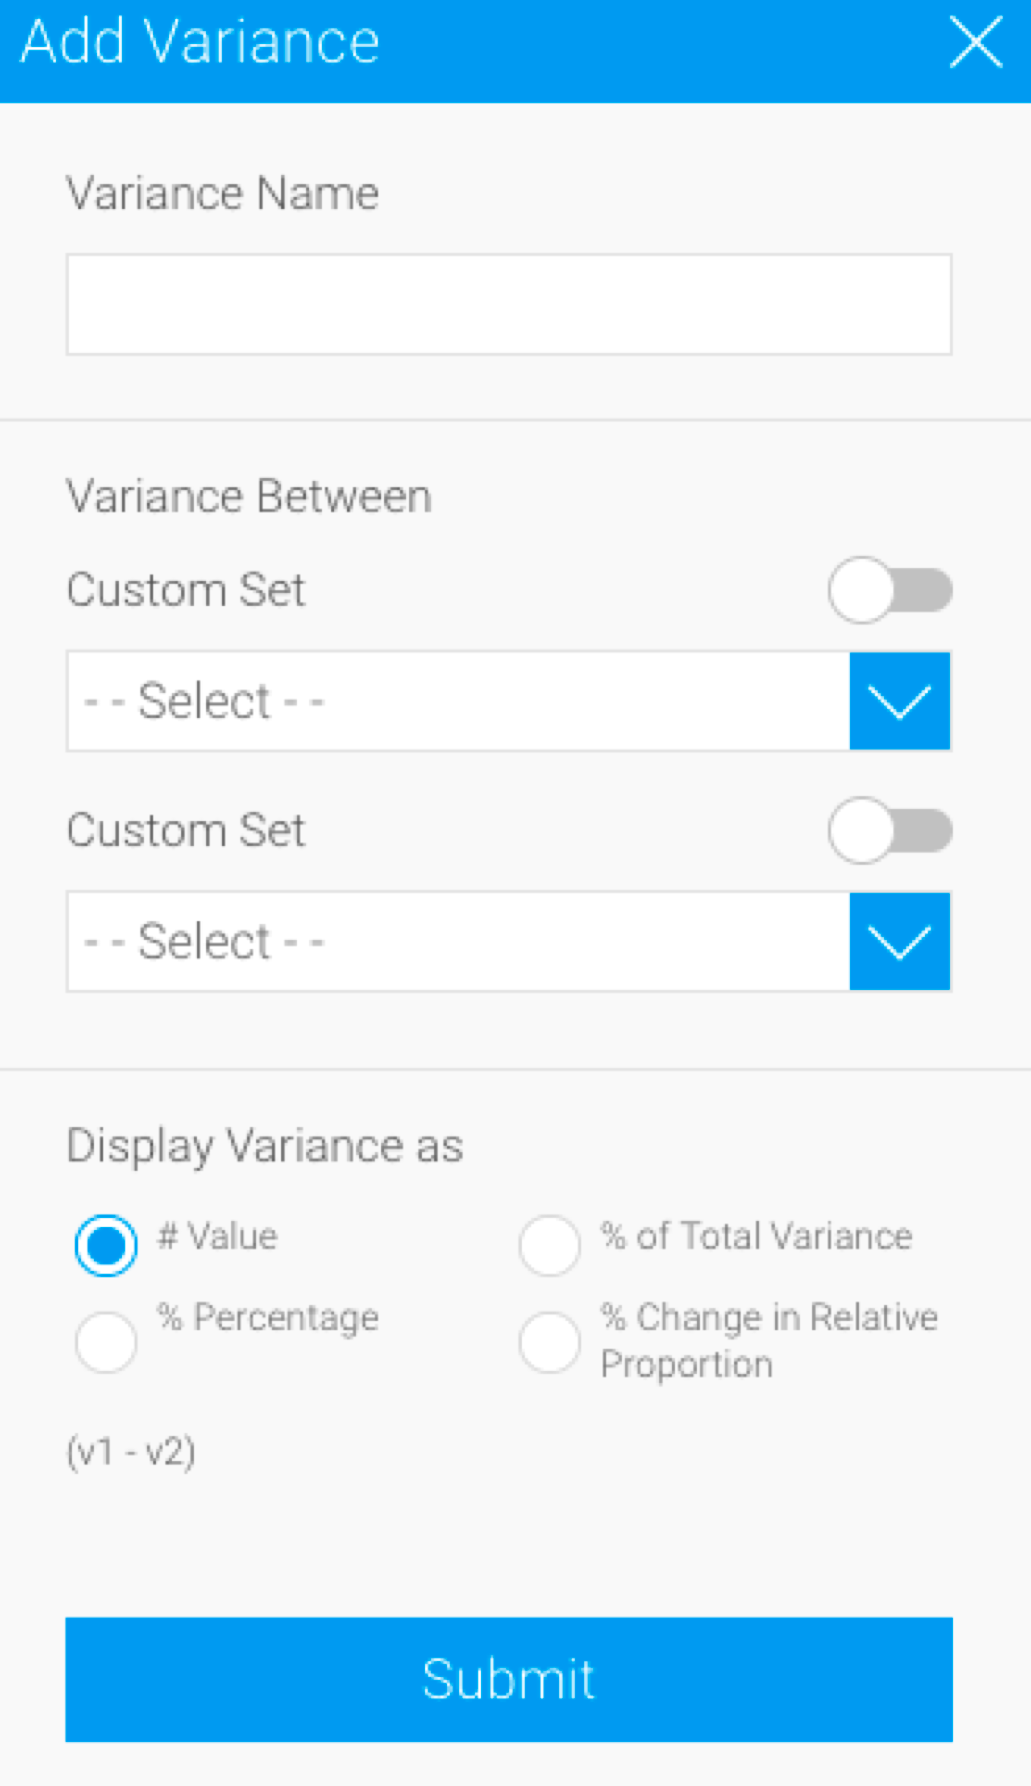
| Option | Description |
|---|---|
| Variance Name | This specifies the display name of the resulting variance field, used in the chart labels and/or legend. |
| Variance Between | This allows you to select two fields or data sets to apply the variance calculation to. The values in the second field will be subtracted from the values in the first field, as part of the calculation, so order is important. These are the types of field available to be used as part of a variance (selected through the drop-down):
Or enable the Custom Set toggle to perform set analysis through the Create button. |
| Display Variance as | This allows you to select how the resulting variance values are displayed. There are four options:
|
Learn how to use a Variance function here.
| horizontalrule |
|---|
| Styleclass | ||
|---|---|---|
| ||