Page History
...
| Table of Contents | ||
|---|---|---|
|
Overview
| Styleclass | ||
|---|---|---|
| ||
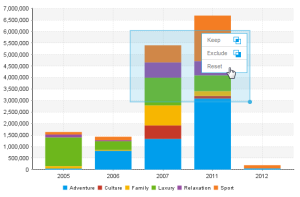
Brushing allows users to restrict results in their chart by choosing to Include or Exclude certain areas. This is a far more interactive method of filtering, as the user defines what they want to see or remove by highlighting the particular area on their chart. unmigrated-inline-wiki-markup
{html}<iframe width="700" height="394" src="https://www.youtube.com/embed/XW1i61lxiME?color=white" frameborder="0" allowfullscreen></iframe>{html}
Include
| Styleclass | ||
|---|---|---|
| ||
Once the chart has been created, you are able to restrict results to the ones you select by:
...
- Click and drag to highlight an area on the chart
- Select the Keep option
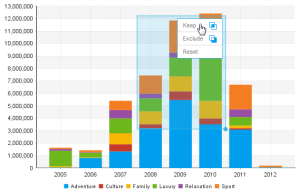
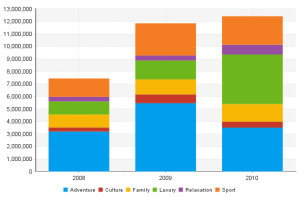
- You will now notice that the chart has been restricted to only the values you selected in the highlighted range
...
Exclude
| Styleclass | ||
|---|---|---|
| ||
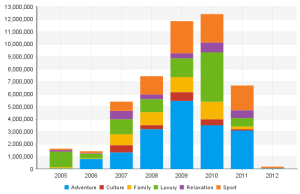
Once the chart has been created, you are able to remove results that you select from the chart by:
...
- Click and drag to highlight an area on the chart
- Select the Exclude option
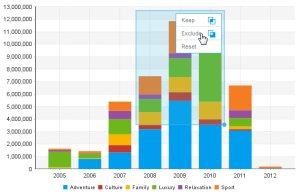
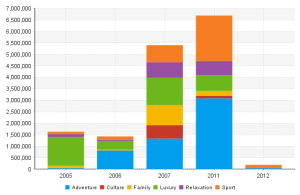
- You will now notice that the chart has removed the values you selected in the highlighted range
...
Reset
| Styleclass | ||
|---|---|---|
| ||
Once the chart has been brushed, you are able to reset results by:
...
- Click and drag to highlight an area on the chart
- Select the Reset option
- You will now notice that the chart has been returned to its original state
...
Incompatible Charts
| Styleclass | ||
|---|---|---|
| ||
Brushing is not available on all chart types. The following are incompatible:
...
Note: chart brushing is not available when Drill Anywhere or Drill Through is enabled.
| horizontalrule |
|---|
| Styleclass | ||
|---|---|---|
| ||
...
Limitations
Chart brushing will not be available in the following cases:
- The user has the Active Charts content setting option turned off.
- The chart is being repositioned on the design page.
- There is a time slider on the time series charts.
- There are analytic chart fields (Trend, Average, Accumulation, and Forecast) added to the chart.
- The chart is part of a multi-chart report.
- The chart is embedded in a separate location using the JS API.
- The chart is being edited in the Chart Builder.
| Styleclass | ||
|---|---|---|
| ||
...