Like what you see? Have a play with our trial version.

Versions Compared

Key

  • This line was added.
  • This line was removed.
  • Formatting was changed.
Comment: Migration of unmigrated content due to installation of a new plugin

Anchor
top
top

Table of Contents
classcontents

Getting Started

Styleclass
ClasstopLink

top

The GIS Heat Map is an advanced form of GIS Bubble Chart, which uses GIS Points to specify bubble positions, and a metric to specify the heat colour of the area.

GIS Map Tutorial

Styleclass
ClasstopLink

top

Section
Column
width30%

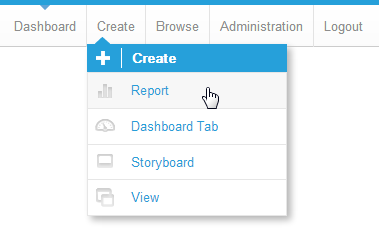
1. Click on the Create link and select Report to begin building your report.

Column
width70%

...

Section
Column
width30%

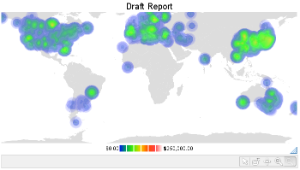
13. You should now have a map that looks like this.

14. Save and Close your map.

Column
width70%


horizontalrule
Styleclass
ClasstopLink

top