Page History
| Anchor | ||||
|---|---|---|---|---|
|
| Table of Contents | ||
|---|---|---|
|
Overview
| Styleclass | ||
|---|---|---|
| ||
| HTML |
|---|
<iframe width="700" height="394" src="https://www.youtube.com/embed/XW1i61lxiME?color=white" frameborder="0" allowfullscreen></iframe> |
Include
| Styleclass | ||
|---|---|---|
| ||
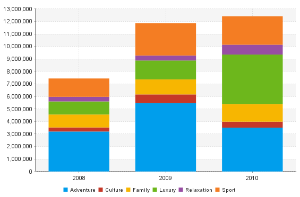
- Click and drag to highlight an area on the chart
- Select the Keep option
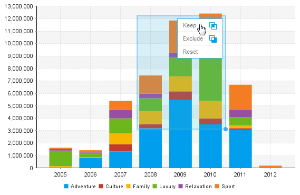
- You will now notice that the chart has been restricted to only the values you selected in the highlighted range
Exclude
| Styleclass | ||
|---|---|---|
| ||
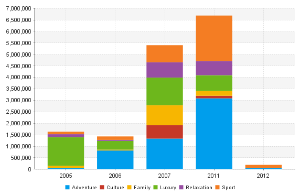
- Click and drag to highlight an area on the chart
- Select the Exclude option
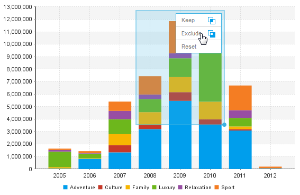
- You will now notice that the chart has removed the values you selected in the highlighted range
Reset
| Styleclass | ||
|---|---|---|
| ||
- Click and drag to highlight an area on the chart
- Select the Reset option

- You will now notice that the chart has been returned to its original state
Incompatible Charts
| Styleclass | ||
|---|---|---|
| ||
- Histogram
- Z Chart
- Maps
- Meters
- Waterfall
- Event
- Week Density
- Trellis (not compatible with exclude brushing)
- Auto Charts (not compatible with exclude brushing)
Note: chart brushing is not available when Drill Anywhere or Drill Through is enabled.
| horizontalrule |
|---|
| Styleclass | ||
|---|---|---|
| ||
Limitations
Chart brushing will not be available in the following cases:
- The user has the Active Charts content setting option turned off.
- The chart is being repositioned on the design page.
- There is a time slider on the time series charts.
- There are analytic chart fields (Trend, Average, Accumulation, and Forecast) added to the chart.
- The chart is part of a multi-chart report.
- The chart is embedded in a separate location using the JS API.
- The chart is being edited in the Chart Builder.
| Styleclass | ||
|---|---|---|
| ||