Page History
| Anchor | ||||
|---|---|---|---|---|
|
| Table of Contents | ||
|---|---|---|
|
...
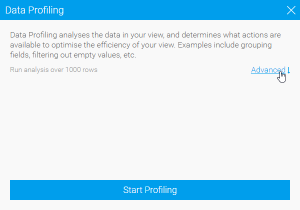
Data Profiling analyzes the data in your View, and determines what actions are available to optimize the efficiency of your View.
| Note |
|---|
Ensure that you have the Data Profiling configuration setting enabled to use this functionality. Navigate to Administration > Admin Console > Data Source > Connection > Usage Parameters > Data Profiling. |
Run Analysis
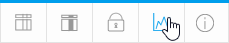
1. Click on the Data Profiling button
2. If you want to profile all the fields in the view, click Start Profiling, otherwise click the Advanced link.
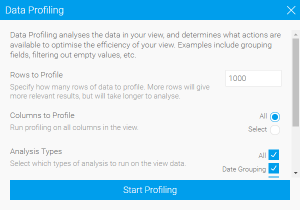
3. Configure the advanced options and click Start Profiling to begin.
...
| Options | Description |
|---|---|
| Rows to Profile | Specify how many rows of data to profile. More rows will give more relevant results, but will take longer to analyse. |
| Columns to Profile | Specify if you wish to run data profiling on all the fields in the view, or just select a single field from the list. |
| Analysis Types | Select which data analysis you wish to run on the selected field(s) for suggestions to be tested and included. |
...
- Date Grouping -
- GeoPack -
- Null Values -
- Numeric Grouping -
- Reference Codes -
Selecting none will still run the standard data profiling. |
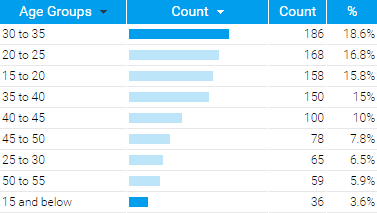
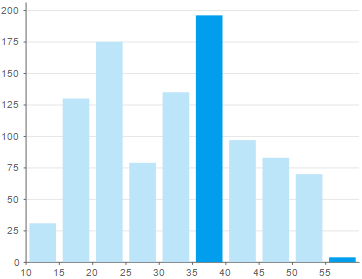
Histogram
| Styleclass | ||
|---|---|---|
| ||

Chart
Histogram
...
| Styleclass | ||
|---|---|---|
| ||
Chart
| Grouped Values or Text | Numeric, Date, or Time Values |
|---|---|
 |  |
...
...
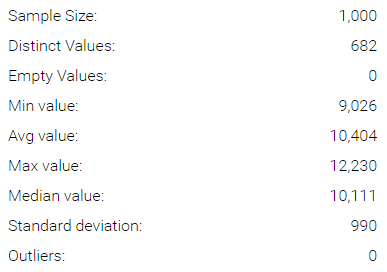
| Displays a count of the records within the field. |
| Distinct Values |
...
| Displays a count of the distinct values within the field. |
| Empty/NULL Values |
...
| Displays a count of the number of empty values within the field. | |
| Numeric Fields | |
|---|---|
| Median | |
...
| Displays the number separating the higher half of the sample from the lower half. |
| Average |
...
| Displays the mean value. |
| Standard Deviation |
...
| Displays the measure of the dispersion of a set of values. |
| Minimum |
...
| Displays the lowest value. |
| Maximum |
...
| Displays the highest value. | |
| Date/Time Fields | |
|---|---|
| Minimum | |
...
| Displays the earliest date. | |
| Maximum | Displays the latest date. |
...
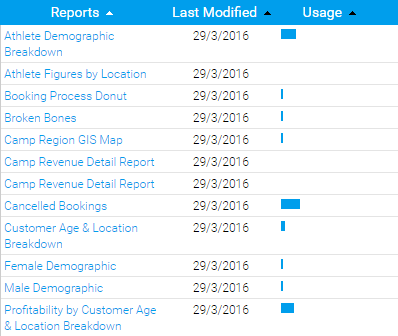
Usage
Suggestions
Usage
| Styleclass | ||
|---|---|---|
| ||
| Section | Description |
|---|---|
| Reports | Displays a list of reports that make use of the selected field. |
| Last Modified | Displays the last modified date of each listed report. |
| Usage | Displays the usage rate of each listed report. |
Suggestions
| Styleclass | ||
|---|---|---|
| ||
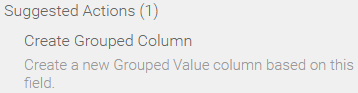
| Suggestion | Description |
|---|---|
| Reference Code Check |
...
| The values in the field will be analysed and compared to existing ref codes. It may then be suggested that a ref code be applied, updated, or created. |
| Null Check |
...
| The values in the field will be analysed and it may be suggested that null values be replaced or filtered out. |
| Number Uniqueness |
...
| The values in the field will be analysed and it may be suggested that the fields be grouped. |
| Date Uniqueness |
...
| The values in the field will be analysed and it may be suggested that the field be used as part of a date hierarchy. |
| Geography Check |
...
| The values in the field will be analysed and it may be suggested that the field be linked to a GeoPack. |
| Date Hierarchy |
...
| The values in the field will be analysed and it may be suggested that the field be linked in a drill down date hierarchy. |
| horizontalrule |
|---|
| Styleclass | ||
|---|---|---|
| ||