Page History
...
Display the accumulation % or the running total value of a total line on a chart, using a secondary axis.
Accumulation Function Types
| Accumulation Function Type | Description |
|---|---|
| Accumulation % | Shows the accumulation % of the total line on the chart |
| Running total | Show the running total (that is the total value) of the total line on the chart. |
...
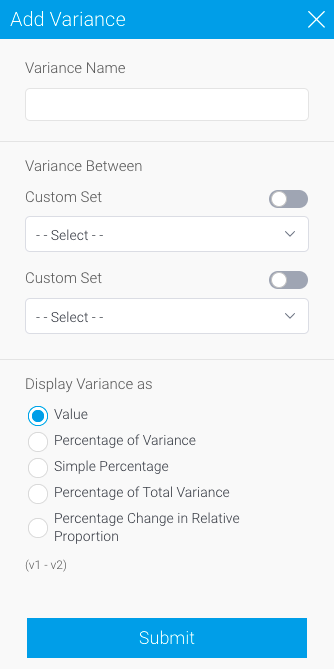
This displays the difference between two fields from either the table or chart. The variance can be displayed as either the calculated value, or a % difference.

| Option | Description |
|---|---|
| Variance Name | This specifies the display name of the resulting variance field, used in the chart labels and/or legend. |
| Variance Between | This allows you to select two fields or data sets to apply the variance calculation to. The values in the second field will be subtracted from the values in the first field, as part of the calculation, so order is important. These are the types of field available to be used as part of a variance (selected through the drop-down):
Or enable the Custom Set toggle to perform set analysis through the Create button. |
| Display Variance as | This allows you to select how the resulting variance values are displayed. There are four options:
|


...