Page History
...
Icon | Component | Description | ||||||||
|---|---|---|---|---|---|---|---|---|---|---|
| Horizontal Axis | The field used to define the horizontal axis of the chart. Depending on the chart type selected, this may be either a dimension or metric field. | ||||||||
| Vertical Axis | The field used to define the vertical axis of the chart. Depending on the chart type selected, this may be either a dimension or metric field | ||||||||
| Colour | The field used to define the colours used in the chart. Depending on the chart type selected, this may be either a dimension or metric field. | ||||||||
| Size | The field used to determine the size of bubbles in the chart. This will be a metric or aggregated dimension field. | ||||||||
| Animation | A Date or Time field that can be used as frames to animate the chart. Each value of the animation field will generate a unique frame in the animation.
|
Specialty Components
| Styleclass | ||
|---|---|---|
| ||
...
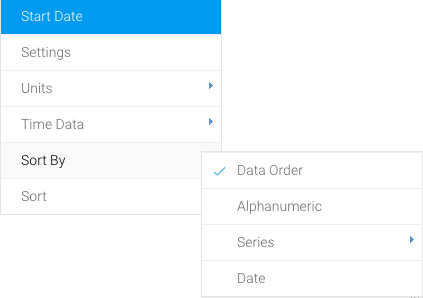
Charts, by default, are sorted based on the sorting applied to the report table. From there, they can be customised to use different sorting methods and orders.

| Option | Description |
|---|---|
| Data Order | This means that the chart will be sorted by the order the values in the chart appear in the report table. |
| Alphanumeric | This means that the chart will be sorted by the alphanumeric values of the selected field. |
| Series | This means that the chart will be sorted by the values in a specified chart series. |
| Date | You can display the data according to a progressive date range, that is uniformly (rather than discretely) spaced along the axis, in an ascending or descending order. |
| Group Order | This means that the chart will be sorted according to the order of the grouped data. Click here to learn how to do this. |
Note: you can only sort a chart by one field at a time.
...