Page History
...
| Table of Contents | ||
|---|---|---|
|
Overview
| Styleclass | ||
|---|---|---|
| ||
With Yellowfin you can add specific comments to your reports in the form of annotations. There are three types of annotations to assist users of a report:
...
Annotations assist your reports readers to understand the reports and data that they are viewing. They can only be added when a report is ACTIVE and the annotate drop down menu is visible.

The figure above shows the three places annotations are displayed.
Annotations are displayed in multiple places on a report, as seen in the example below:
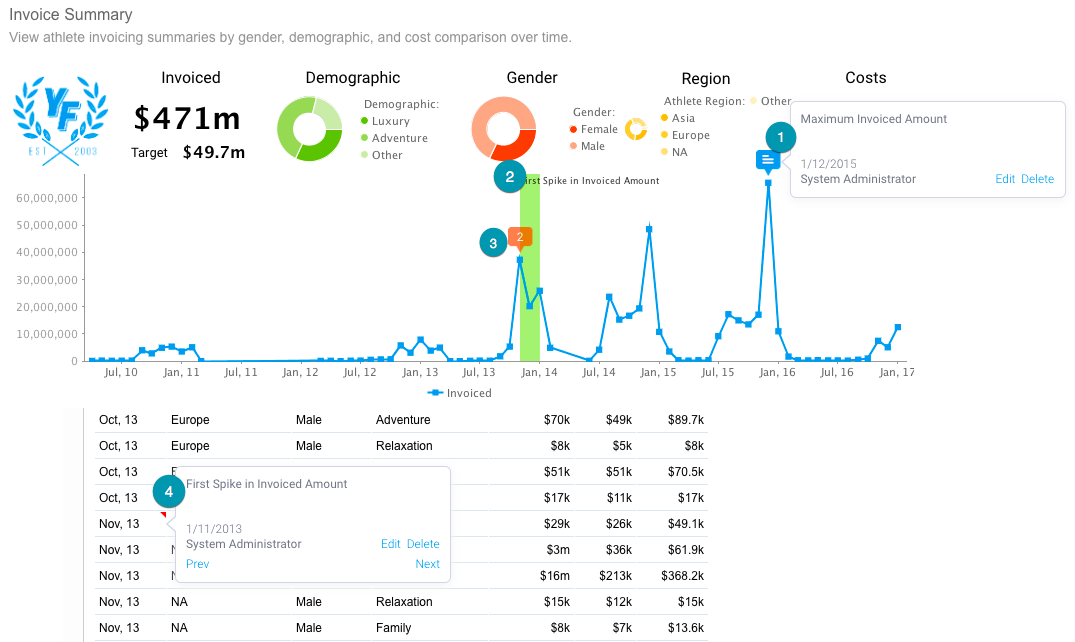
- A single annotation flag and its roll over Annotation Flag highlighting the date, or start of date range, on the time series x axis, with a descriptive roll over that is editable from the report pagedescription.
Note: if the Annotation is set to Private the flag will be coloured colored red. - Highlighting on a time series chart when the annotation has been applied to a date range rather than a single date.
- A multiple annotation that displays the number of annotations (for example, 2) at the exact spot.
- A descriptive roll over on the table displayed on the date, or start of the date range, that is editable from the report page.
Enabling Annotations
| Styleclass | ||
|---|---|---|
| ||
There are two things you must do in order to use annotations in Yellowfin;
...
- You must get an administrator to enable annotation permissions for our role. There are *C*reate, *R*ead, *U*pdate, and *D*elete options available.
- The administrator should go to Administration > Role Management and edit your role.
- They will need to ensure the Annotations role is enabled.

- The report you wish to view annotations on must be correctly enabled.
- While the report is in draft mode, open the Display menu.
- Ensure that Display on Charts and/or Display on Tables is set to Yes.
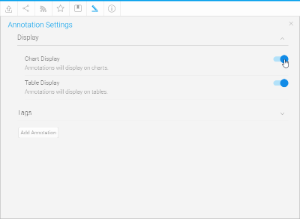
- Activate the report.

Creating Annotations
| Styleclass | ||
|---|---|---|
| ||
In order to create annotations you will need to complete the following:
...
- Ensure your report is Active (not in Draft mode)
- In the Annotate menu, click on the Add Annotation button
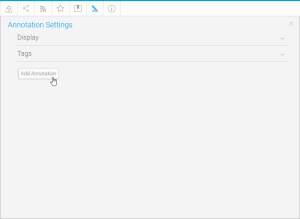
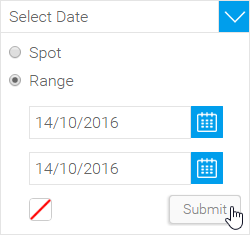
- The Annotation window will open, providing you with the following options:


Date
Nominate the date, or date range that your annotation should be displayed for. If a date range is selected, you will also be able to choose a colour for chart highlighting.
...
Note: If the Annotation is linked to a filter, the Global (Organisation) level will not be available, as the filter is linked to a view field and as such cannot be applied to reports based on other views.
Tag
Specify a tag to categorise your Annotation. This can be left blank, but it’s suggested that tags are used where possible in order to make it easier for the users to view content relevant to them.A new tag can be added by typing the description of the tag in the text box at the bottom of the list and clicking Add.

Title & Description
...
Note: Annotations will always be secured by Client Org (if implemented), so even if set to Public, only users and groups within the Org it was created in will have access. If your Annotation is Private the flag on a chart will be red, rather than grey.
Viewing Annotations
| Styleclass | ||
|---|---|---|
| ||
By default, a report will display an Annotation if the following criteria are met:
...
- The Report and/or Time Series Chart contains the matching date or range specified in the Annotation
- Annotations display is enabled during report creation
- The Filters used in the Report match those used in the Annotation (if specified)
Global Annotations
| Styleclass | ||
|---|---|---|
| ||
When using the Client Organisations feature in Yellowfin, Administrators of the Primary Org will have the option enable Global Annotations. Enabling this feature means that all Annotations created at the Primary Org (Default Level) will be passed through and visible in all Client Orgs.
...
Note: when Global Annotations are enabled, the Annotations at the Primary Org will be set to Public.
| horizontalrule |
|---|
| Styleclass | ||
|---|---|---|
| ||