Page History
...
In the example below the report on the top is displayed as a column table. The user then has to interpret the data by reading down the columns. If the report is specifically aimed at assisting the user to understand more about the company relationship, then sectioning the data can make the same data easier to interpret. The example below shows how the report is now easier to read.
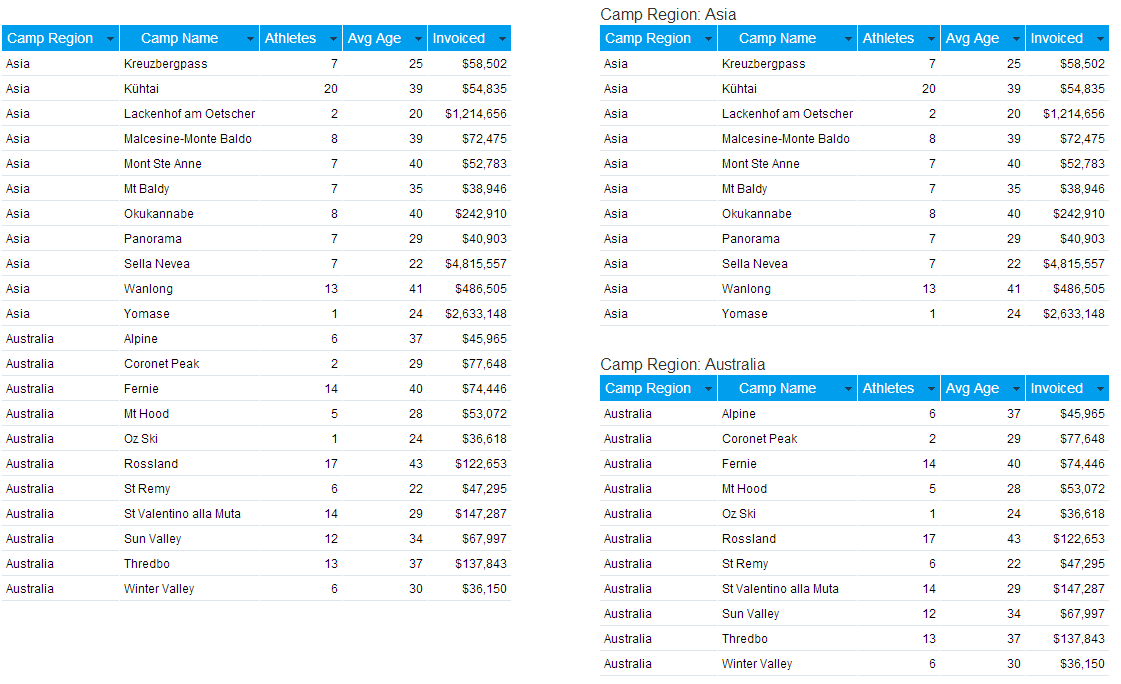
Breaking a report into sections is a way of spitting large tables of data into smaller, more comprehensible parts. Each section contains at least one table, and at least one section cell, as illustrated above.
...
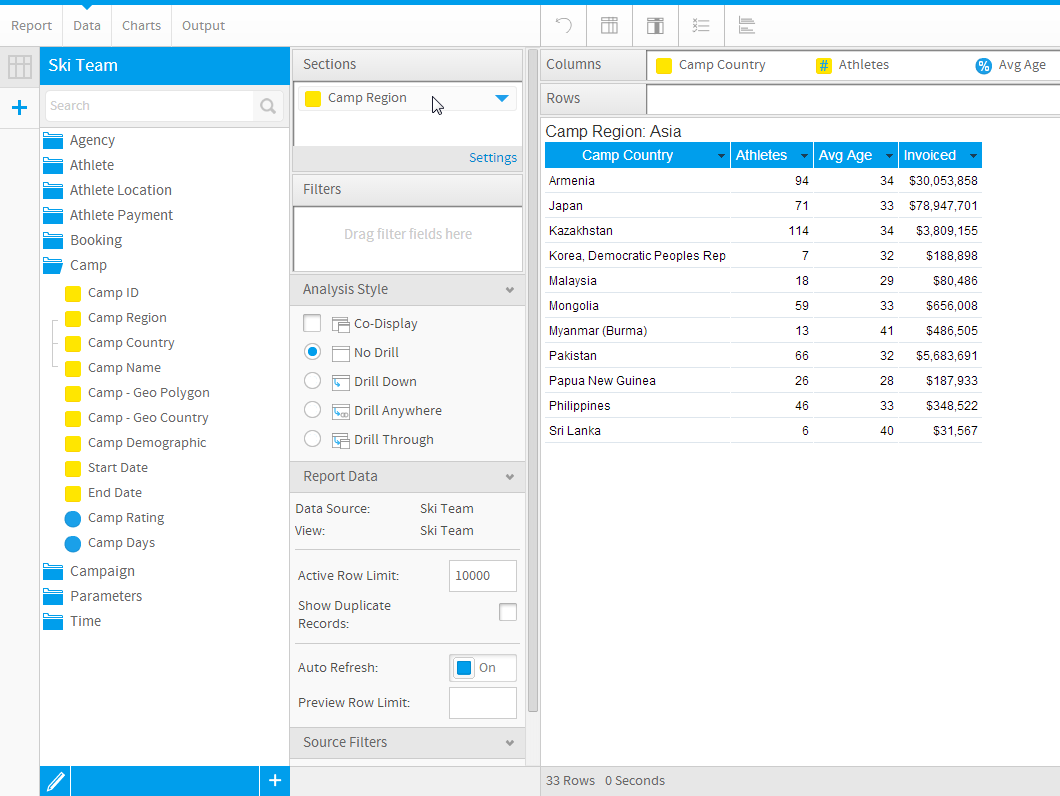
To create a section, just drag an item from your report data field list or move an item from an existing column in the report.
In the example below the Athlete Region is dragged from the column fields to the report sections box. This will split the tables on the report into one section for each Athlete Region.
Note: You can only add dimension data into the report sections. The use of metric data is not supported for sections. If you do attempt to add a metric to the section edit box the following error will be displayed:
...