Page History
| Anchor | ||||
|---|---|---|---|---|
|
| Table of Contents | ||
|---|---|---|
|
Overview
| Styleclass | ||
|---|---|---|
| ||
Setup
| Styleclass | ||
|---|---|---|
| ||
See Drill Down and Drill Through for more information.
Note: Ensure that the report drill through parameters and fields are the same that are used in your chart.
Chart Drill Through Settings
When creating your chart(s) there are a range of options you can apply to enable drill functionality that you have applied to your report.
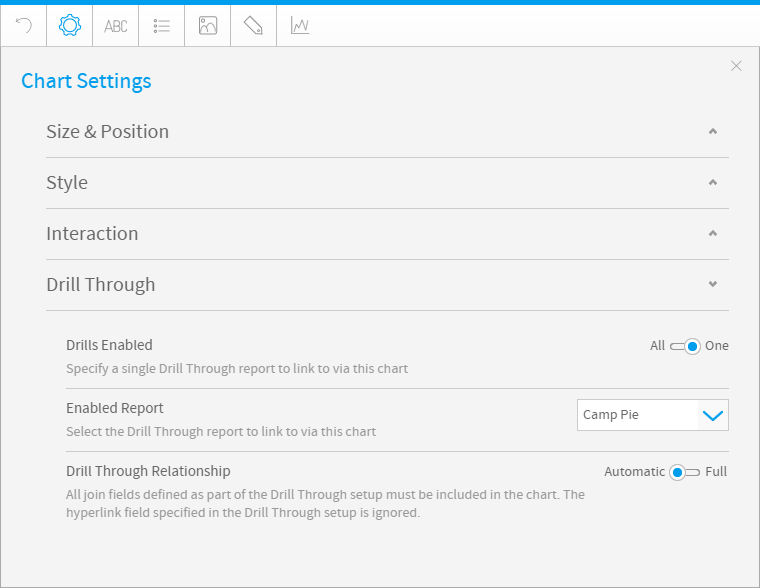
| Setting | Option | Description |
|---|---|---|
| Drill Enabled | All | All of the compatible drill through relationships, defined on the Related Reports step of the builder, will be used on this chart. |
| On | Only one of the drill through relationships, defined on the Related Reports step of the builder, will be used on this chart. | |
| Enabled Report | (Report List) | Here you can define which Drill Through report relation is used on the chart. All others will be ignored for this chart. Note: This option is only available when Drills Enabled is set to One. |
| Drill Through Relationship | Automatic | The drill through relationships to be used on this chart will automatically be set up. For this to happen all the join fields defined in each relationship must be a chart component in order for the relationship to link correctly. The defined hyperlink field in the relationship is ignored as the link is automatically applied. |
| Full | The drill through relationships to be used in this report will be set up with whatever link fields are used in the chart, all other defined link fields will be omitted as part of the drill. The hyperlink field will be used as defined in the Related Reports step. |
Supported Charts
| Styleclass | ||
|---|---|---|
| ||
Note: All charts can use Link To drilling.
| Chart Type | Chart | Drill Down | Drill Anywhere | Drill ThroughAnalytical | ||||||||
|---|---|---|---|---|---|---|---|---|---|---|---|---|
| Auto Chart | Select Scenarios |  | Scatter | styleclass | ||||||||
| Analytical | tickScatter |  | | Styleclass | | tick | | Anchor | | star | *||||
| Histogram | styleclass | |||||||||||
| | Styleclass | | tick | | ||||||||
| Box & Whisker | | Styleclass | | tick | | | Styleclass | | ||||||
| ||||||||||||
| Trellis (Select Scenarios) | styleclass | Class | tick | |||||||||
|
| | ||||||||||
| Heat Grid | | Styleclass | | tick | |
| | ||||||
| Area |
|
| Area | styleclass | Class | tick| Styleclass | | |||||
| ||||||||||||
| Area (Time Series) | | | | |||||||||
| Stacked Area | styleclass | |||||||||||
| | | Styleclass | | |||||||||
| ||||||||||||
| Bar |
|
| Horizontal Bar | styleclass | Class | tick | | Styleclass | | ||||
| ||||||||||||
| Horizontal Bar (Time Series) | | | | |||||||||
| 3D Horizontal Bar | styleclass | |||||||||||
| | Styleclass | | tick | | ||||||||
| Stacked Horizontal Bar | styleclass | Class | tick | | Styleclass | | |||||||
| ||||||||||||
| Stacked Horizontal Bar (Time Series) | | | | |||||||||
| Horizontal Cylinder | styleclass | |||||||||||
| | | Styleclass | | |||||||||
| ||||||||||||
| Proportional Bar | styleclass | |||||||||||
| ||||||||||||
|
| |||||||||||
Column |
|
| ||||||||||
Vertical Bar |
|
| ||||||||||
3D Vertical Bar |
|
| ||||||||||
Stacked Vertical Bar |
|
| ||||||||||
Cylinder |
|
| ||||||||||
3D Stacked Vertical Bar |
|
| ||||||||||
Layered Bar |
|
| ||||||||||
Combination |
|
| ||||||||||
Combined Category |
|
| ||||||||||
Overlay |
|
| ||||||||||
Financial |
|
| ||||||||||
Financial Line |
|
| ||||||||||
High Low |
|
| ||||||||||
Candlestick |
|
| ||||||||||
Line |
|
| ||||||||||
Line |
|
| ||||||||||
3D Line |
|
| ||||||||||
Z |
|
| ||||||||||
Stepped Line |
|
| ||||||||||
Map |
|
| ||||||||||
Raster Map |
|
| ||||||||||
Google Map |
|
| ||||||||||
GIS Map |
|
| ||||||||||
GIS Bubble |
|
| ||||||||||
GIS Heat |
|
| ||||||||||
Meter |
|
| ||||||||||
Meter |
|
| ||||||||||
Thermometer |
|
| ||||||||||
Dial |
|
| ||||||||||
Numeric Display |
|
| ||||||||||
Pie |
|
| ||||||||||
Pie |
|
| ||||||||||
3D Pie |
|
| ||||||||||
Multi Pie |
|
| ||||||||||
Ring |
|
| ||||||||||
Special Purpose |
|
| ||||||||||
Funnel |
|
| ||||||||||
Proportional Infographic |
|
| ||||||||||
Comparative Infographic |
|
| ||||||||||
Radar |
|
| ||||||||||
Waterfall |
|
| ||||||||||
Event |
|
| ||||||||||
Week Density |
|
|
...
| | |||
| Column | Vertical Column | | | |
| Vertical Column (Time Series) | | | | |
| 3D Vertical Column | | | | |
| Stacked Vertical Column | | | | |
| Stacked Vertical Column (Time Series) | | | | |
| Cylinder | | | | |
| 3D Stacked Column | | | | |
| Layered Column | | | | |
| Combination Charts | Combined Category | | | |
| Combined Category (Time Series) | | | | |
| Overlay Chart | | | | |
| Overlay Chart (Time Series) | | | | |
| Financial | Financial Line | | | |
| High Low | | | | |
| Candlestick | | | | |
| Line | Line | | | |
| Line (Time Series) | | | | |
| 3D Line | | | | |
| Z Chart | | | | |
| Stepped | | | | |
| Map | Raster Map | | | |
| Google Map | | | | |
| GIS Google Map | | | | |
| GIS Map | | | | |
| GIS Bubble Map | | | | |
| GIS Heat Map | | | | |
| Pie | Pie | | | |
| 3D Pie | | | | |
| Multi Pie | | | | |
| Ring | | | | |
| Special Purpose | Funnel | | | |
| Proportional Infographic | | | | |
| Comparative Infographic | | | | |
| Radar | | | | |
| Waterfall | | | | |
| Event | | | | |
| Week Density | | | | |
| Digital Numeric Display | | | | |
| Numeric Display | | | |
| horizontalrule |
|---|
| Styleclass | ||
|---|---|---|
| ||
Setting up Drill Down & Drill Through
| Styleclass | ||
|---|---|---|
| ||
Chart drill functionality inherits the drill parameters of the report. Use the standard drill functions to setup the drill parameters for a report.
See Drill Down and Drill Through for more information.
Note: Ensure that the report drill through parameters and fields are the same that are used in your chart.
| horizontalrule |
|---|
...
| Class | topLink |
|---|
...