Page History
...
| Styleclass | ||
|---|---|---|
| ||
| Tip |
|---|
The more basic chart functions, such as Average, Trend, Forecast, and Accumulation can be applied to the advanced ones like Set Analysis or Variance. |
Using Functions
When building a chart you can add a function one of two ways:
| Location | Screenshot | Description |
|---|---|---|
| Function List |  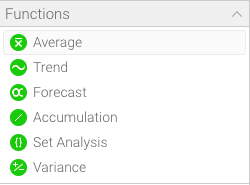 | You can drag a function from the function list on the left side of the chart builder screen. These fields will become available once required field components have been added to the chart. For example, some functions require a metric to be based on. |
| Field List | 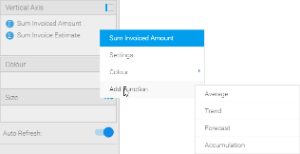 | You can add a function directly from the field you wish to base it on:
|
...