Page History
...
| Table of Contents | ||
|---|---|---|
|
Overview
| Styleclass | ||
|---|---|---|
| ||
This The Content Settings page allows administrators to configure a wide range of defaults and formatting settings for content. Navigate to Menu > Administration > Content Settings to change the settings that fall under the following tabs:

- Report Settingssettings
- Chart Settingssettings
- Dashboard Settingssettings
- Storyboard Settingssettings
- Browse Settings
...
| Styleclass | ||
|---|---|---|
| ||
| Anchor | ||||
|---|---|---|---|---|
|


| Expand | ||||
|---|---|---|---|---|
| ||||
|
| Expand | |||||||||||||||||||||||||||||||||||||||||||||||||||||||||||||||||||||||||||||||||||||||||||||||||||||||||||||
|---|---|---|---|---|---|---|---|---|---|---|---|---|---|---|---|---|---|---|---|---|---|---|---|---|---|---|---|---|---|---|---|---|---|---|---|---|---|---|---|---|---|---|---|---|---|---|---|---|---|---|---|---|---|---|---|---|---|---|---|---|---|---|---|---|---|---|---|---|---|---|---|---|---|---|---|---|---|---|---|---|---|---|---|---|---|---|---|---|---|---|---|---|---|---|---|---|---|---|---|---|---|---|---|---|---|---|---|---|---|
| |||||||||||||||||||||||||||||||||||||||||||||||||||||||||||||||||||||||||||||||||||||||||||||||||||||||||||||
| |||||||||||||||||||||||||||||||||||||||||||||||||||||||||||||||||||||||||||||||||||||||||||||||||||||||||||||
| Expand | |||||||||||||||||||||||||||||||||||||||||||||||||||||||||||||||||||||||||||||||||||||||||||||||||||||||||||||
| |||||||||||||||||||||||||||||||||||||||||||||||||||||||||||||||||||||||||||||||||||||||||||||||||||||||||||||
Option | Description |
|---|---|
Filter Location | Select the default location for User Prompt filters to be displayed on the Report page. |
Filter Width | Select the default length for User Prompt filter values display. |
Drill Through Popup | Allow Drill Through reports to display in a lightbox if configured to use the 'Popup New Window' option. |
| title | Private Reports |
|---|
Option
Description
Allow Share
This will allow Private Report Writers to assign other users access to their report.
Watermark
Select an image to use as a watermark on Private Reports. (Optional)
Report Marker
Enter text to be used as a marker below the description for all Private Reports. (Optional)
| title | Public Reports |
|---|
Option | Description |
|---|---|
Watermark | Select an image to use as a watermark on Public Reports. |
Report Marker | Enter text to be used as a marker below the description for all Public Reports. |
| title | Builder Settings |
|---|
Option
Description
Chart Settings
| Styleclass | ||
|---|---|---|
| ||

...
| title | Image Settings |
|---|
...
Option
...
Description
...
Chart Image Format
...
Specify the image format for charts to be generated as.
...
Draggable Thumbnails
...
Allow you to open a chart in a new window and drag the image into an open program or save it for later use.
...
| title | Animated Loading |
|---|
Option | Description |
|---|---|
Animated Chart Loading | Animate the chart as it loads. |
Display Animation | Animate the chart multiple times per session - each time the chart is reloaded, filtered, or changed. |
Per Session | Define the number of times charts animate within a session, this is animations across the system, not per chart. |
...
| title | Active Charts |
|---|
...
Option
...
Description
...
Active Chart Highlighting
...
Allow users to hover over an area on a chart with the mouse to highlight it.
...
Active Outline
...
Define the colour to outline the current active area.
...
Active Fill
...
Define the colour to fill the current active area.
...
Tooltip Outline
...
Define the colour to be used to outline chart tooltips.
...
Tooltip Background
...
Define the background colour to be used for chart tooltips. Define two different colours to use a gradient.
...
Tooltip Title
...
Define the colour of the Title text in chart tooltips.
...
Tooltip Text
...
Define the font and colour of the descriptive text in chart tooltips.
...
| title | Colour Defaults |
|---|
Option | Description |
|---|---|
Default Style | Use only one colour per category or series by default. |
Colours | Define grids of colour to be applied to charts by default. The first grid is for solid colours, the second is used to perform gradient shading when enabled. |
Map Colours | Define the default colours to be used for maps. The first part of the range is allocated to negative numbers, the middle to zero, the second part to positive values. |
Chart Background | Define the default chart background colour. Leave blank to set as transparent. |
Plot Background | Define the default plot background colour. Leave blank to set as transparent. |
Annotation Range Default | Define the default colour to be used for Annotation Range highlighting on charts. |
Bubble Shading Style | The bubbles will consist of two colours shaded together to give a rounded effect. |
...
| title | Line Defaults |
|---|
...
Option
...
Description
...
Width
...
Define the default thickness of lines used in charts.
...
Shapes
...
Line Shapes mark each data point on line charts.
...
| title | Fonts |
|---|
Option | Description |
|---|---|
Title | Define the font formatting to be applied to Chart Title text. |
Axis Title | Define the font formatting to be applied to Chart Axis Title text. |
Axis Label | Define the font formatting to be applied to Chart Axis Label text. |
Legend | Define the font formatting to be applied to Chart Legend text. |
Label | Define the font formatting to be applied to Chart Label text. |
Series Selection | Define the font to be applied to Chart Series Selection text. |
...
| title | Map Settings |
|---|
Option | Description |
|---|---|
GIS Base Layer | Specify whether or not to display a base layer underneath maps to provide location context by default. |
Google API Access | Specify if Google Maps can be used. These require internet access to work. |
Google Maps Point Limit | Specify the maximum number of single points to be displayed at any one time. |
Google GIS Label Background | Define the colour to be used for Map Label backgrounds. |
Google GIS Label Border | Define the colour to be used for GIS Maps Label borders. |
| |||||||||
| Expand | ||||||||||
|---|---|---|---|---|---|---|---|---|---|---|
| ||||||||||
|
| Expand | ||||||||
|---|---|---|---|---|---|---|---|---|
| ||||||||
|
| Expand | ||||||||||
|---|---|---|---|---|---|---|---|---|---|---|
| ||||||||||
|
| Expand | ||||||||||||||||||||||||||||
|---|---|---|---|---|---|---|---|---|---|---|---|---|---|---|---|---|---|---|---|---|---|---|---|---|---|---|---|---|
| ||||||||||||||||||||||||||||
|
| Expand | ||||
|---|---|---|---|---|
| ||||
|
| Expand | ||||
|---|---|---|---|---|
| ||||
|
| Styleclass | ||
|---|---|---|
| ||
| Anchor | ||||
|---|---|---|---|---|
|

| Expand | ||||||
|---|---|---|---|---|---|---|
| ||||||
|
| Expand | ||||||||
|---|---|---|---|---|---|---|---|---|
| ||||||||
|
| Expand | ||||||||||||||||
|---|---|---|---|---|---|---|---|---|---|---|---|---|---|---|---|---|
| ||||||||||||||||
|
| Expand | ||||||||||||||||
|---|---|---|---|---|---|---|---|---|---|---|---|---|---|---|---|---|
| ||||||||||||||||
|
| Expand | ||||||
|---|---|---|---|---|---|---|
| ||||||
|
| Expand | ||||||||||||||
|---|---|---|---|---|---|---|---|---|---|---|---|---|---|---|
| ||||||||||||||
|
| Expand | ||||||||||||||||
|---|---|---|---|---|---|---|---|---|---|---|---|---|---|---|---|---|
| ||||||||||||||||
|
| Expand | ||||||||||||||||||||||||||
|---|---|---|---|---|---|---|---|---|---|---|---|---|---|---|---|---|---|---|---|---|---|---|---|---|---|---|
| ||||||||||||||||||||||||||
|
| Styleclass | ||
|---|---|---|
| ||
| Anchor | ||||
|---|---|---|---|---|
|
| Expand | ||||
|---|---|---|---|---|
| ||||
Note: The following setting has been removed from the newer versions of Yellowfin: Title Background Image. |
| Expand | ||||||
|---|---|---|---|---|---|---|
| ||||||
Note: The following setting has been removed from the newer versions of Yellowfin: Filter Location. |
| Expand | ||||||||||||||
|---|---|---|---|---|---|---|---|---|---|---|---|---|---|---|
| ||||||||||||||
Note: The following settings have been deprecated in the newer versions of Yellowfin: Tab buttons, Associated Reports Location, My Content Location, and Search Location. |
| Expand | ||||||||||||||||
|---|---|---|---|---|---|---|---|---|---|---|---|---|---|---|---|---|
| ||||||||||||||||
|
| Styleclass | ||
|---|---|---|
| ||
| Anchor | ||||
|---|---|---|---|---|
|
| Expand | ||||||
|---|---|---|---|---|---|---|
| ||||||
|
| Expand | ||||
|---|---|---|---|---|
| ||||
|
| Styleclass | ||
|---|---|---|
| ||
| Anchor | ||||
|---|---|---|---|---|
|
| Anchor | ||||
|---|---|---|---|---|
|
| Expand | ||||||||||
|---|---|---|---|---|---|---|---|---|---|---|
| ||||||||||
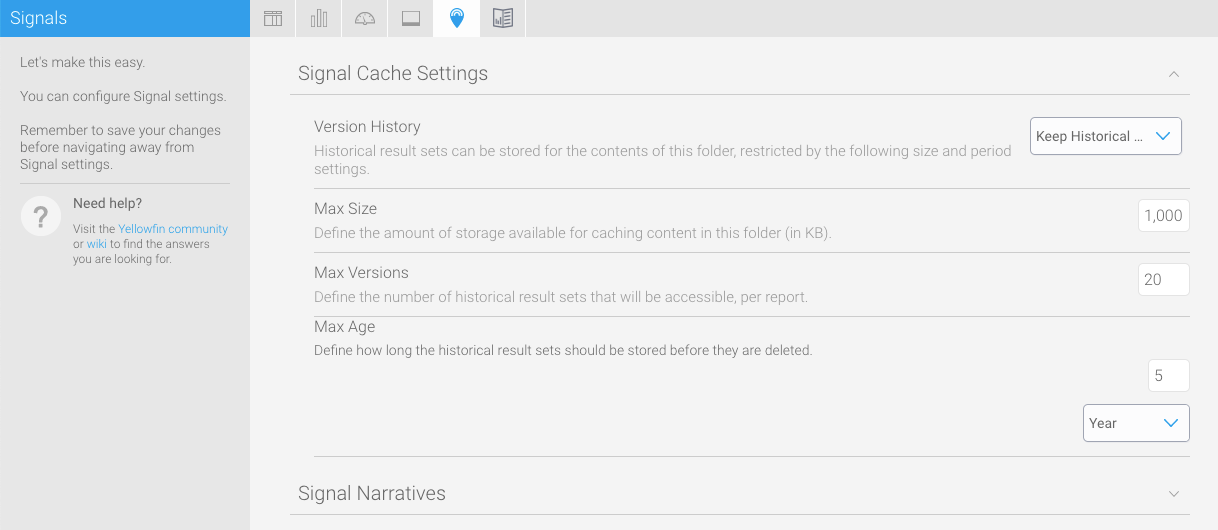
These settings maintain the cache that stores reports created for Signal analysis.
|
| Expand | ||||
|---|---|---|---|---|
| ||||
|
| Styleclass | ||
|---|---|---|
| ||
| Anchor | ||||
|---|---|---|---|---|
|
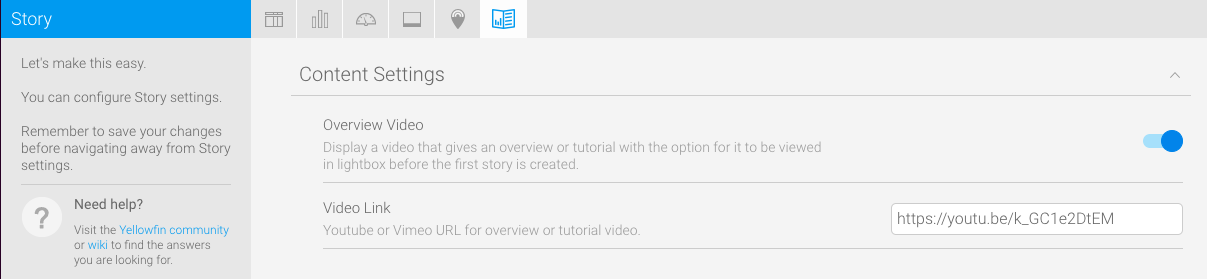
These settings relate to Yellowfin Stories and other content.
| Expand | ||||||
|---|---|---|---|---|---|---|
| ||||||
These settings maintain the cache that stores reports created for Signal analysis.
|
| Styleclass | ||
|---|---|---|
| ||
...
| title | Aixs & Plot Defaults |
|---|
Option | Description |
|---|---|
Show X Gridlines | Display gridlines attached to the horizontal axis of the chart by default. |
X Gridline Colour | Define the colour to display horizontal axis Gridlines by default. |
Show Y Gridlines | Display gridlines attached to the vertical axis of the chart by default. |
Y Gridline Colour | Define the colour to display vertical axis Gridlines by default. |
Horizontal Axis Colour | Define the colour of the horizontal axis by default. |
Horizontal Axis Thickness | Define the thickness of the horizontal axis by default. |
Vertical Axis Colour | Define the colour of the vertical axis by default. |
Vertical Axis Thickness | Define the thickness of the vertical axis by default. |
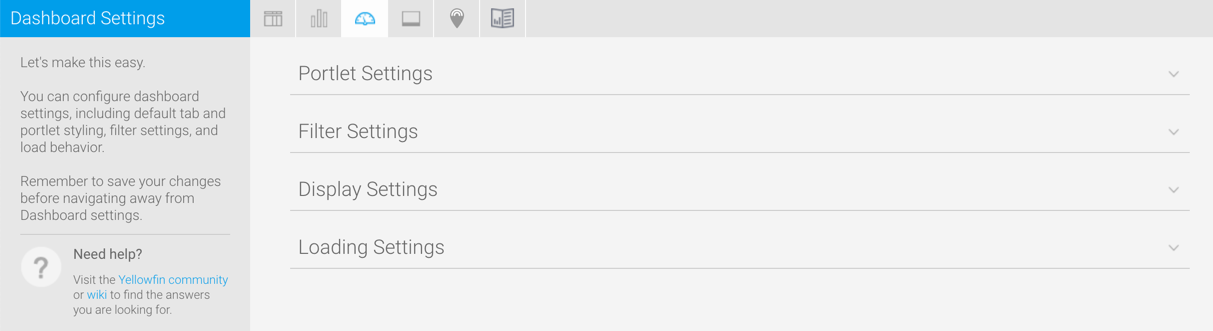
Dashboard Settings
| Styleclass | ||
|---|---|---|
| ||

...
| title | Portlet Settings |
|---|
...
Option
...
Description
...
Title Background Image
...
Hide the tab images behind the Title text of each portlet area. This will mean that the background colour is shown instead.
...
Action Buttons
...
Portlet buttons will only be displayed when the user hovers over a portlet.
...
| title | Filter Settings |
|---|
...
Option
...
Description
...
Filter Location
...
Specify the default location of the filter panel on the Dashboard. This can be overridden on a tab by tab basis.
...
Apply Style
...
Specify the default display of the filter Apply button or text.
...
| title | Display Settings |
|---|
...
Option
...
Description
...
Default Dashboard Width
...
Define the default width of the dashboard in pixels or % of the current window.
...
Alignment
...
Specify the default alignment of the dashboard.
...
Tab Buttons
...
Specify the location of the dashboard tab buttons, or disable them completely. These are the Add Tab, Edit, and Remove buttons.
...
My Content Location
...
Specify the location of the My Content panel, or disable it completely. This contains Favourite, Draft, and Recently Accessed content lists.
...
Associated Reports Location
...
Specify the location of the Associated Reports panel, or disable it completely.
...
Search Location
...
Specify the location of the Search box on the Dashboard, or disable it completely. This allows users to perform a content search, displaying results on the Browse page.
...
Lock Table Headings
...
Specify if column and/or row heading should be locked when displayed on the dashboard.
...
| title | Loading Settings |
|---|
...
Option
...
Description
...
Page Refresh
...
Each time the user changes the tab they are viewing, only the items relevant to the tab are reloaded, such as reports, filters, units, etc. This is only compatible with browsers that support HTML5.
...
Dashboard Loading
...
Display a coloured overlay on a tab to indicate that it's loading.
...
Display loading indicators when reports are viewed on a tab for the first time. Available options include:
- "Loading Report" message
- Coloured Overlay
- Loading Animation
...
Dashboard Report Refresh
...
Display loading indicators when reports are refreshed on a tab. This includes loading due to filtering, brushing, drilling, and refresh schedules. Available options include:
- "Loading Report" message
- Coloured Overlay
- Loading Animation
...
Define how to load reports on a tab. Options include:
- Sequential: load the reports one by one.
- Concurrent: load all the reports at the same time.
...
Schedule Page Refresh
...
Define if the entire dashboard page can be refreshed automatically, while this tab is being viewed.
...
Schedule Page Refresh Frequency
...
Define how often the entire Dashboard page is refreshed in minutes.
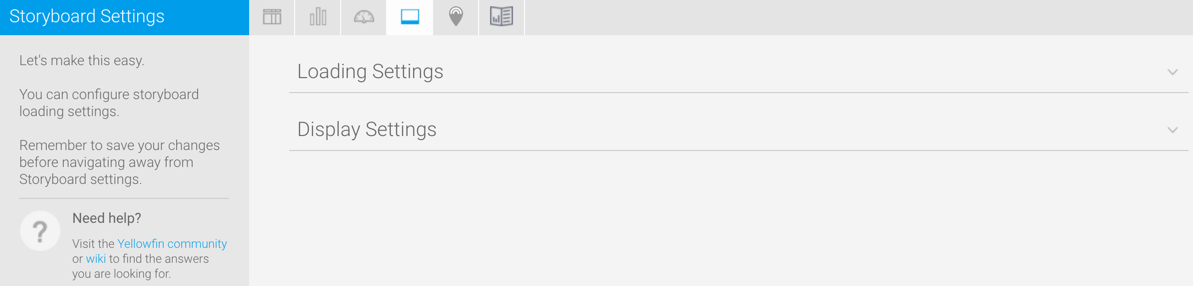
Storyboard Settings
| Styleclass | ||
|---|---|---|
| ||

...
| title | Loading Settings |
|---|
...
Option
...
Description
...
Slides Preloaded
...
Define the number of slides to be preloaded either side of the current slide.
...
Slides Loaded at Once
...
Define the total number of slides to be loaded at any one time.
...
| title | Display Settings |
|---|
...
Option
...
Description
...
Lock Table Headings
...
Specify if table headings should be locked when displayed in a slide.
| horizontalrule |
|---|
| Styleclass | ||
|---|---|---|
| ||
...