Page History
| Anchor | ||||
|---|---|---|---|---|
|
| Table of Contents | ||
|---|---|---|
|
Overview
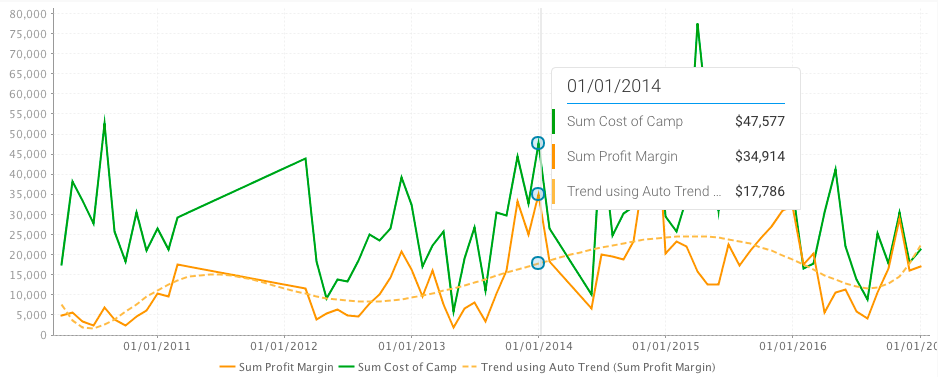
Tooltips are a great way of finding out values of data points. Hovering the cursor over a chart point will reveal the tooltip to reveal exact values and interact with the data.
| Section | ||||||||||
|---|---|---|---|---|---|---|---|---|---|---|
|
...
| Section | ||||||||
|---|---|---|---|---|---|---|---|---|
|
...
|
...
|
| Section | ||||
|---|---|---|---|---|
|
...
|
| Styleclass |
|---|
...
|
...
|
...
Tooltip Functions
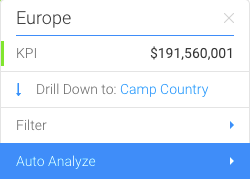
Here are some of the functions This section contains various processes on the interactivity of the tooltip. Functions that you can perform using the tooltip:include: filtering, data drilling, and auto analysis.
Click on a link below to view its procedure:
| Expand | ||
|---|---|---|
| ||
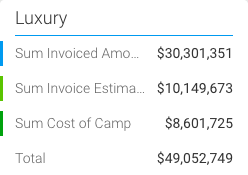
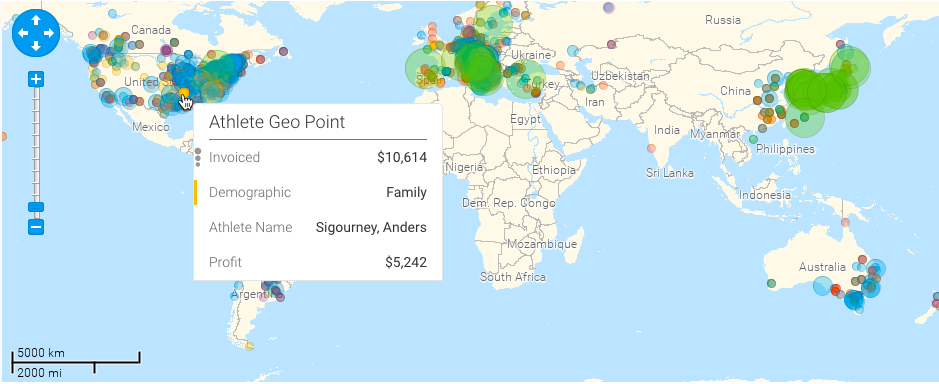
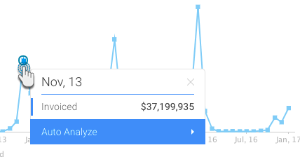
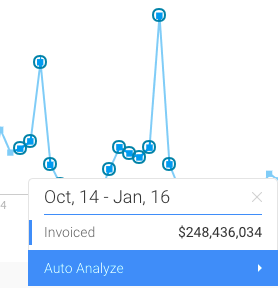
You can view the exact value of a data point, or multiple data points using the tooltip. On making the tooltip appear, you will be able to also view any functions that can be performed.
|
| Expand | ||||||||
|---|---|---|---|---|---|---|---|---|
| ||||||||
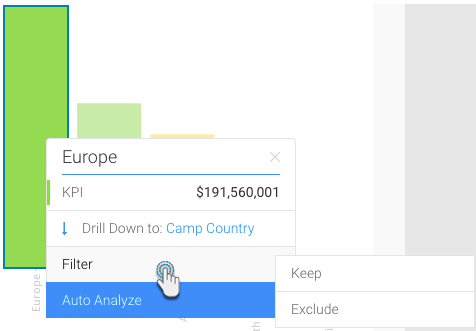
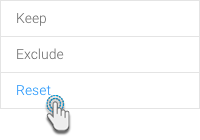
You can filter data on a chart by using these options.
|
| Expand | ||
|---|---|---|
| ||
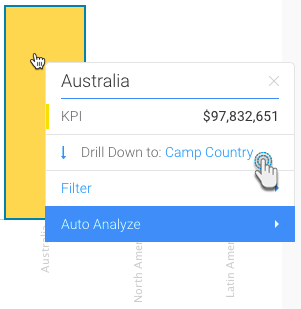
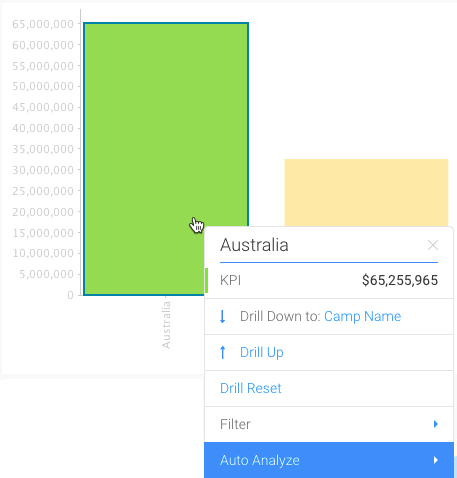
If a chart has drilling information (click here to find out more about this), then the tooltip will display the type of drilling, and then next level the data goes to.
|
| Expand | ||
|---|---|---|
| ||
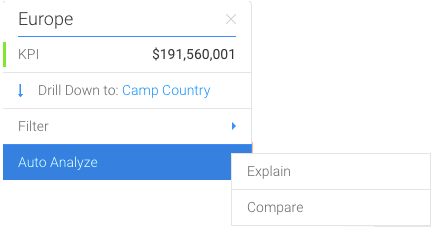
The Auto Analyze option in the tooltip is used to find out the Instant Insights on your chart. Learn how to do that here.
|
...
|
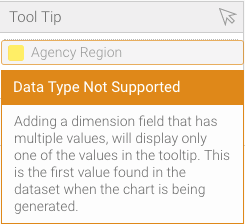
Dimensions in Tooltips
| Section | |||||||||||||||
|---|---|---|---|---|---|---|---|---|---|---|---|---|---|---|---|
|
| Styleclass | ||
|---|---|---|
| ||