Page History
You can This feature allows you to make values appear in your charts by entering predefined keywords using Yellowfin's text widgets.
Predefined Parameters
You can include the following keywords (in the exact format shown below) in your report. Yellowfin will replace them with their values when you preview your report.
...
| Parameter | Description |
|---|---|
| [reportname] | Adding this will replace the name of your report in your chart. You can set the report name when you publish it. |
| [reportdescription] | This will show your report's description. You can provide this description when you publish the report. |
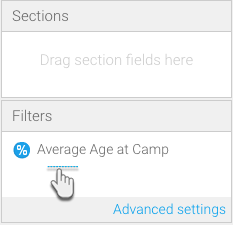
| [filter:1] | This parameter returns the filter you have applied in your report. The number '1' here represents the order of the filter, so the first filter will be displayed. You can use any filter from your list by entering its order number. |
Add a Parameter
- Create a report. (See our Report Creation section for more detail.)
Note: In order to use the filter parameter
When creating your report, make sure to include values in the Filters field when creating your report
- Once you have created your charts (you would need at least two charts), proceed to the design mode
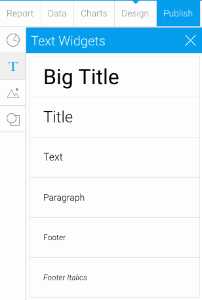
- Here, drag Drag a text widget (from the left side menu) into your canvas, while in the edit mode
Type in one of the parameters (
showndisplayed in the table above)
Note: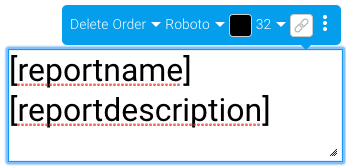
PublishNote For some of the parameters to display their values, you will need to
thenfirst publish the report and provide the details
in the form. Then return to the design edit mode to use the parameters.
- Then click on the Preview button to preview the report

- Save the changes, if any were made to the report
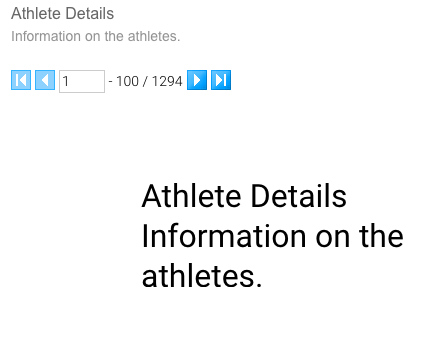
You will be able to see the values of the parameters you have included in the chart in place of the parameter keywords
...
, as shown in the example below
Note The report will
...
display
...
nothing if
...
the parameters you used have
...
no value.