Page History
| Anchor | top | top |
|---|---|---|
| Table of Contents | ||
|
Overview
| Styleclass | ||
|---|---|---|
|
The two major steps in creating a view include:
- Relationship Entity Diagram - selecting the tables you need from your database and defining how data in these tables are joined
- View Field Selection - defining which fields you wish to make available from these tables and providing metadata for them.
See Views Overview for more information.
1. Start the View creation process by using one of these methods:
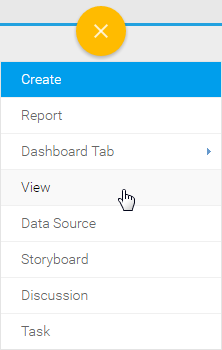
- Left Side Nav - open the left side navigation panel, click on Create, select the View option
- Top Right Button - click on the create button, select the View option.
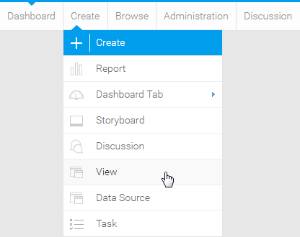
- Toolbar - click on the Create link in the toolbar, select the View option.
- Toolbar - click on the Create link in the toolbar, select the View option.
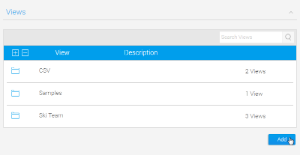
- Admin Console - navigate to the Admin Console, open the Views section, click on the Add button.
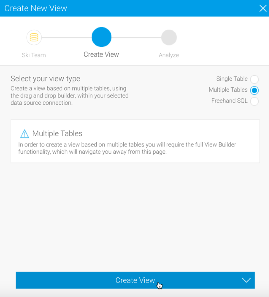
You will now see the the Create New View lightbox light box.
| Top Right |
|---|


|
| Toolbar | Admin Console |
|---|---|
 |  |
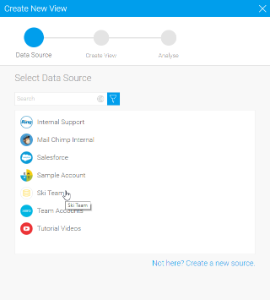
2. From here you will need to either;
- Select your data source, or
- Select your data source, or
- Create a new source
- Create a new source
We're going to select Ski Team from the source type list.
3. You will now see the basic parameters required for your view. We are going to look at a more complex view, so select the Multiple Tables option.

4. Click on the Edit Create View option button in order to access the main view builder.

5. The view builder page will now open. You will see a list of tables in the Database Tables panel on the left hand side and the View Table Options on the right hand side of the canvas.
![]()
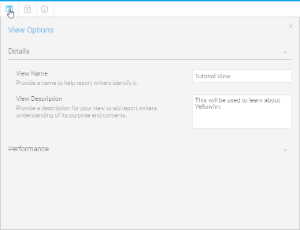
6. Update the view Name on and description in the View Options panel menu as shown on the righthere.
Call this view Tutorial View.
7. Enter the Business View Description: This will be used to learn about Yellowfin.
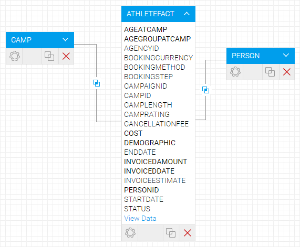
1. From the table list on the left of the screen, drag the following tables onto your canvas:
AthleteFact, Person, and Camp
You should now have three tables on your canvas as displayed on the right.

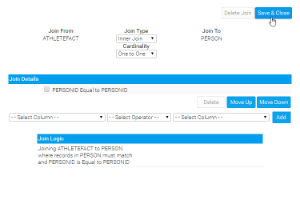
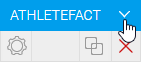
2. On the AthleteFact table click the  join link. This will open the join pop-up. Create a join between the AthleteFact Table and the Person Table.
Join From: AthleteFact
Join Type: Inner Join
Join To: Person
Join logic: PersonID Equal to PersonID
3. Click the Add button to add to the join list. You should now see the join logic as depicted on the right.
4. Click the Save & Close button to save your join.
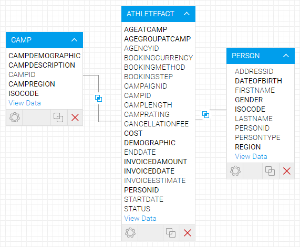
The join will now be displayed as a line between your AthleteFact and Person tables. Hovering over the join icon will display the join logic in a tooltip.
5. Create another Inner Join from AthleteFact to Camp where CampID = CampID
You can move your tables around the canvas to make the diagram easier to read if needed.
Click the Save & Close button to save your join. The join will now be displayed as a line between your AthleteFact and Person tables. Hovering over the join icon will display the join logic in a tooltip.

See Model for more information.
1. Click on the expand icon next to a table name to expand it.
2. Click the Properties link on the AthleteFact table. The table properties will now be displayed in the View Options panel.
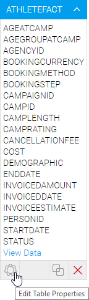
3. Click the Columns section link to open the options. A set of columns from the AthleteFact table will be displayed.
Select the AgeAtCamp, AgeGroupAtCamp, Cost, Demographic, InvoiceEstimate, InvoiceDate, and PersonID columns.
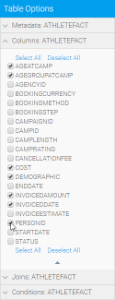
4. Once you have selected these, click on the Properties link again to update your diagram.
5. The columns you selected should now appear in bold on your table (as pictured).
6. Repeat the last step for each table.
Camp: CampDemographic, CampDescription, CampRegion, and ISOCODE
Person: DateOfBirth, Gender, Region, and ISOCODE
7. Click on Step 2 in Prepare in the navigation bar to continue to the View Fieldsdata preview page.

Field Categories & Meta Data
| Styleclass | ||
|---|---|---|
|
Initially, fields selected from the previous step will all be in the Unattached panel in folders that represent the tables that they originated from. These fields have not had meta data associated with them and cannot be used by your report writers. You must assign fields to categories ( folders ) in the Available Fields panel. The reason you do this is to organise you your fields in a way that is logical for the Report Writerreport writer, giving you the chance to group them differently than the table structure in the database.
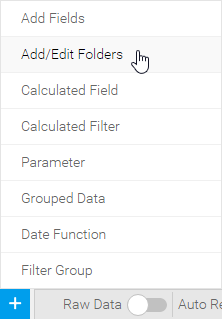
1. First of all, make sure you have the categories you want to use to divide your fields. Click on the Add/Edit CategoriesFolders link in the Available Fields sectionfrom the Create menu.
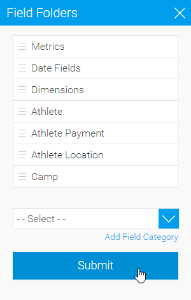
2. Add the Add the Athlete, Camp Athlete Location, Athlete Payment, and Time categories and click the Save & Close button. Athlete Payment, and Camp folders.
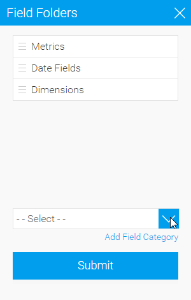
3. Click Submit to add the folders.
3. Click the expand arrow next to the folder names to see the columns you have selected from each table.the Add Fields option in the Create menu in order to add more fields to your folders.
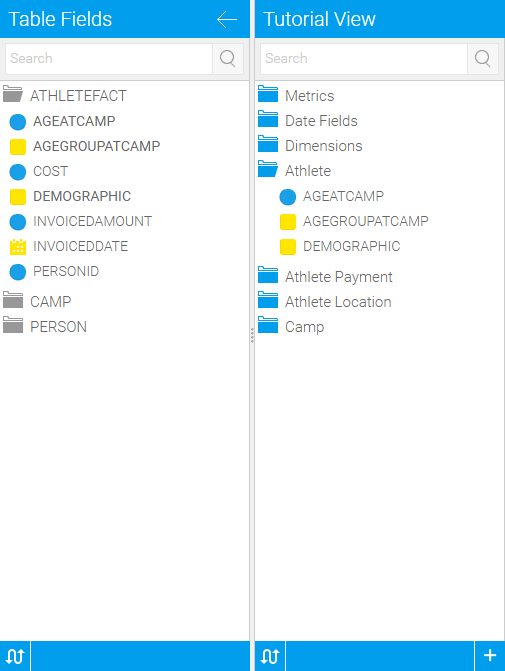
4. From the AthleteFact 4. From the AthleteFact table either select and drag the fields individually individually or use shift to click on each of the the AgeAtCamp, AgeGroupAtCamp, and Demographicand Demographic fields and drag these into the the Athlete folder folder.
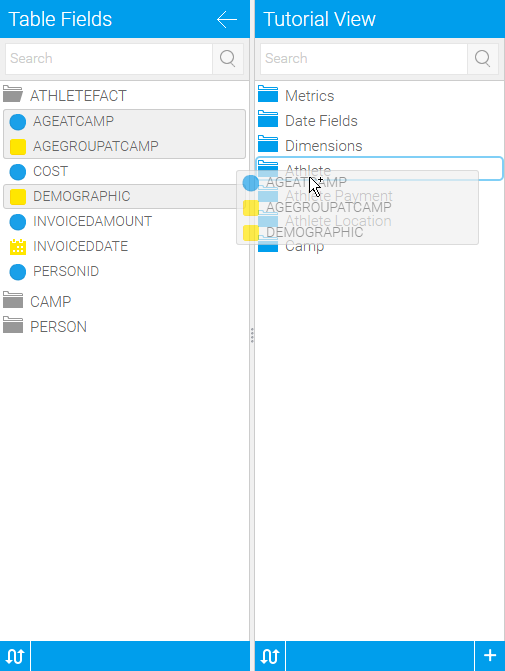
On completion you will note that the column names are now in bold indicating that they have been added to the view.
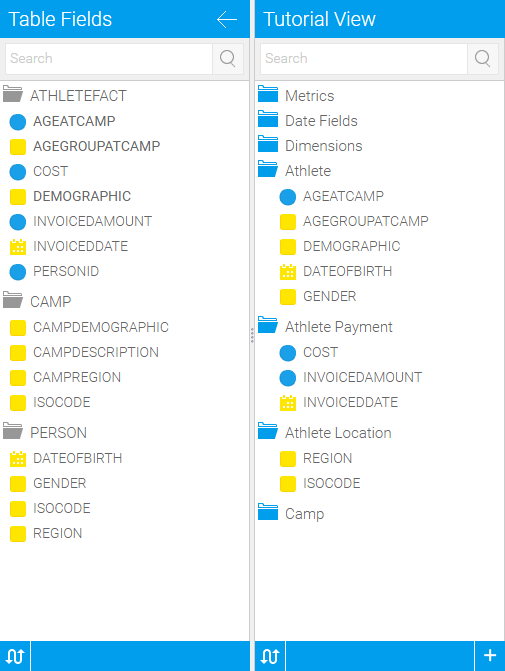
5. Now follow the same steps as above and put all the fields in their correct categoriesfolders.
Cost, InvoicedEstimate, and InvoicedDate fields > Athlete Payment category folder.
InvoiceDate field > Time category.
Camp fields > Camp categoryRegion and ISOCODE fields > Athlete Location folder.
Person fields > Athlete category folder.
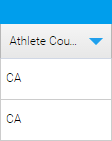
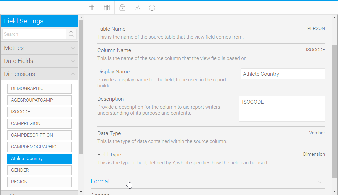
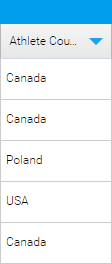
6. To update the field name to provide a more user friendly name – double click the ISOCODE field heading. Change the business name of the field to Athlete Country.

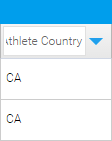
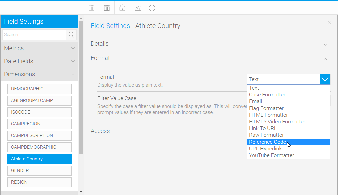
7. This field will use an Org Ref a Reference Code to convert ISO Country Codes to their respective names. To set this up, click on the Format tabdrop down menu on the field and choose the Edit Format option.

8.. Open the Format section of the menu.
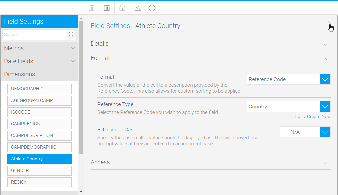
9. Set Set the Format option to Org Ref Reference Code. In this case you will use an existing type that we have set up for a sample.
See Organisation Reference Codes for See Reference Code Use for more information.
910. Select Select Country from the drop down menu.10
11. Click Click on Save the close button to commit your changes.
11. The ISOCODE 12. The Athlete Country column will now be updated in the Athlete folder. This method is used to provide business terms for all your attributes..
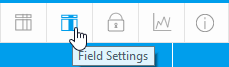
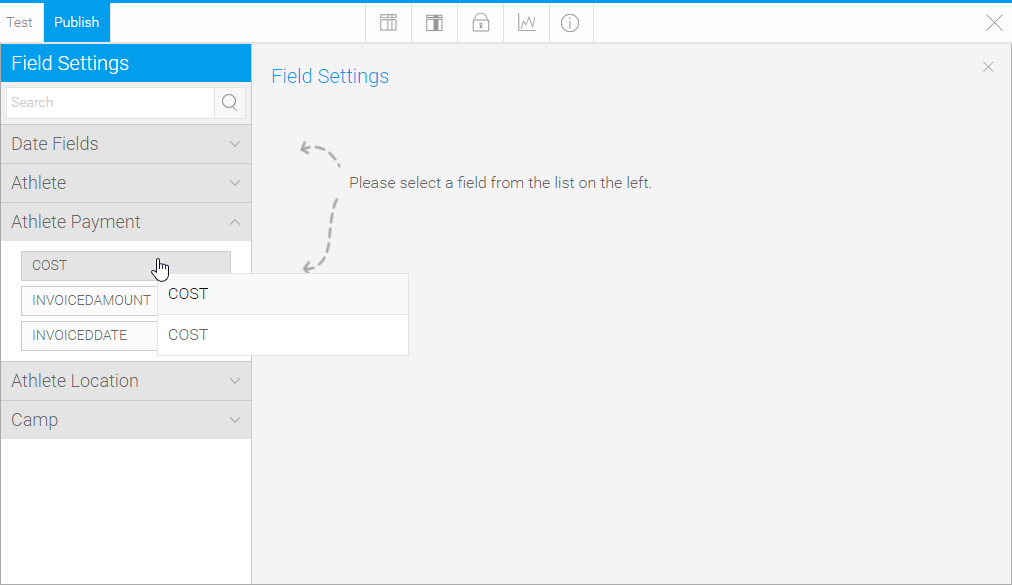
1. Click on the Field Settings menu to access formatting options for all your fields.
2. Locate Double click on the Cost field to open it in the edit window. Athlete Payment folder and click on it.
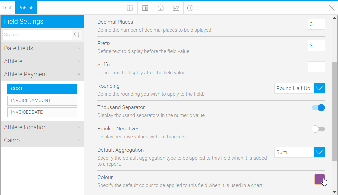
3. Expand the Format section.
4
2. Click on the Format Tab
3. Add a prefix of $ and set Decimal Places to 0.
4. Select SUM as the default aggregation.
5. Apply a colour for chart display if required.
6. Click on Save button to commit Close the menu to apply your changes.
Calculated Fields
| Styleclass | ||
|---|---|---|
|
Calculated Metric
This type of calculated field allows you to build a calculation that will return a numeric value as the result. In this example we will aim to calculate profit by subtracting cost from invoice figures.
1. In the Unattached panel open the Calculated Fields folder and then the Formula Builder folder.
2. Drag the Metric field into the Athlete Payment folder.
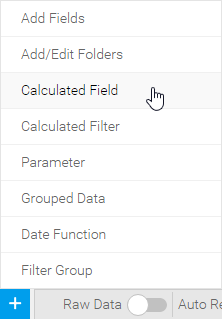
Click on the Create button and select the Calculated Field option.
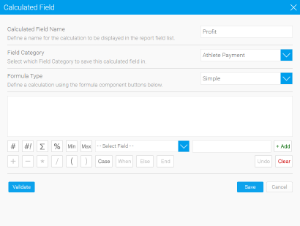
2. 3. You will now see the Definition tabCalculated Field window. Set the Business Calculated Field Name to Profit and enter the calculation logic Invoiced - Cost into the Description - this is useful for users that want to know the formula used in a calculation.
3. Set the Field Folder to Athlete Payment.
4. Click Leave the Formula tab to define the calculationType as Simple.
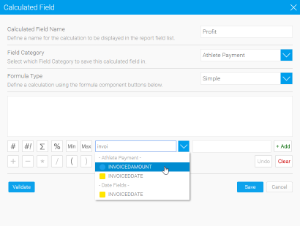
5. From the Select Field drop down choose INVOICEDESTIMATE search for INVOICEDAMOUTNT and click the + Add button next to it to build it into the calculation.
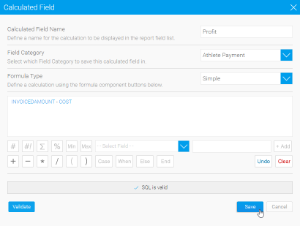
6. Now click the - (minus) button directly below the Select Field drop down.
7. Select the COST field and click the + Add button to finish this simple calculation.
8. Click the Click here to test this formula link Validate button in order to let Yellowfin validate your calculation. You should see a Formula Successful SQL is valid message displayed above the builder if successful.
9. Click Activate Save to save the field and make it available for use in reports.
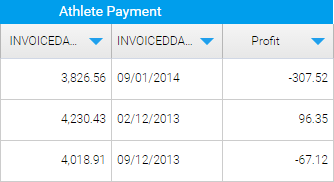
11. You will now see the Profit calculated field in the Athlete Payment category and it will have a green icon instead of the usual metric icon to show that it's a formula.
See Calculated Fields for more information.
Date Hierarchy Fields
Date Hierarchy calculated fields allow you to build levels of a hierarchy based on a single date field in your database. This can then be used to define Drill Down hierarchies, or for other purposes in reports.
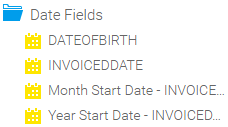
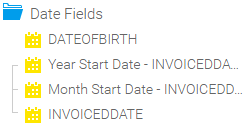
1. First you will need to ensure you have a date field to use with the hierarchy templates. We've already added got the InvoiceDate field into in the Time Date Fields folder, so this has been taken care of.
2. Drag each of the levels one by one into You are now going to use the Date Function builder to create the other levels of your hierarchy, adding them to the same folder as your date field - this is important for when you build the hierarchy later.
Start with the Year Month Start Date. The reason we're using the Year Month Start Date is so that the field is still a date format, even though we can change the display to be just the Year Month component. This means we can use it for Time Series charts and other date related functionality.
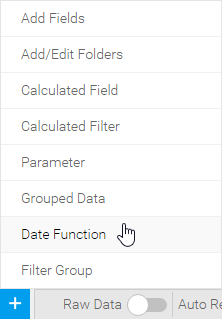
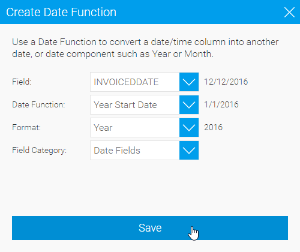
2. Click on the Create button and select the Date Function option.
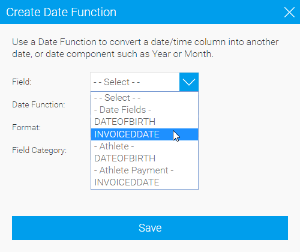
3. Rename Select the INVOICEDDATE field to Year and the Description to Invoiced Year. This lets the user know that the field is based on the Invoiced Date, avoiding incorrect use.from the Date Fields folder to base the function on.
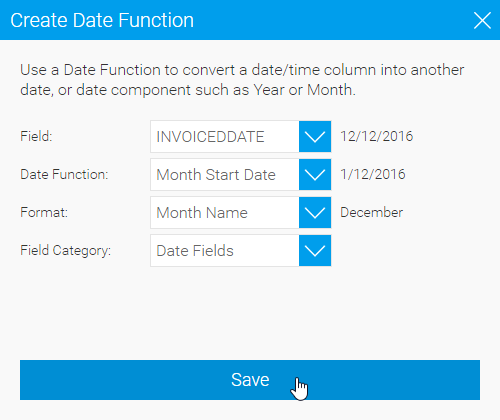
4. Set the Date Function field type to Dimension on the Definition tab - the field has to be a dimension in order to use it in a Drill Down hierarchy as metrics are not deemed compatiblebe Month Start Date.
5. Set the field to base the Year on to INVOICEDATE, found at the very bottom of the Definition tabformat to be Month Name. This will mean that the name of the date's month will be displayed in reports and charts, but underneath it will still be a date value.
6. Activate the field.Click Save to complete the function..
7. Repeat the same process, this time creating a Month a Year field based on Month on Year Start Date of of Invoiced Date.
8. Double click your INVOICEDATE field in order to rename it to Invoiced Date and change the field type to Dimension in preparation for building the hierarchy.
9. Activate the field.
You will now have three levels on which to create a date hierarchy (see the next section).
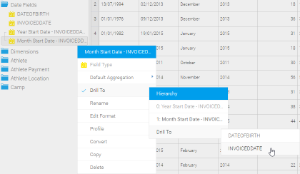
When creating the hierarchy, you need to start from the top level and work your way down. In this example we are creating a Year > Month > Date hierarchy, so we will start with the Year field at the top.
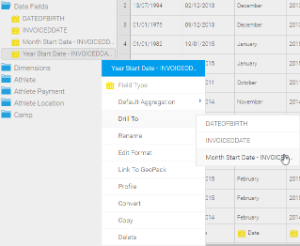
1. Double click the Year and navigate to the Hierarchy tab.2. Enable Drill Down and select the Month field as Click on the menu on your Year field and select the Drill To option. Activate the field.
, then click on the field you want to drill down to (Month Start Date)
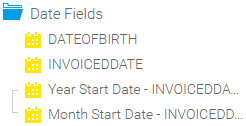
2. You will now notice that there is a link between the Year and Month fields. This lets you know there is a hierarchy link defined between the two fields.
3. Next repeat the process by double clicking on the Month field, navigating to the Hierarchy tab, enabling Drill Down field drop down menu, navigate to Drill To, and specifying the Invoiced Date field as the Drill To option.
4. Activate the field.
5. You will now see there is a 3 level hierarchy defined. You wont have to define Drill Down options on the bottom level (Invoiced Date).
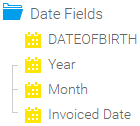
5. Once you rename the fields, you'll have a clean hierarchy, ready for use in a report.
See Drill Down Hierarchies for more information.
1. From the View Fields page click the last step to continue to the Summary page.
2. You can explore the tabs to see example data and the SQL that Yellowfin generates.
3. Click the Activate button to save you view and activate it for use.
4. You will now see on the general tab that your Tutorial view is Active. It is now ready to report off.
5. Click Close to close the view and return to you view list.
See View Summary for more information.
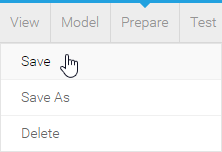
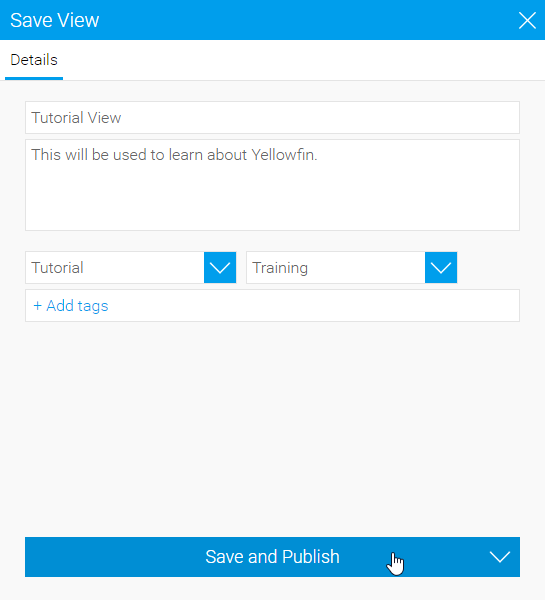
any step of the builder you can click on the View menu and save your view.

2. Select the Save option.
3. Update the view name and description if required. Specify a content folder and sub folder to store the View in.
4. Click Save and Publish to complete.
Further Information
| Styleclass | ||
|---|---|---|
|
| horizontalrule |
|---|
| Styleclass | ||
|---|---|---|
|