Page History
| Section | |
|---|---|
|
...
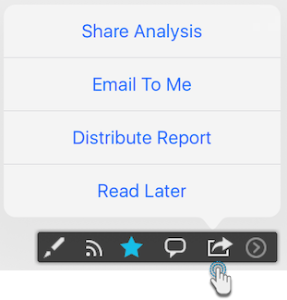
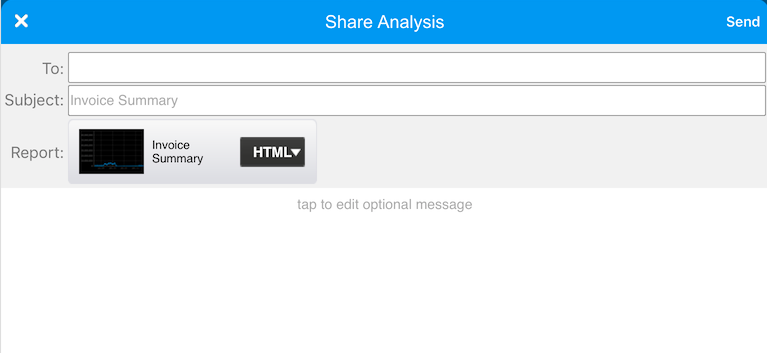
| Broadcast
| Report
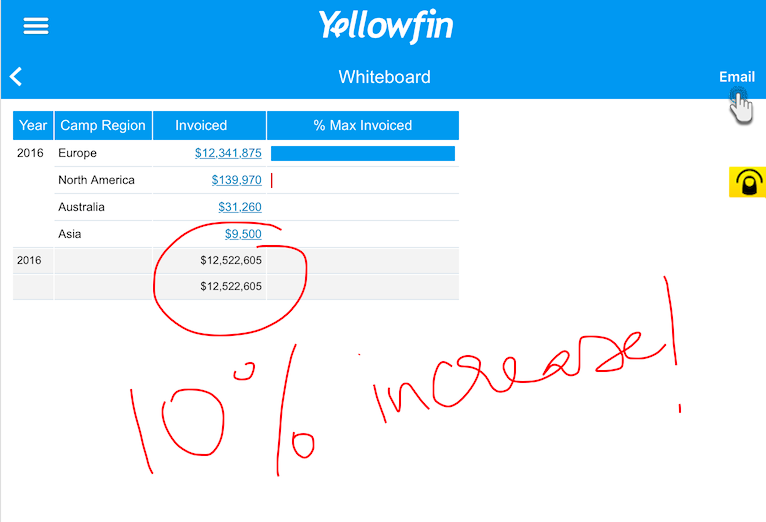
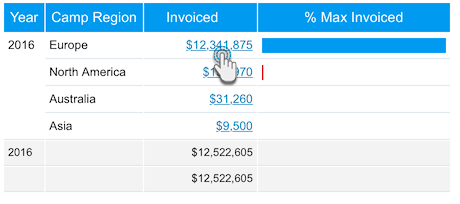
Enter your comment in the pop-up that appears and tap on Ok to save it
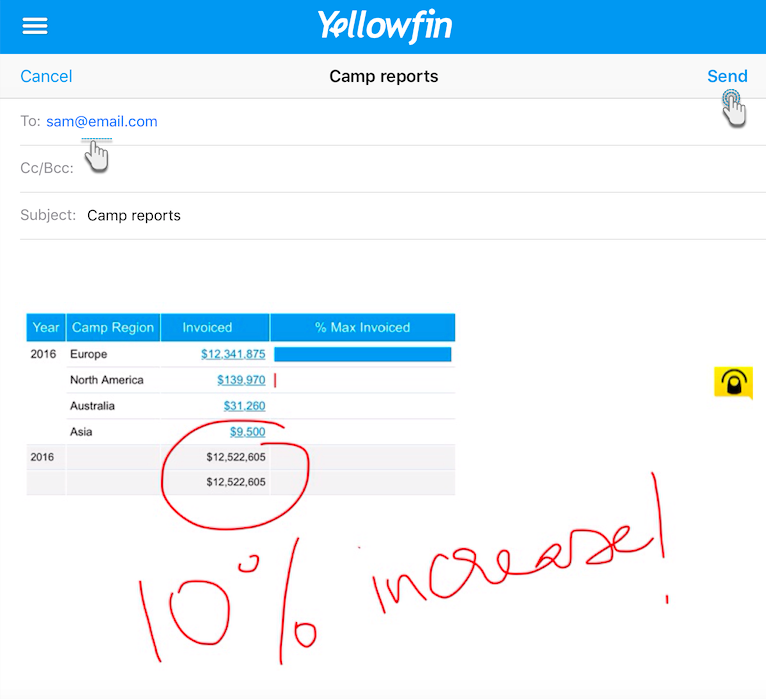
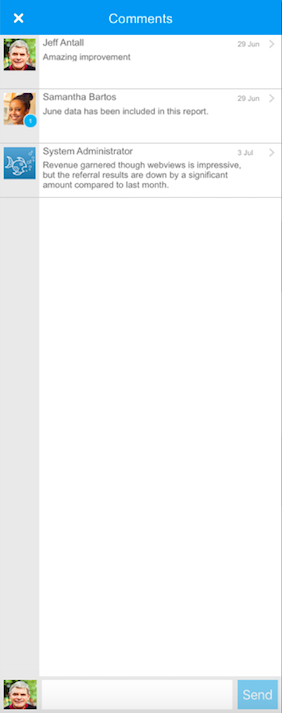
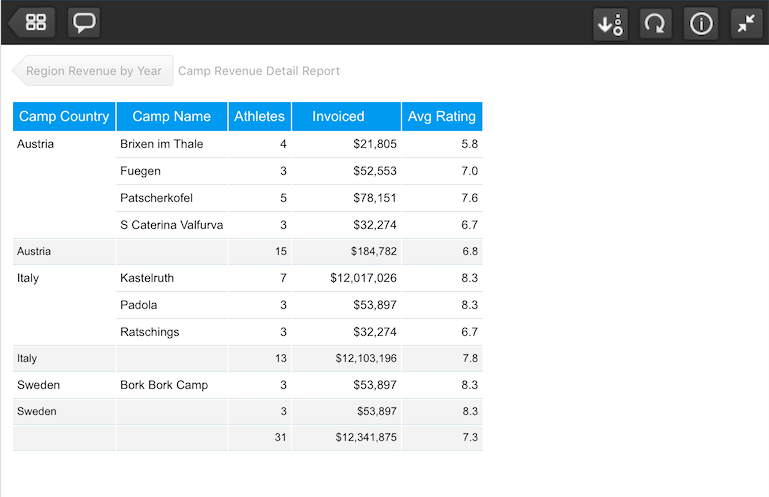
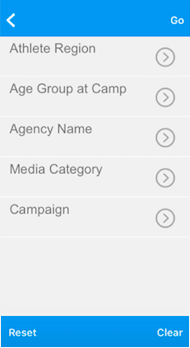
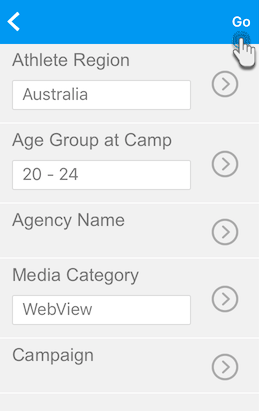
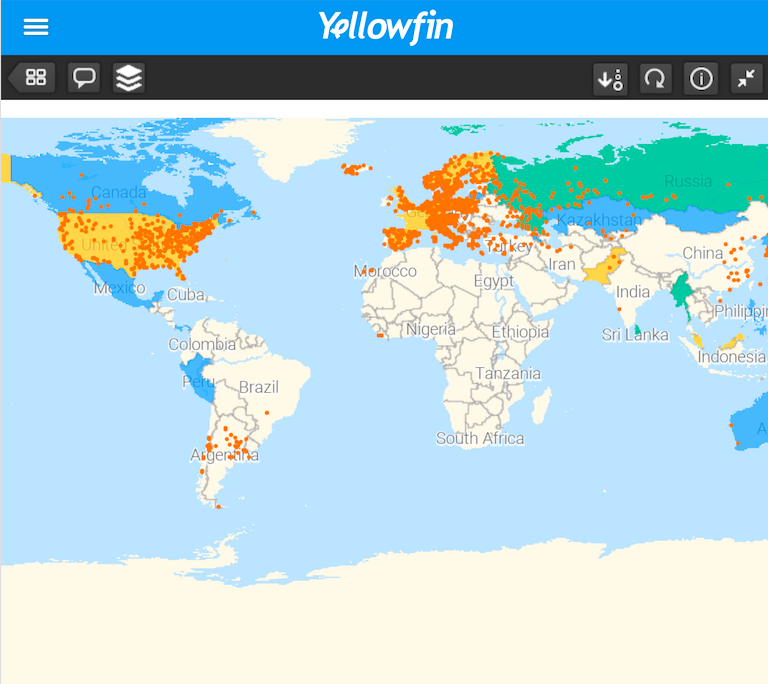
The following screen will appear
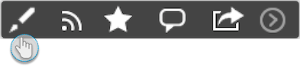
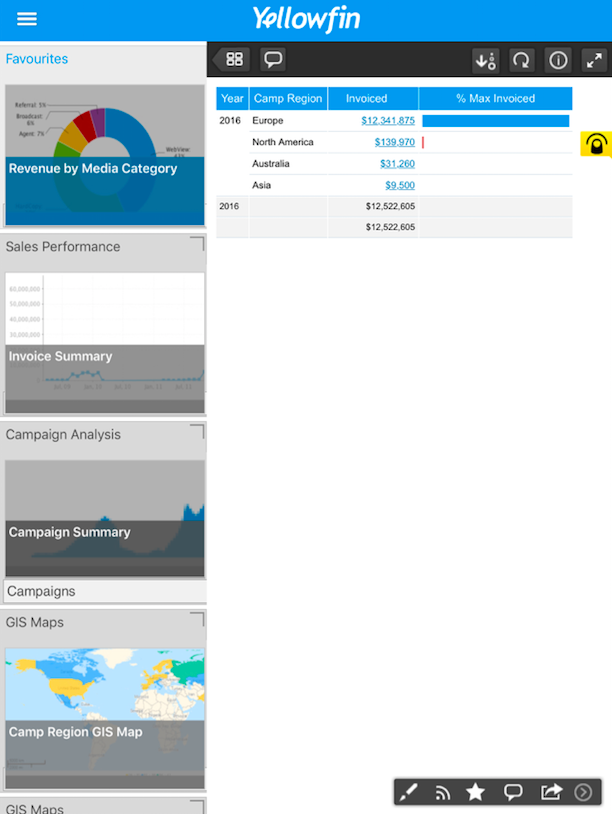
| Expand side menu
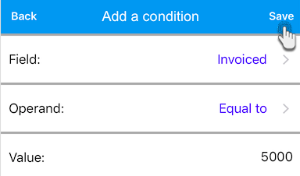
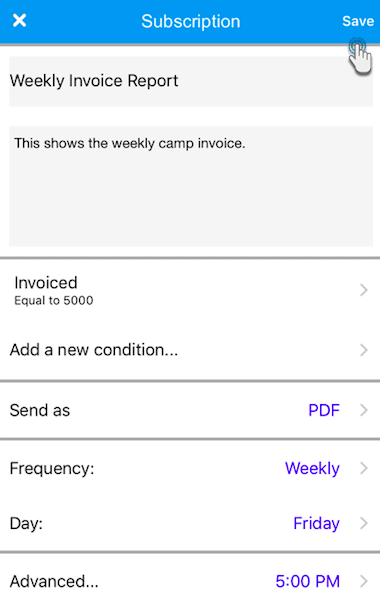
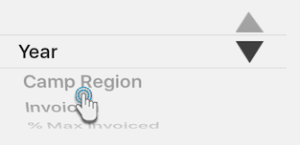
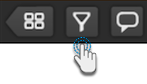
| Report Filters
|
| Section | |
|---|---|
|
...
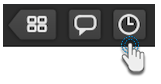
| Broadcast
| Report
Enter your comment in the pop-up that appears and tap on Ok to save it
The following screen will appear
| Expand side menu
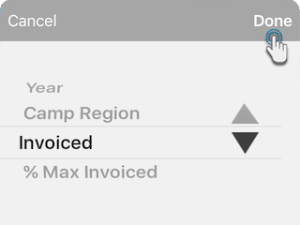
| Report Filters
|