Like what you see? Have a play with our trial version.

Versions Compared

Key

  • This line was added.
  • This line was removed.
  • Formatting was changed.

...

Overview


Styleclass
ClasstopLink

top20709819

The Content Setting page allows administrators to configure a wide range of defaults and formatting settings for content. Navigate to Menu > Administration >  Content Settings and change the settings that fall under the following tabs:


  1. Report Settings20709819Chart Settings
  2. 20709819
  3. Dashboard Settings20709819Storyboard Settings
  4. 20709819
  5. Signal Settings
  6. Content Settings

...

  1. 20709819


Report Settings


Styleclass
ClasstopLink

top20709819


Expand
titleStyles


Option

Description

Report Title

Title

Define the font formatting to be applied to the Report Title.

Description

Define the font formatting to be applied to the Report Description.

Border

Define a border for the Report Title & Description if one is required.

Background

Define a custom background colour for the Report Title & Description area if required.

Column & Row Headings

Text

Define the font formatting to be applied to table Column and Row headings.

Background

Define the background colour to be applied to table Column and Row headings.

Header Height

Define the height of the table headers in pixels.

Header Padding

Define the space between the text in each header cell and the cell border in pixels.

Cross Tab Metric Headings

Text

Define the font formatting to be applied to cross tab metric headings.

Background

Define the background colour to be applied to table cross tab metric headings.

Header Height

Define the height of the table headers in pixels.

Header Padding

Define the space between the text in each header cell and the cell border in pixels.

Cross Tab Column Values

Text

Define the font formatting to be applied to cross tab column values.

Background

Define the background colour to be applied to table cross tab column values.

Header Height

Define the height of the table headers in pixels.

Header Padding

Define the space between the text in each header cell and the cell border in pixels.

Cross Tab Row Values

Text

Define the font formatting to be applied to cross tab row values.

Background

Define the background colour to be applied to table cross tab row values.

Header Height

Define the height of the table headers in pixels.

Header Padding

Define the space between the text in each header cell and the cell border in pixels.

Data

Text

Define the font formatting to be applied to table cells.

BackgroundDefine a custom background color for the Report data area if required.

Cell Height

Define the height of the table rows in pixels.

Cell Padding

Define the space between the text in each cell and the cell border in pixels.

Cell Spacing

Define the space between each cell in pixels.

Row Shading

Define an alternate row shading colour for the body of tabular reports.

Row Highlight

Define a highlight colour displayed when the mouse pointer hovers over a row.

Border
PositionDefine where borders should be displayed around the edges of the cell.
ColorDefine the color of the cell borders.
WidthDefine the thickness of the cell borders.

Section Title

Text

Define the font formatting to be applied to Report Section titles.

Background

Define a background colour for Report Section titles.

Header & Footer

Header

Define the contents of the left, middle, and right page header areas used in report exports. The following components are available:

  • Date: this will insert the current date into the header when the report is exported, printed, or shared.
  • Page No: this will insert a page number on each page of the report when it's exported, printed, or shared.
  • Description: this will insert the report description into the header when the report is exported, printed, or shared.
  • Title: this will insert the report title into the header when the report is exported, printed, or shared.
  • Time: this will insert the current time into the header when the report is exported, printed, or shared.
  • Space: this will insert a space into the header, for use between two components, for example: date space time.
  • New Line: this will insert a line break into the header, for use between components, for example: title new line description.
  • Text: this will allow the administrator to provide custom text to be used in the header.
  • Image: this will allow the administrator to select an image to use in the header, such as a logo.

Footer

Define the contents of the left, middle, and right page footer areas used in report exports. The following components are available:

  • Date: this will insert the current date into the footer when the report is exported, printed, or shared.
  • Page No: this will insert a page number on each page of the report when it's exported, printed, or shared.
  • Description: this will insert the report description into the footer when the report is exported, printed, or shared.
  • Title: this will insert the report title into the footer when the report is exported, printed, or shared.
  • Time: this will insert the current time into the footer when the report is exported, printed, or shared.
  • Space: this will insert a space into the footer, for use between two components, for example: date space time.
  • New Line: this will insert a line break into the footer, for use between components, for example: title new line description.
  • Text: this will allow the administrator to provide custom text to be used in the footer.
  • Image: this will allow the administrator to select an image to use in the footer, such as a logo.

Text

Define the font formatting to be applied to header and footer text used in report exports.

Report Summary

Text

Define the font formatting to be applied to Report Summary text.

Default Chart Color

Specify the default chart color to be used in Report Summary charts.


...

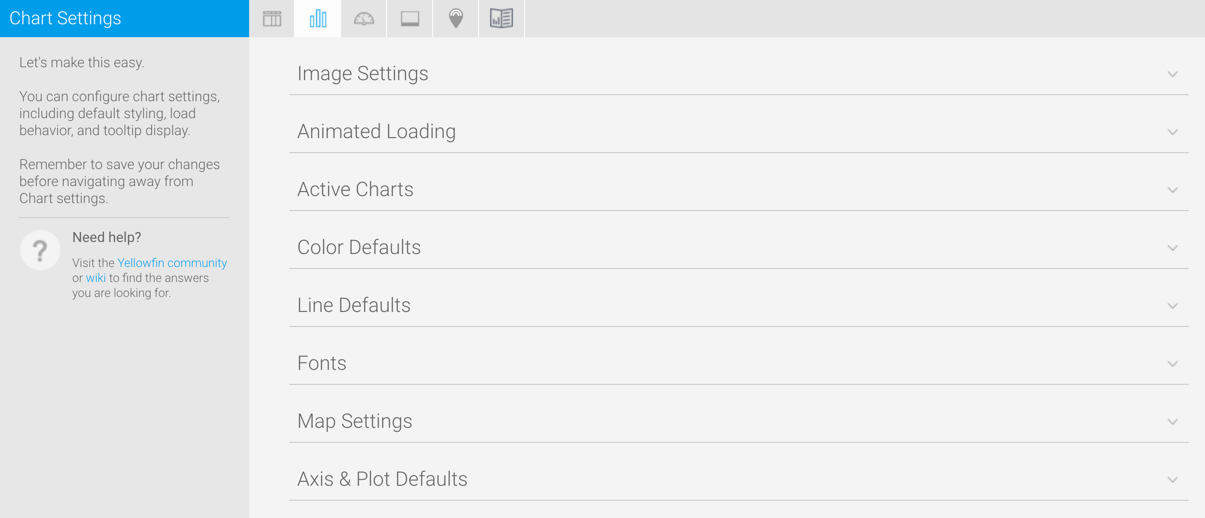
Chart Settings


Styleclass
ClasstopLink

top20709819


Expand
titleImage Settings


Option

Description

Chart Image Format

Specify the image format for charts to be generated as. Options include PNG or JPG.

Draggable Thumbnails

Allow you to open a chart in a new window and drag the image into an open program or save it for later use.


...

Expand
titleAixs & Plot Defaults


Option

Description

Show X Gridlines

Display gridlines attached to the horizontal axis of the chart by default.

X Gridline Color

Define the color to display horizontal axis Gridlines by default.

Show Y Gridlines

Display gridlines attached to the vertical axis of the chart by default.

Y Gridline Color

Define the color to display vertical axis Gridlines by default.

Horizontal Axis Color

Define the color of the horizontal axis by default.

Horizontal Axis Thickness

Define the thickness of the horizontal axis by default.

Vertical Axis Color

Define the color of the vertical axis by default.

Vertical Axis Thickness

Define the thickness of the vertical axis by default.


Dashboard Settings


Styleclass
ClasstopLink

top20709819


Expand
titlePortlet Settings


Option

Description

Title Background Image

Hide the tab images behind the Title text of each portlet area. This will mean that the background colour is shown instead.

Action Buttons

Portlet buttons will only be displayed when the user hovers over a portlet.


...

Expand
titleLoading Settings


Option

Description

Page Refresh

Each time the user changes the tab they are viewing, only the items relevant to the tab are reloaded, such as reports, filters, units, etc. This is only compatible with browsers that support HTML5.

Dashboard Loading

Display a coloured overlay on a tab to indicate that it's loading.

Dashboard Report Loading

Display loading indicators when reports are viewed on a tab for the first time. Available options include:

  • "Loading Report" message
  • Coloured Overlay
  • Loading Animation

Dashboard Report Refresh

Display loading indicators when reports are refreshed on a tab. This includes loading due to filtering, brushing, drilling, and refresh schedules. Available options include:

  • "Loading Report" message
  • Coloured Overlay
  • Loading Animation
Report Loading

Define how to load reports on a tab. Options include:

  • Sequential: load the reports one by one.
  • Concurrent: load all the reports at the same time.

Schedule Page Refresh

Define if the entire dashboard page can be refreshed automatically, while this tab is being viewed.

Schedule Page Refresh Frequency

Define how often the entire Dashboard page is refreshed in minutes.

...


Storyboard Settings


Styleclass
ClasstopLink

top20709819


Expand
titleLoading Settings


Option

Description

Slides Preloaded

Define the number of slides to be preloaded either side of the current slide.

Slides Loaded at Once

Define the total number of slides to be loaded at any one time.


...

Signals Settings

Styleclass
ClasstopLink

top20709819

Image RemovedImage Added


Expand
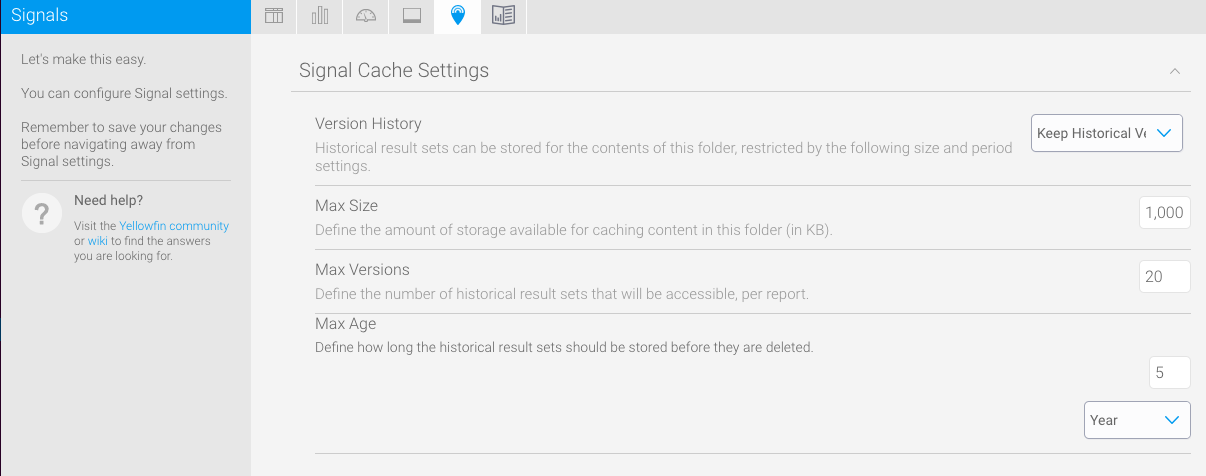
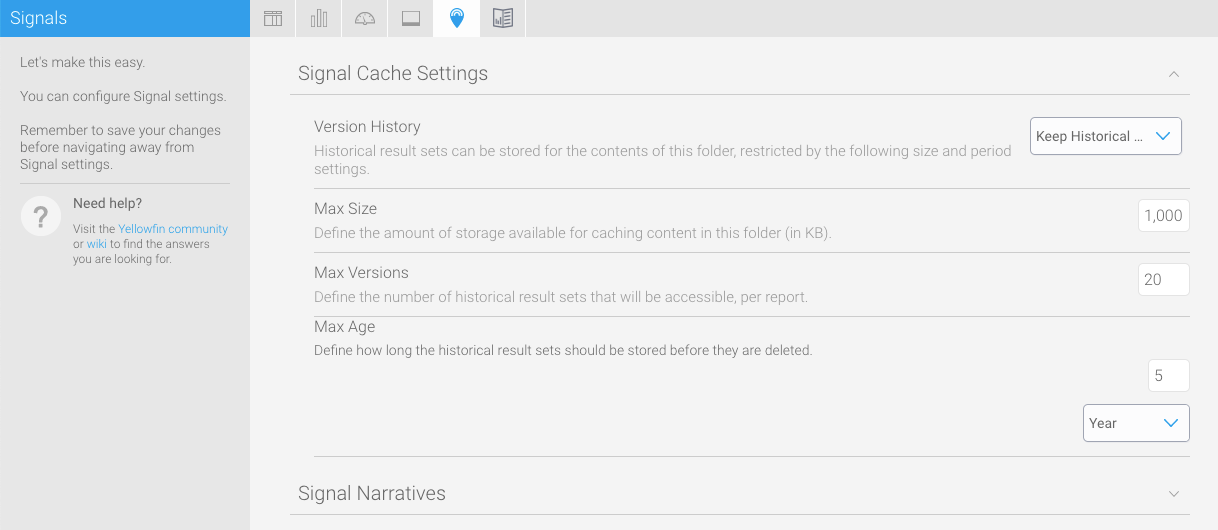
titleSignal Cache Settings


These settings maintain the cache that stores reports created for Signal analysis.

Option

Description

Version History

The version history allows you to store the data returned from a Signals analysis. Includes the following options:

  • Current version only: This option switches off the caching. This results in the data being fetched from the source when looking at a Signal, since it isn’t being cached/stored.

  • Keep historical versions: This option will cache all previous data result sets from a Signal analysis. Note: It's important to remember that this option can quickly build up quite a large amount of data, so use this option sparingly.

Max Size

The maximum size for Signal analysis data to be saved in cache or in the database where version history is required.

Max Version

This maximum versions of analysis report to save. This does not affect Signals as each Signal only has a single report.

Max Age

The maximum age a Signals report can be cached for. Reports older than this age will be deleted.


Expand
titleSignal Narratives


Option

Description

Suppress Access Filters

This setting allows you to show or hide access filter values from being mentioned in Signal narratives. By default access filters will be referenced in a narrative, but you can choose to turn it off.

Signal narratives also take formatted data values into account, for example, reference codes applied to data.


Content Settings

Styleclass
ClasstopLink

top20709819

These settings relate to Yellowfin Stories and other content.

...

horizontalrule

Styleclass
ClasstopLink

top


...

20709819