Page History
...
- Create a new Report
Use your mouse to drag your data from the left panel to the Columns, Sections and Filters fields
Waterfall charts require one dimension and at least one metric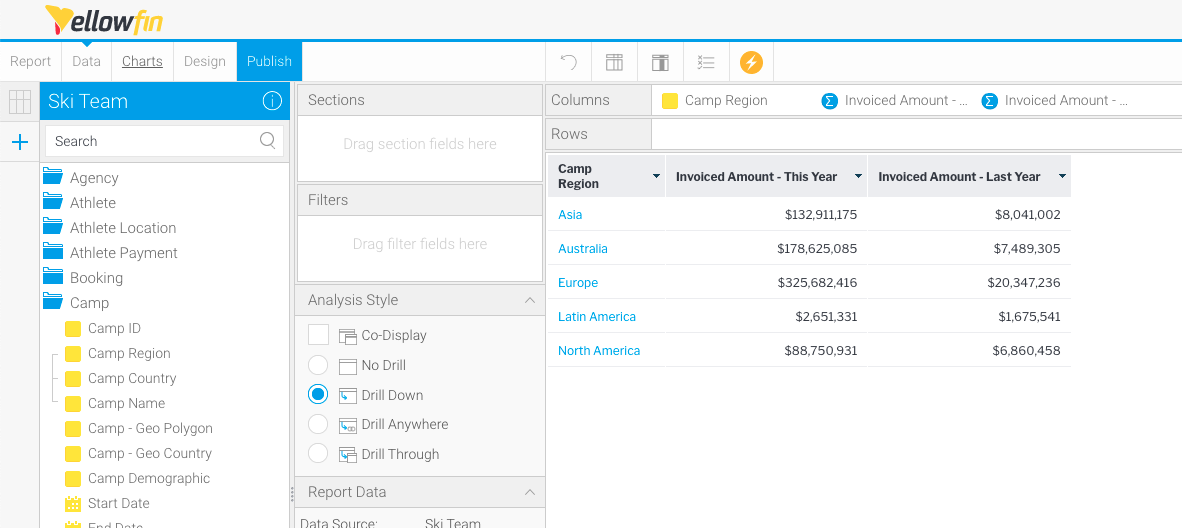
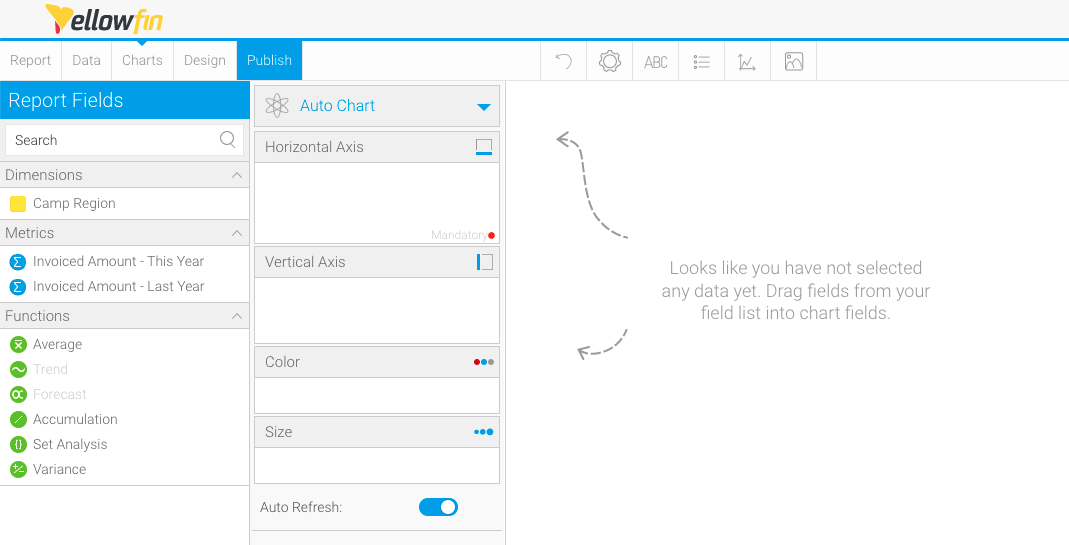
- Click Charts to create your chart
- Click Auto Chart, then click Select Chart Type
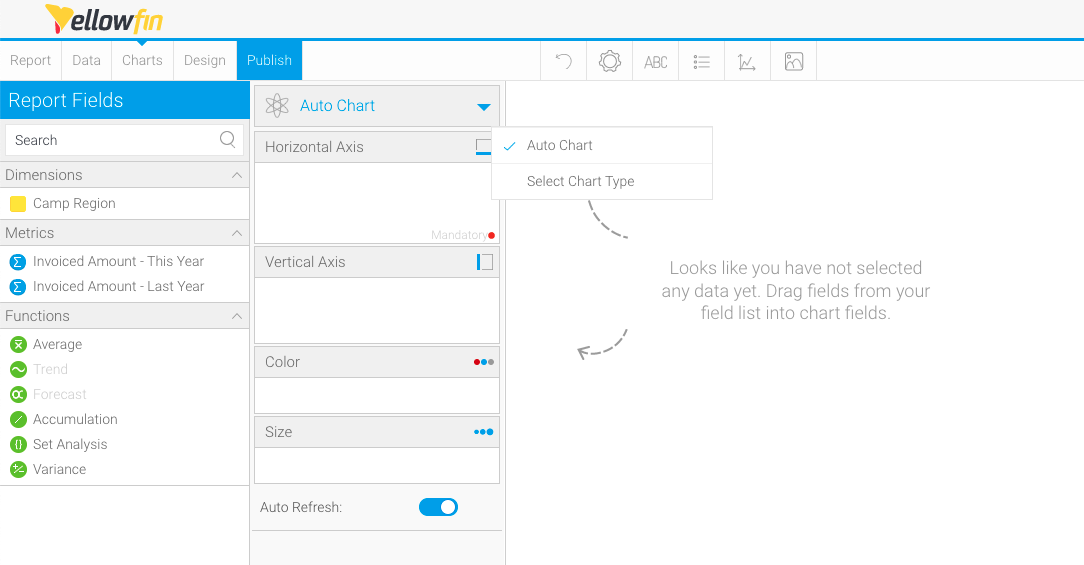
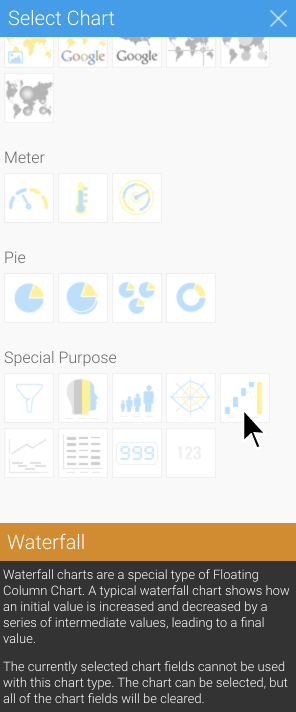
The Select Chart panel will slide in from the right-hand side of the page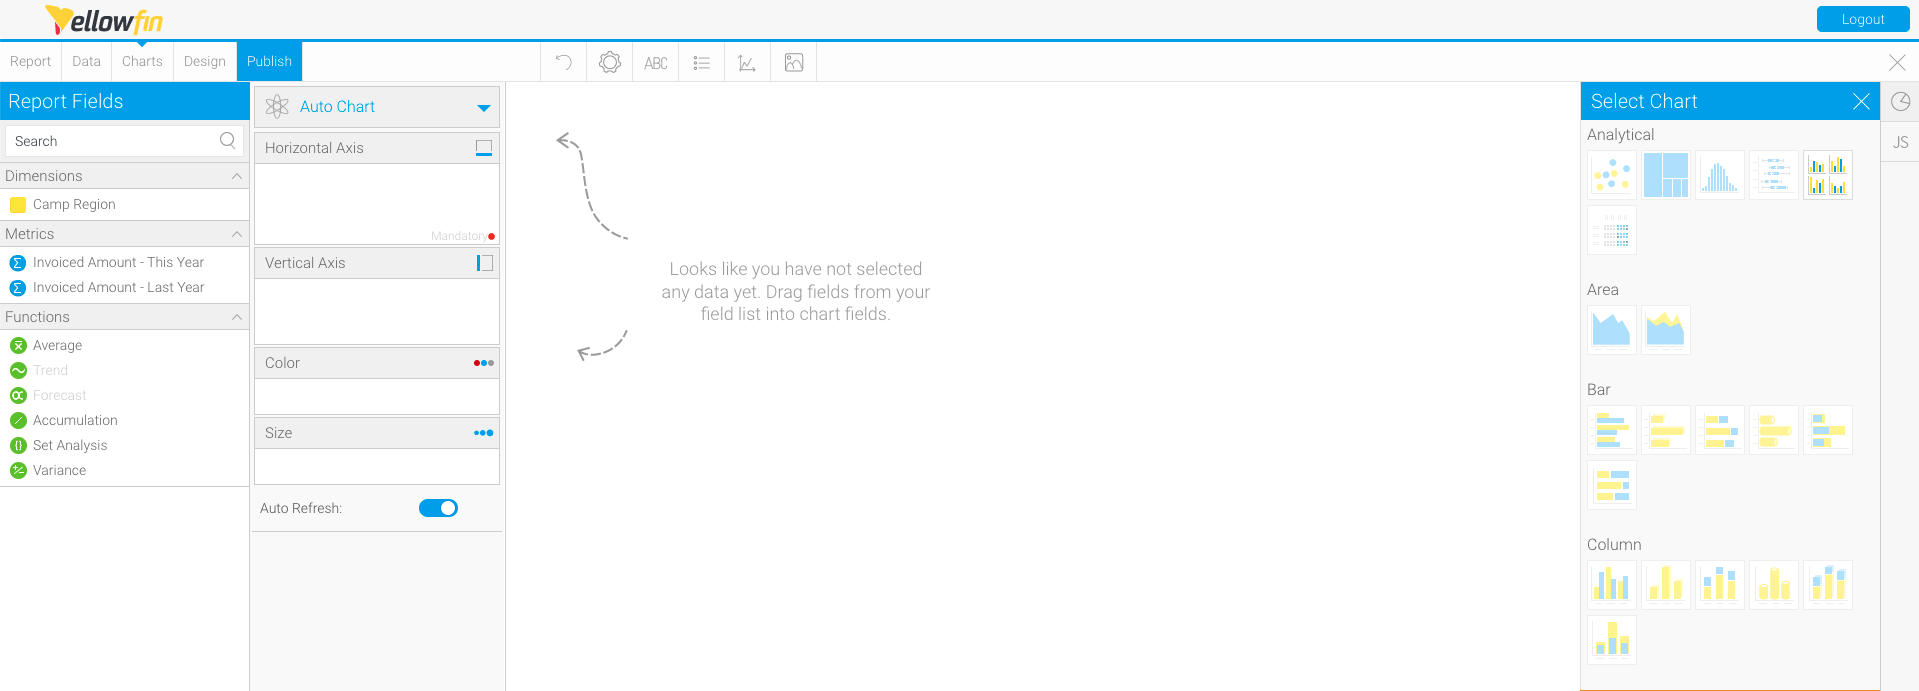
- Scroll on the Select Chart panel until you reach Special Purpose charts, and click Waterfall as the chart type
- Use your mouse to drag a dimension from the left panel to the Horizontal Axis field
- Use your mouse to drag a metric from the left panel to the Vertical Axis field
The chart will render automatically once your data is selected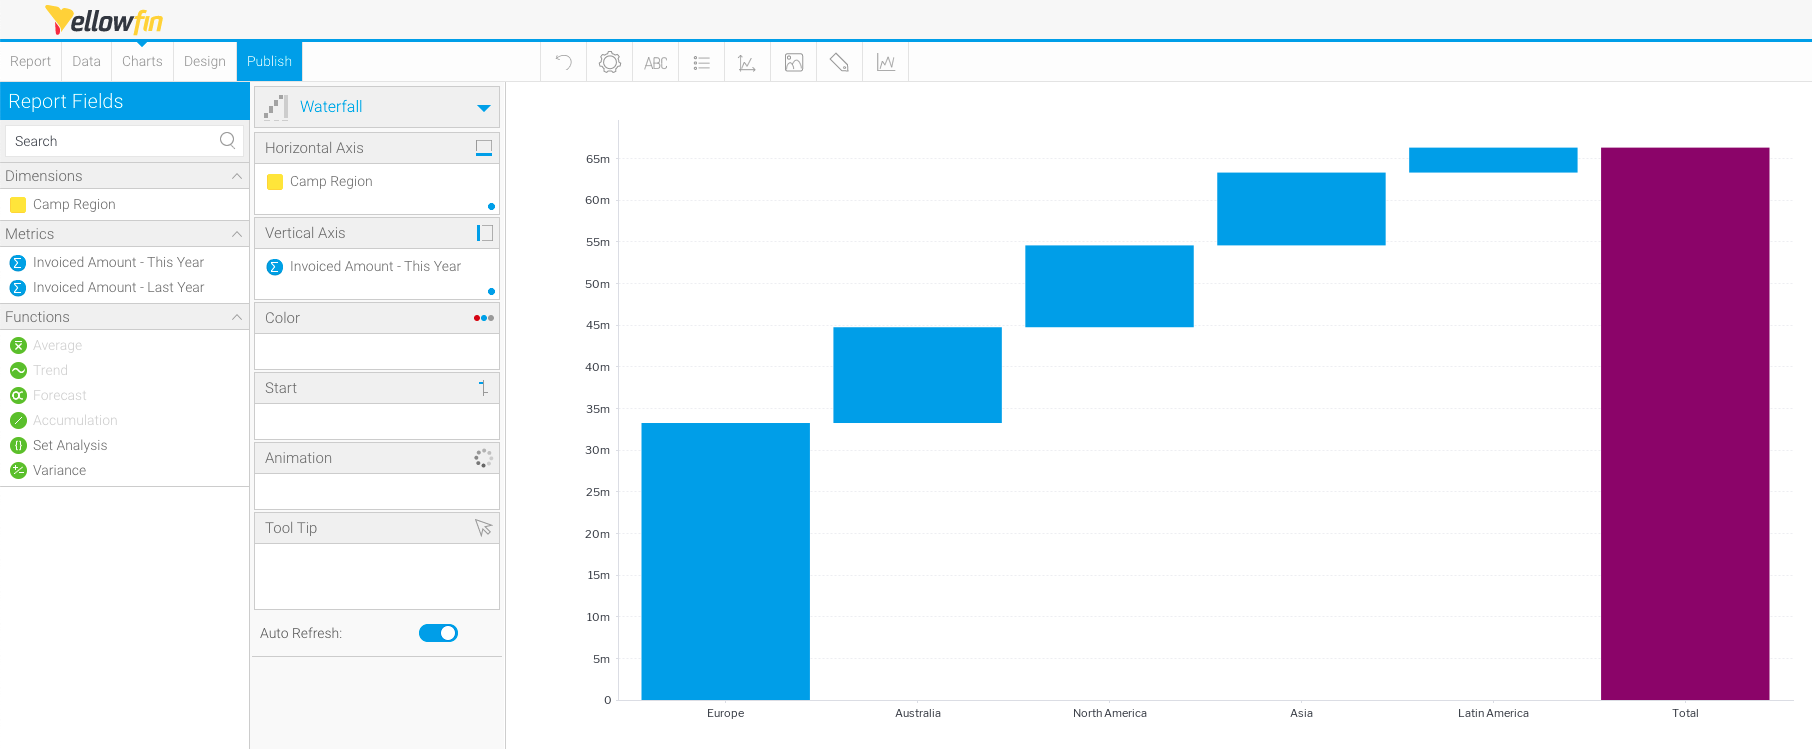
- To add a start column to the chart, use your mouse to drag a metric to the Start field
The chart will re-render automatically once your data is selected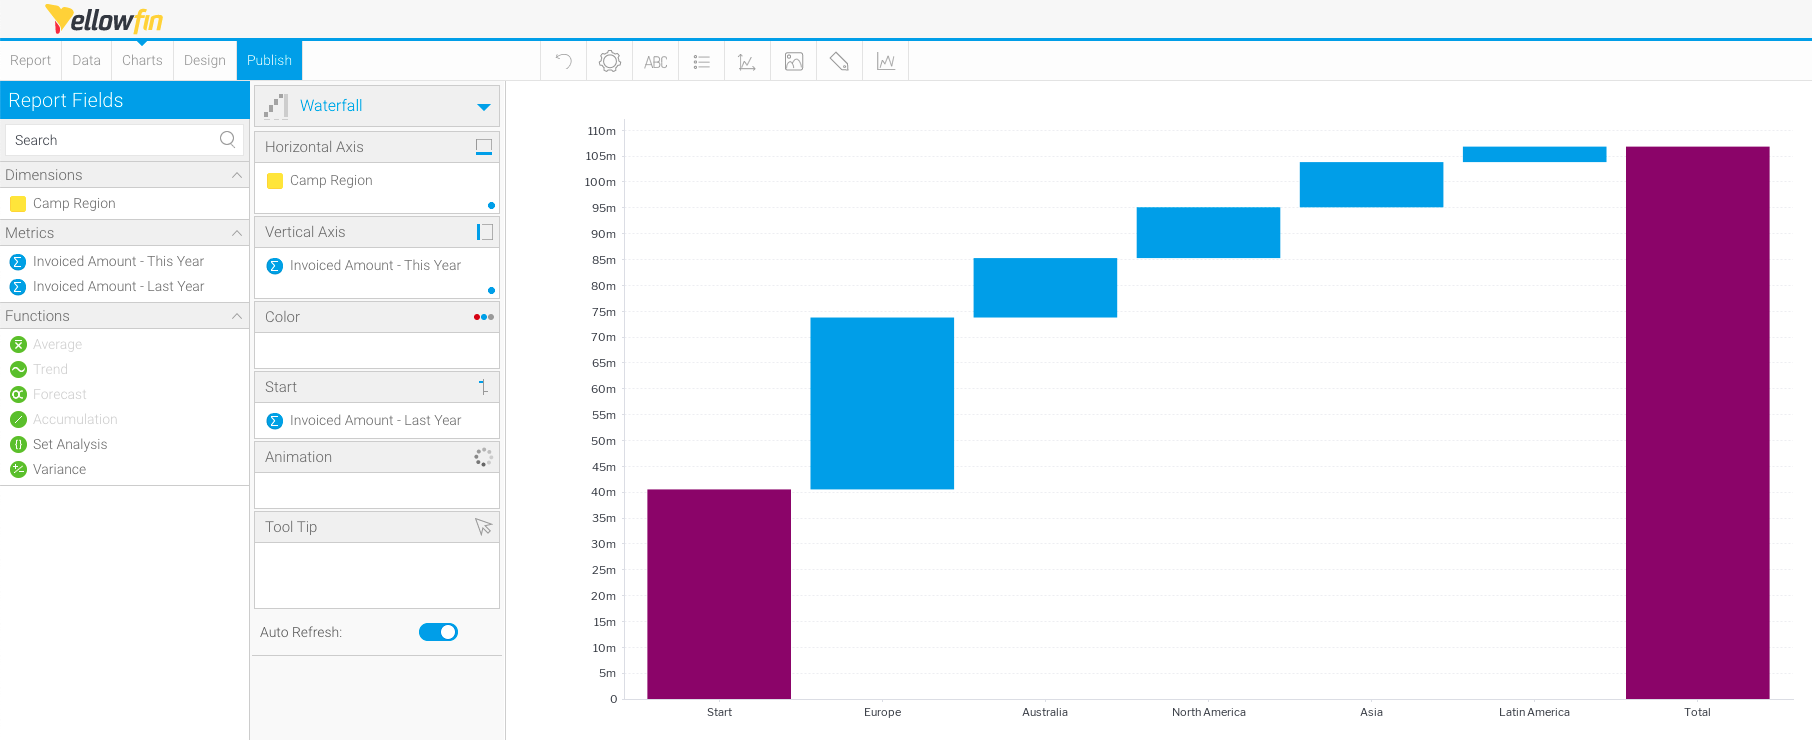
| Styleclass | ||
|---|---|---|
| ||
...