Page History
...
Useful tips
Here are a few useful things that will aid the development of JavaScript charts:
- Use the ‘debugger’ JavaScript statement to trigger a debug point for your JavaScript when needing to debug. This invokes a pause that you can safely step through with your browser’s dev console.
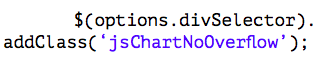
- Add the CSS class ‘jsChartNoOverflow’ Yellowfin has defined to the chart div to stop scrollbars.
E.g:
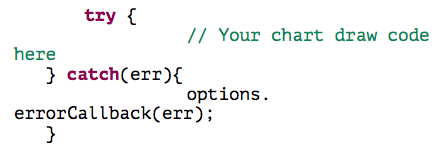
Use a try/catch block in your require statement to catch any errors and use our callback error function defined in the dataset as below so that any errors generated have the same look and feel as other chart errors. Yellowfin will also print the JavaScript error to browser console so that you can debug this.
E.g:
- If you are further processing or massaging your data and you are unsure of its current form, you can always log it into your browser’s dev console and view it. To log it, include the below in your JavaScript code:
E.g.: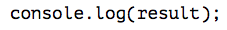
- If you are unsure what is in your current Options JSON object during the creation of JavaScript charts, you can print out the entire object into a long JSON string with:
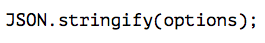
This will get logged into your browser’s dev console. You can copy the entire JSON string and view it with a JSON formatter e.g. https://jsonformatter.curiousconcept.com/
Limitations
Currently, there are a few minor JavaScript charting limitations :
JavaScript reports can be shared like any other Yellowfin content, however if broadcasting a report with JavaScript charts, note that only the report link will be shared, instead of the chart.
When exporting reports with JavaScript charts, note that these charts will not be displayed in the exported file.