Page History
...
Create a report with at least one date value.
Navigate to the chart section.
Select a chart that supports the time series. Ensure that you use the date fielda date/time field (not a plain text field that stores a date).
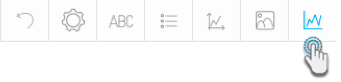
Click on the series setting button in the chart builder’s header.
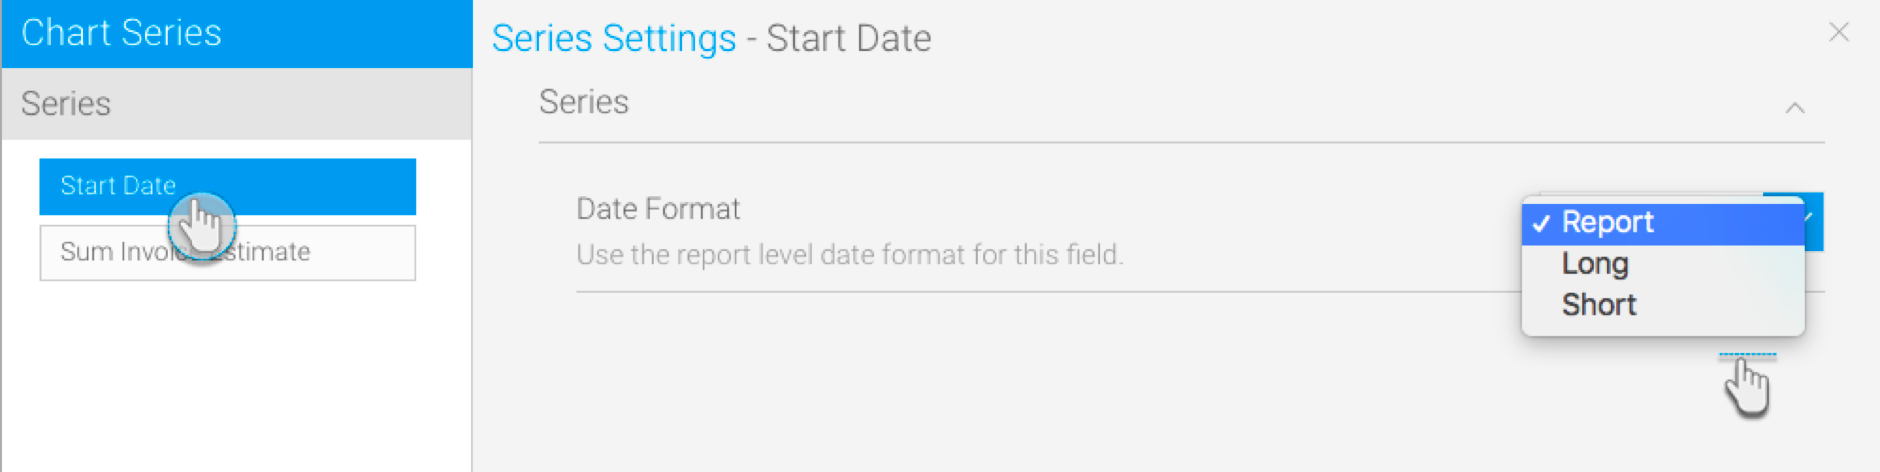
Select the date/time field from the left side panel.
Choose and apply a date format.
...
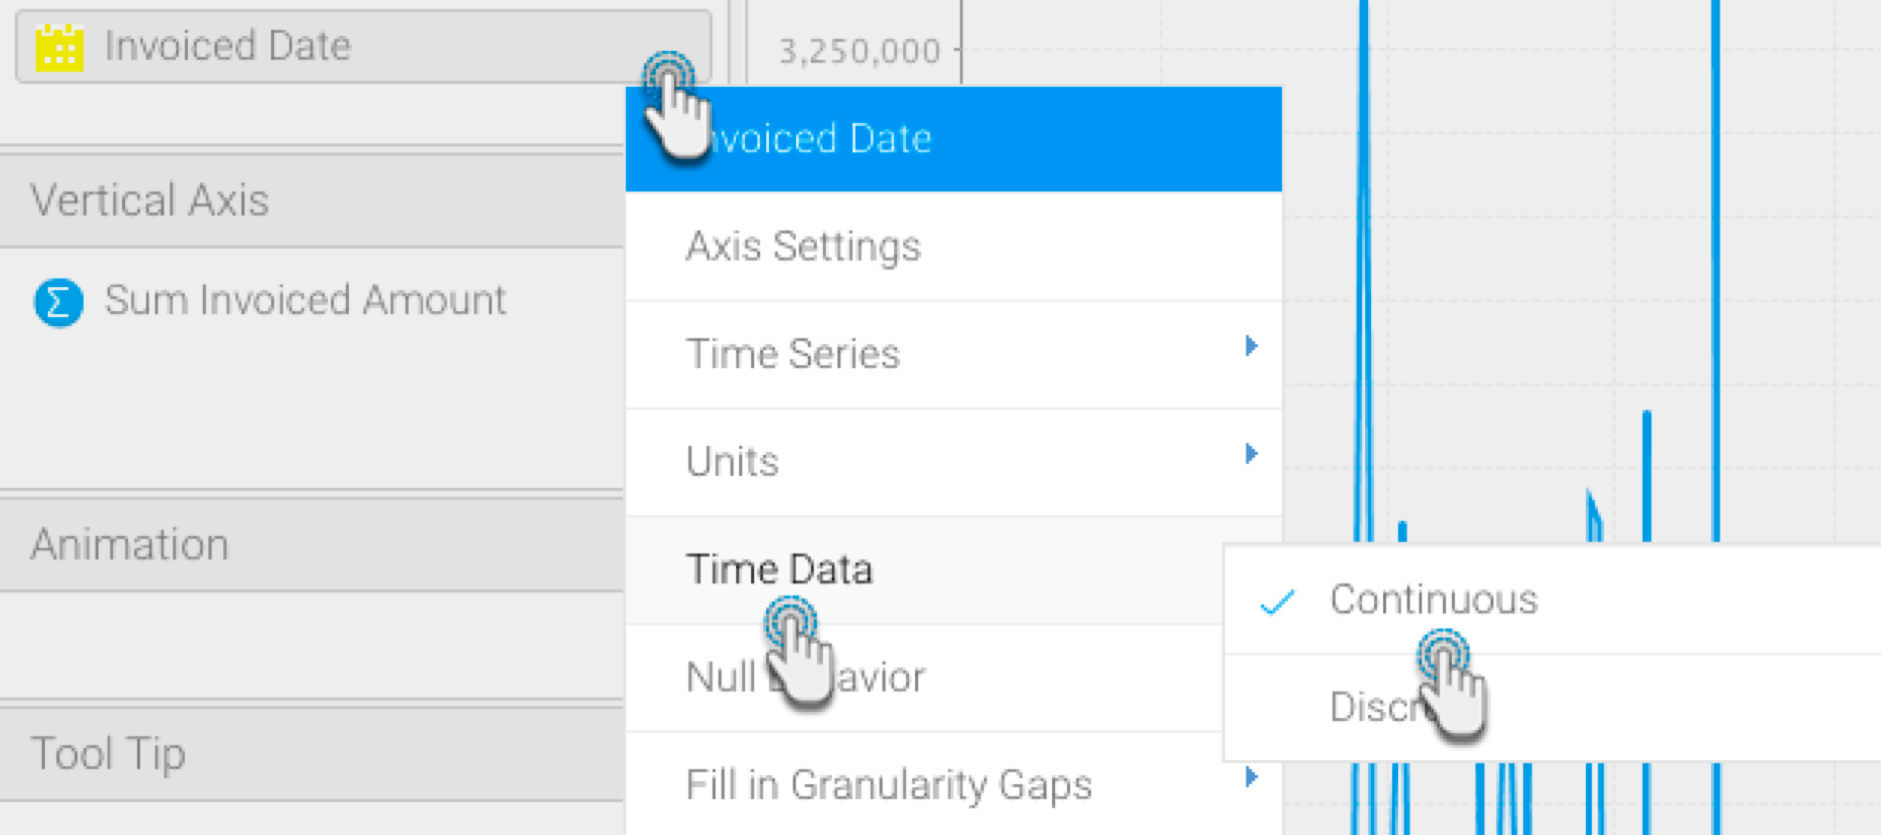
Ensure that your time series chart is set to continuous.
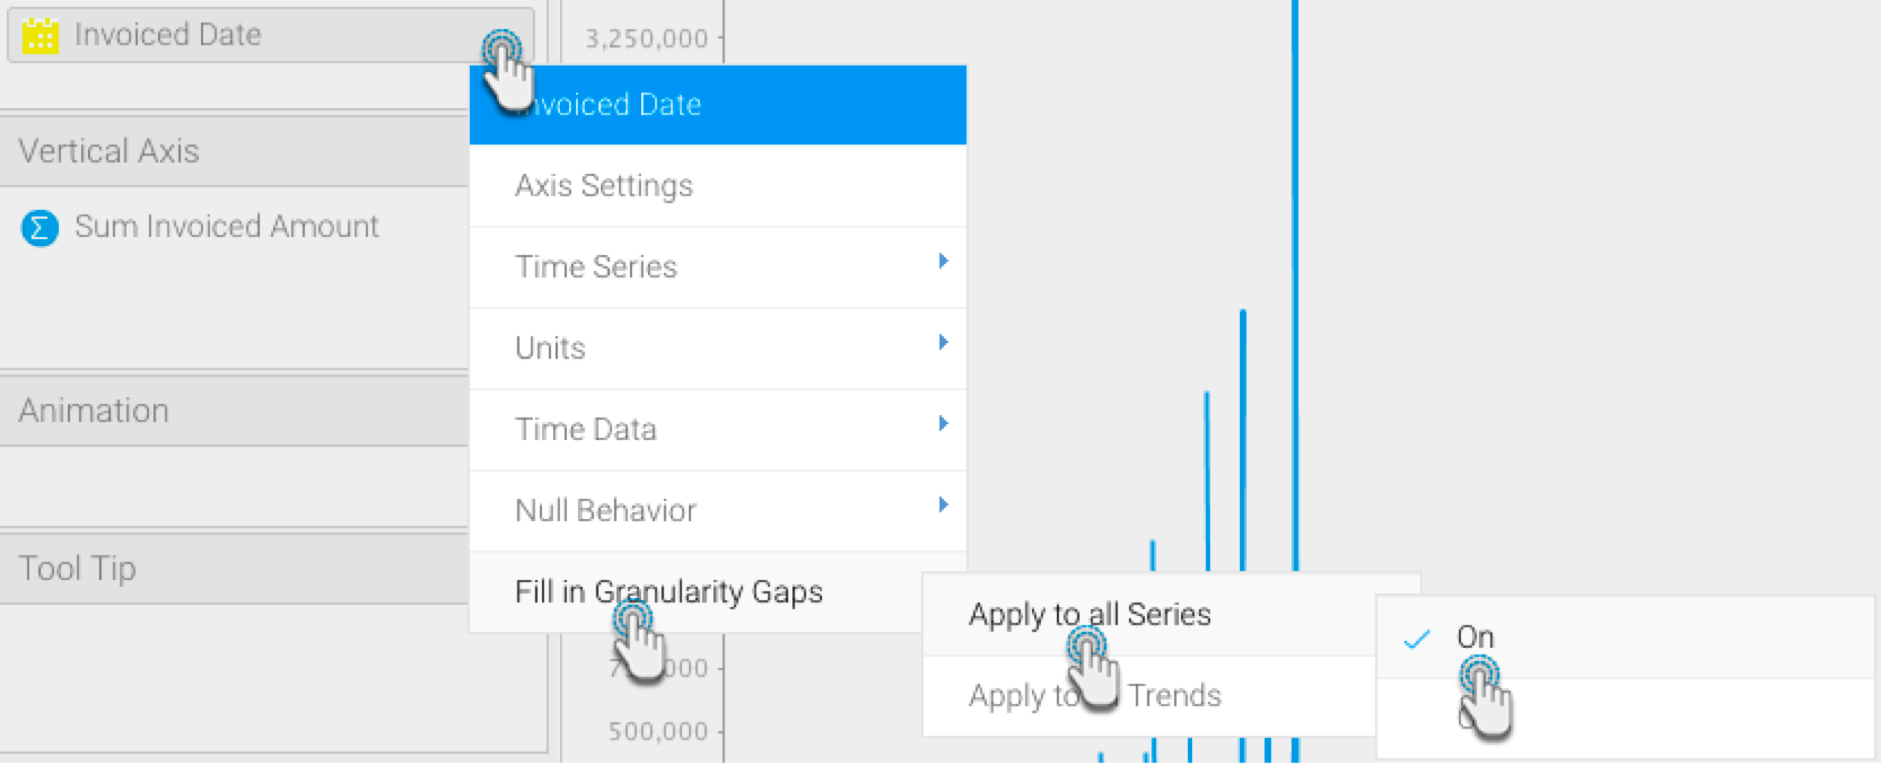
Click on the date field /time field menu arrow, and choose the Fill in Granularity Gaps option. Select Apply to all Series. Then choose On. This will enable the Null Behaviour functionality for your line chart.
Next, choose the Null Behaviour option from the date field /time field menu. Then select how you want the null values to be treated (click <here> for details on these values-link to above details)
If Break is selected, the data will not be visible.
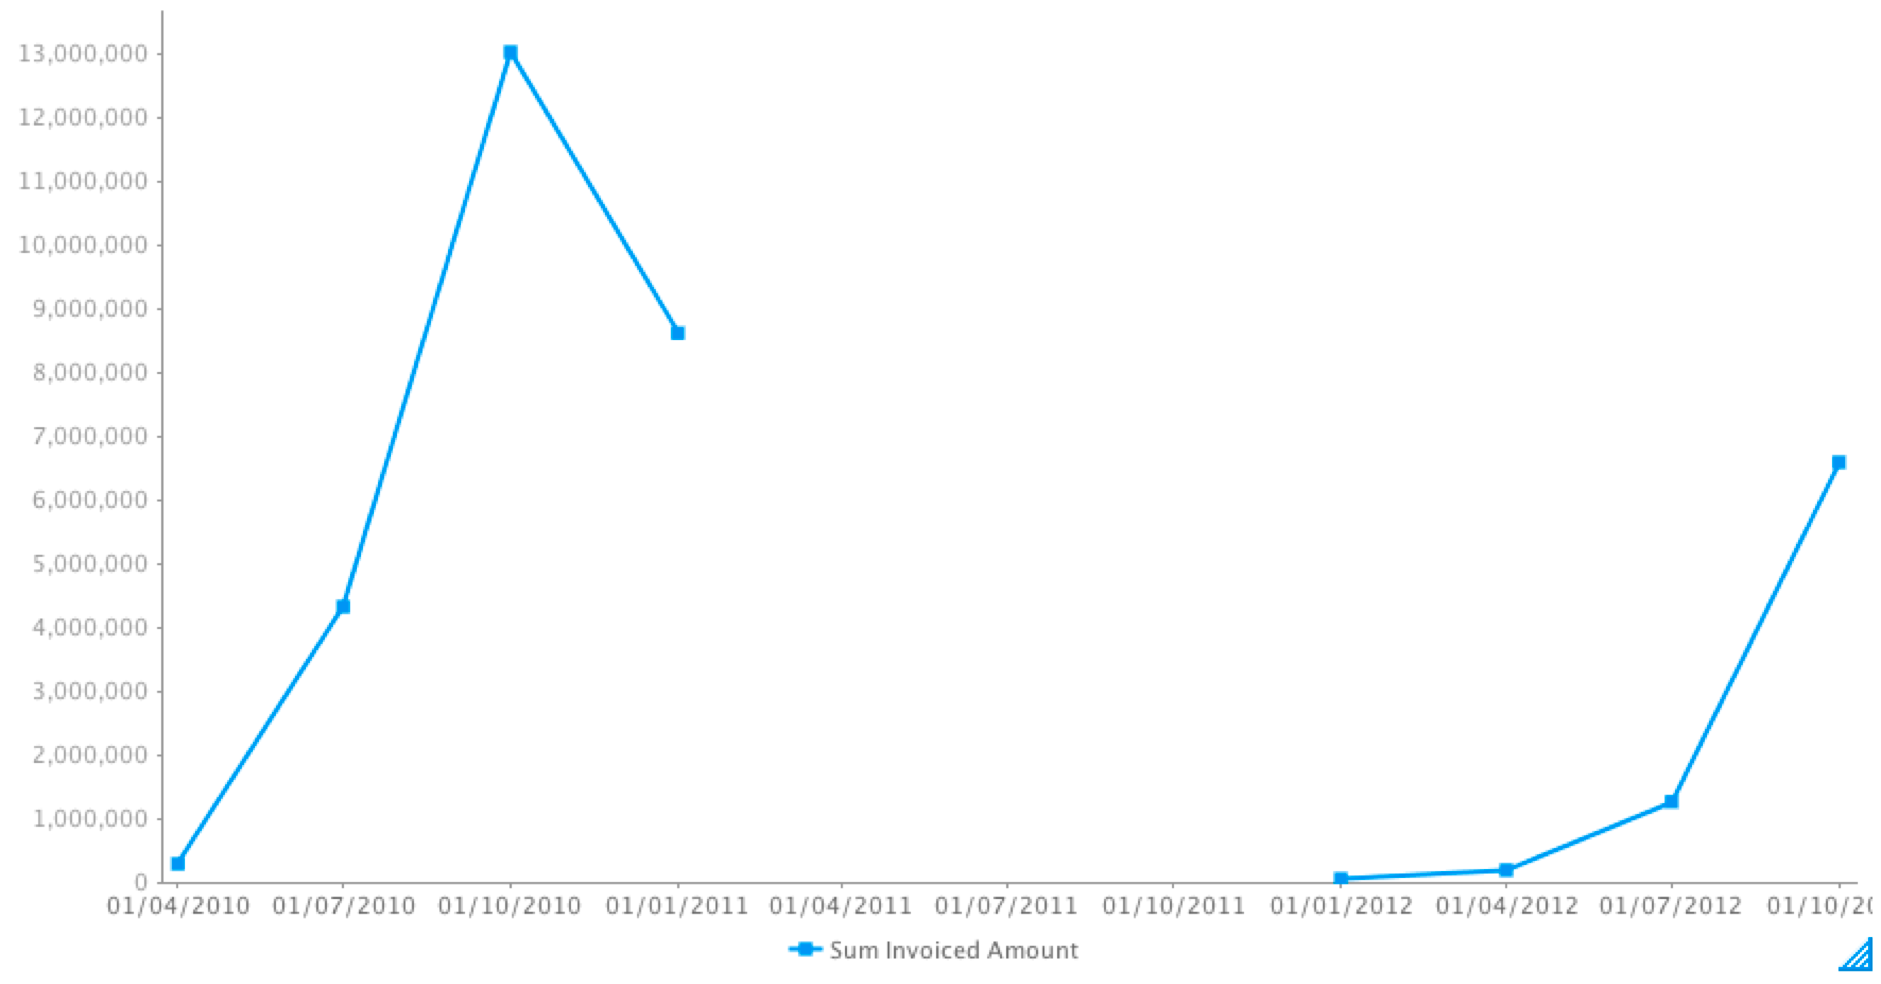
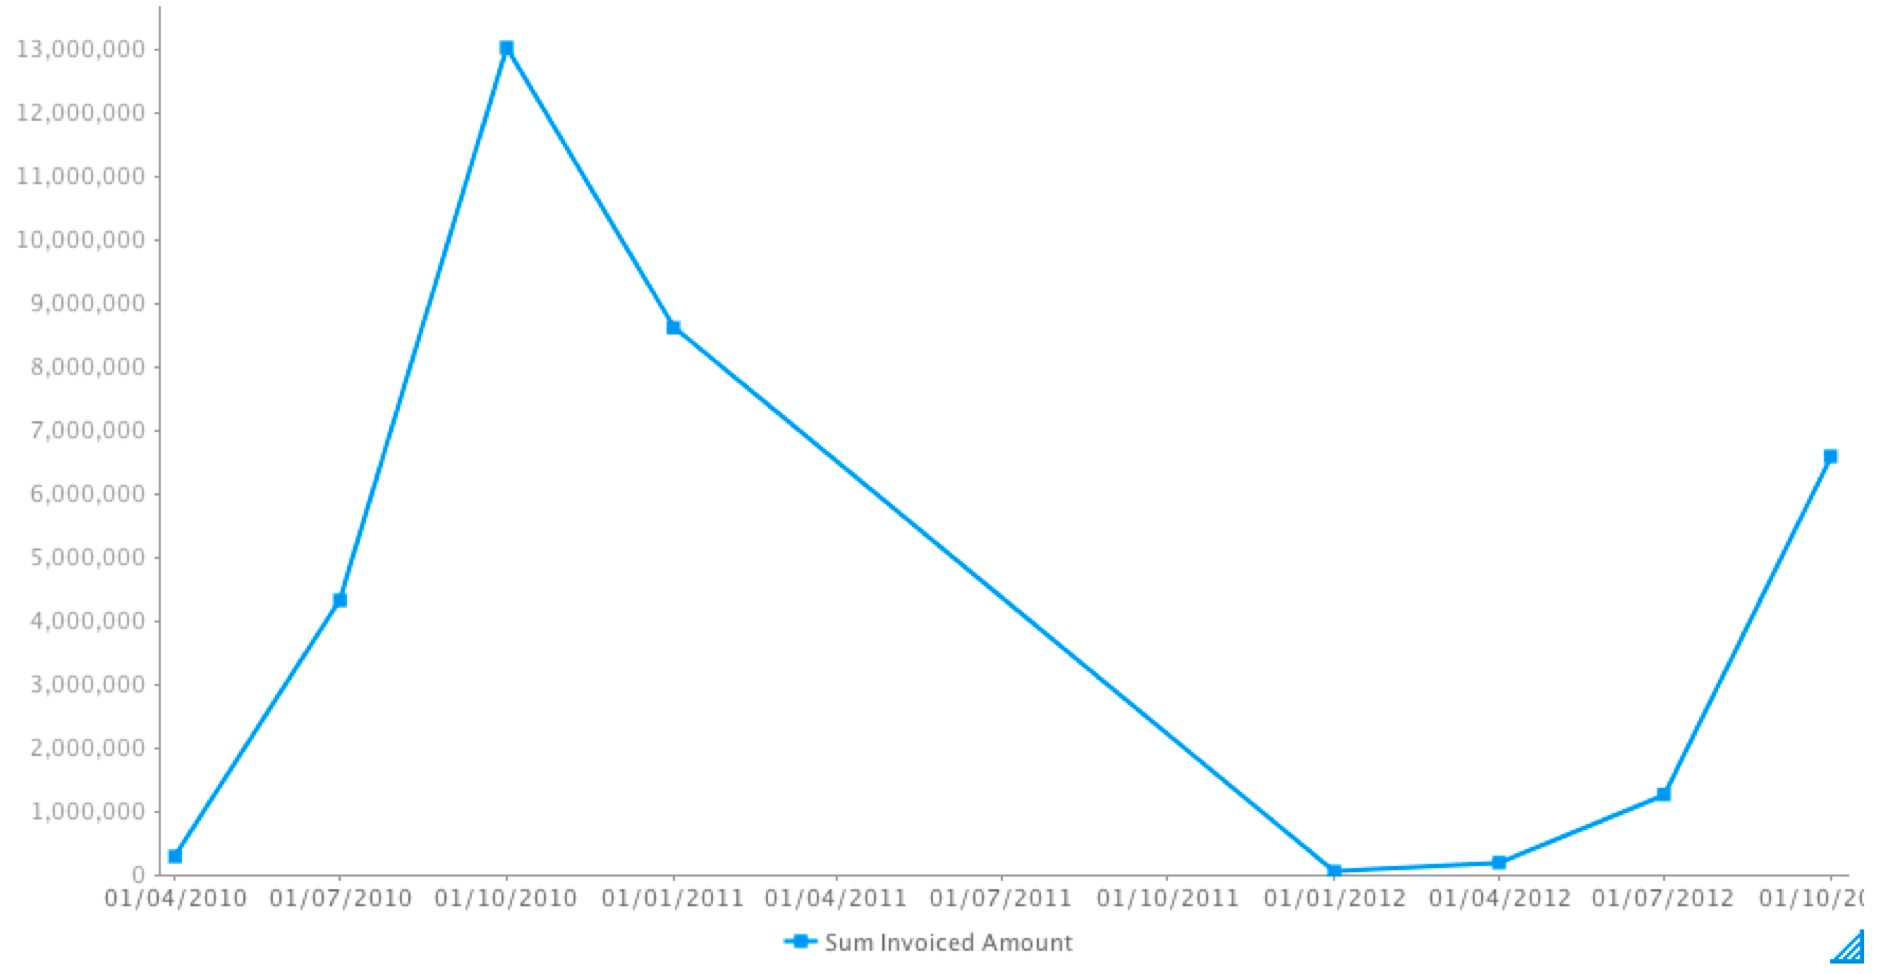
If Skip is selected, the line will be joined (this is the default behaviour of continuous time series charts).
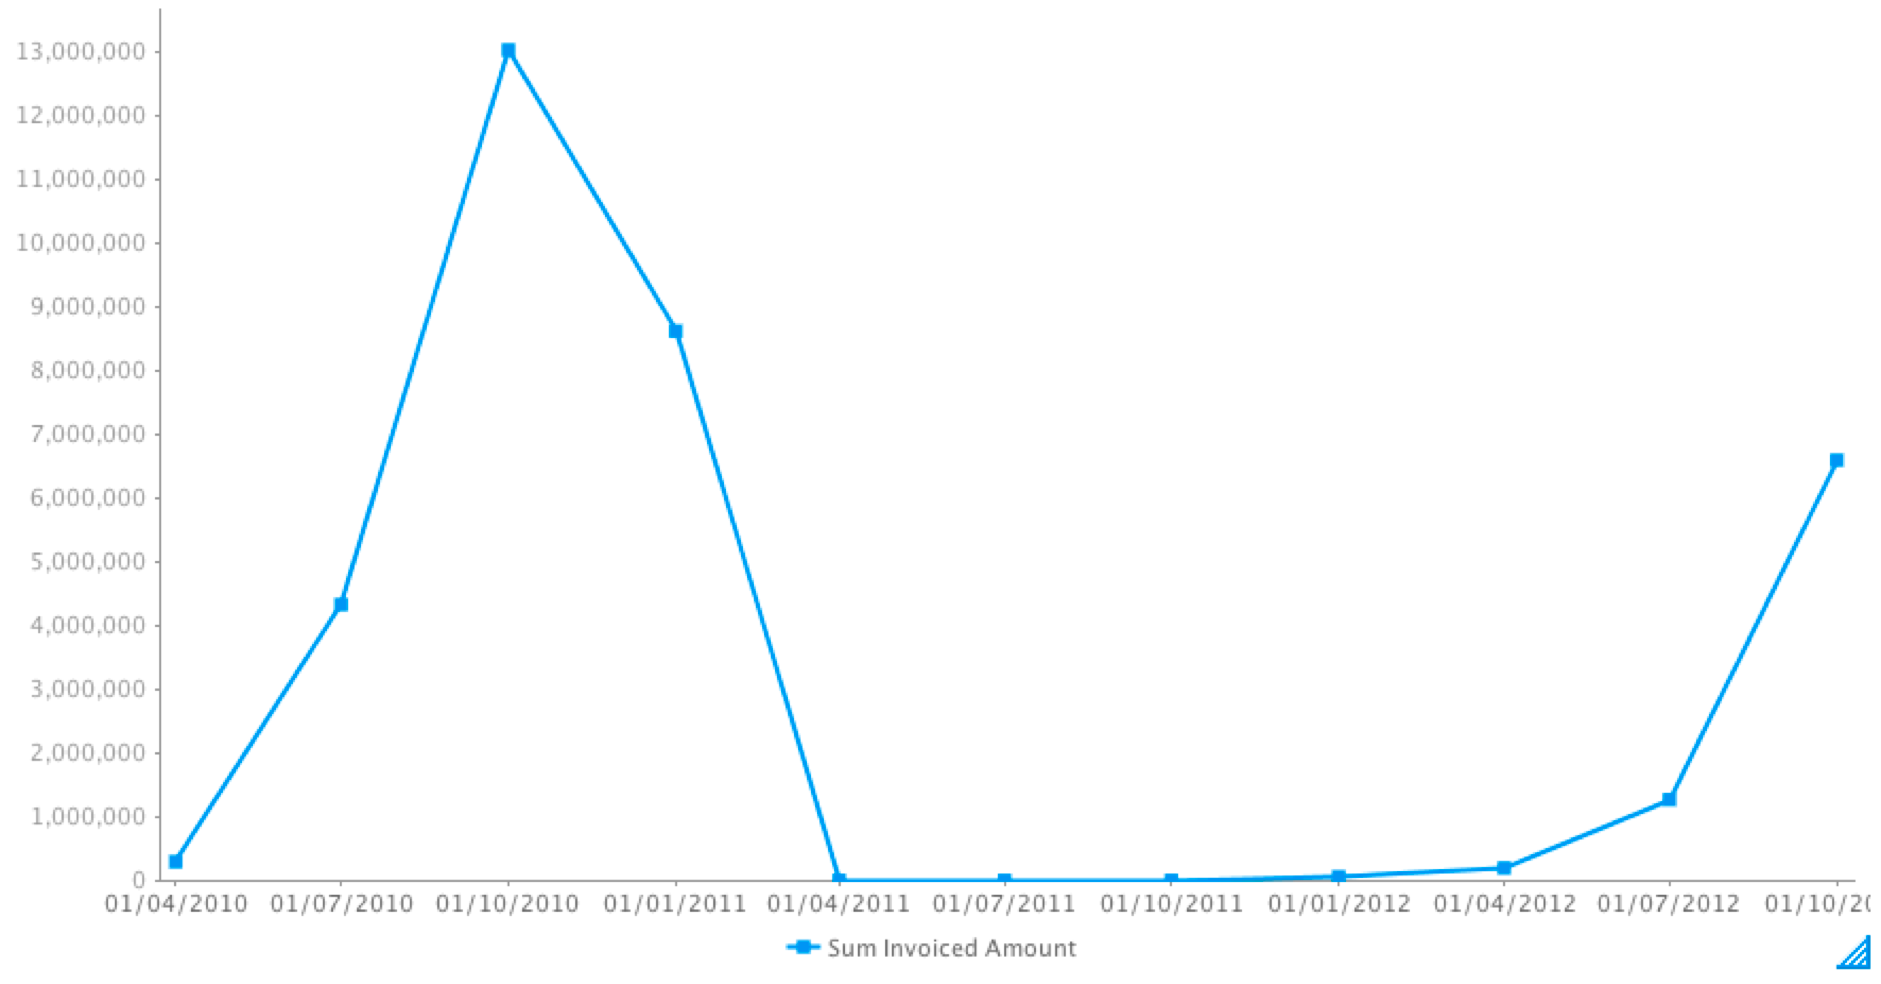
If Zero is selected, then the missing gap will be treated as zero values.
Simultaneously, you can use these settings through the chart settings option.
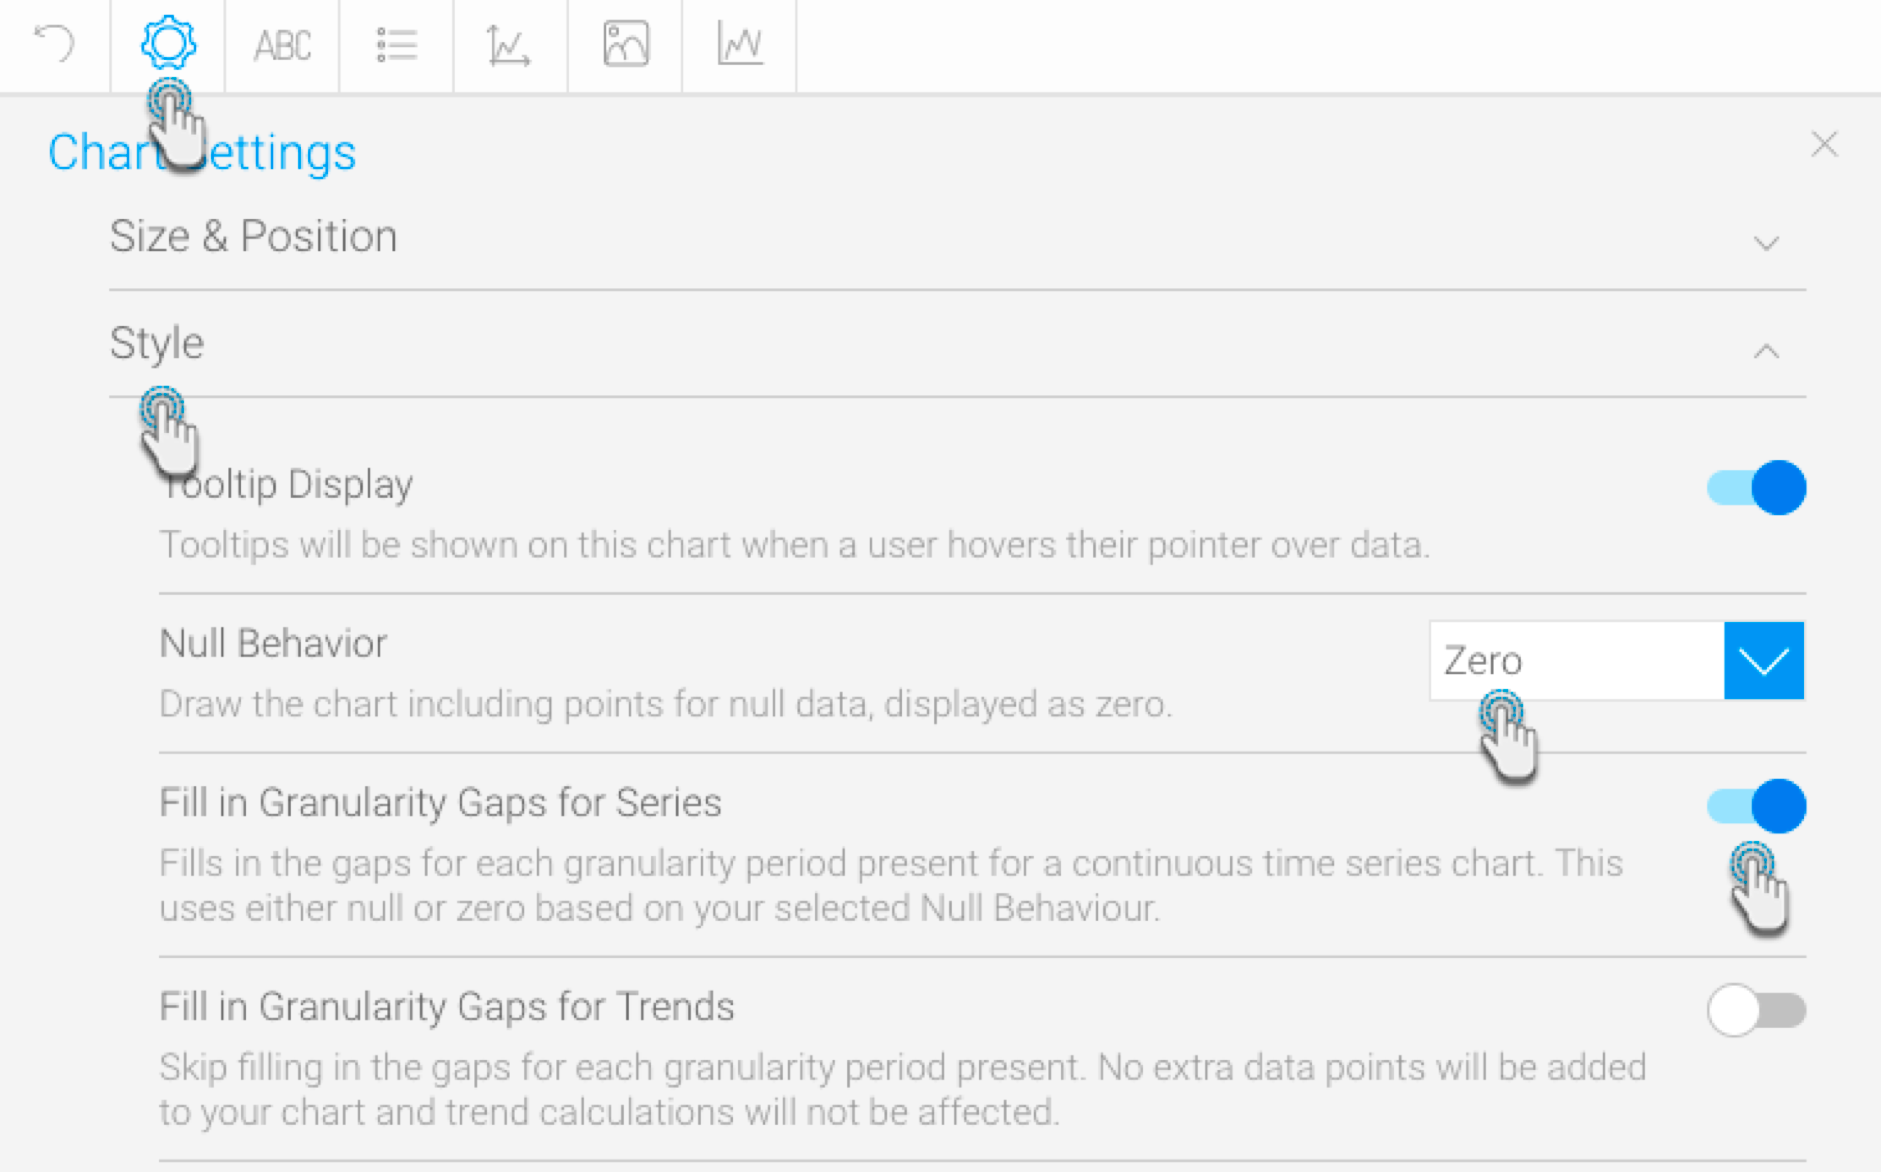
You can also apply the null behaviour to a trend line, when a Chart Function (such as Trend, Average, or Accumulation) is used. To enable this, switch on the Apply to all Trends setting from the date field’s menu (or the chart settings option).

...