Page History
...
| Table of Contents | ||
|---|---|---|
|
Overview
| Styleclass | ||
|---|---|---|
| ||
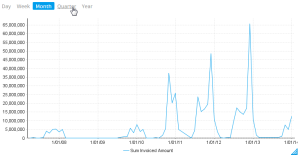
Time Series charts Time series charts show a series of data points, presented against an x axis that displays time in uniform intervals. Opposed to Unlike categorical charts, time series charts can effectively shows show gaps in the data through the use of these uniform time intervals.
| HTML |
|---|
<iframe width="700" height="394" src="https://www.youtube.com/embed/0ZAY1dZ_kdo?color=white" frameborder="0" allowfullscreen></iframe> |
Enabling this option when using a date or timestamp as a Label in a chart also provides additional functionality:
- Yearly Comparison
- Units
- Visible Unit Selection
- Date Slider
These functions are discussed below.
Using time series charts gives you access to additional features, such as yearly comparisons, unit adjustment and display options, and a date slider. These are described below.
Enable time series charts
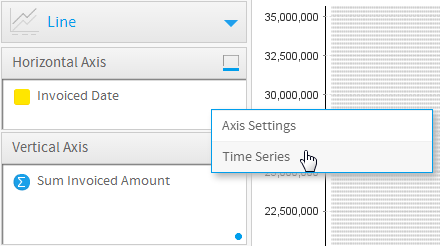
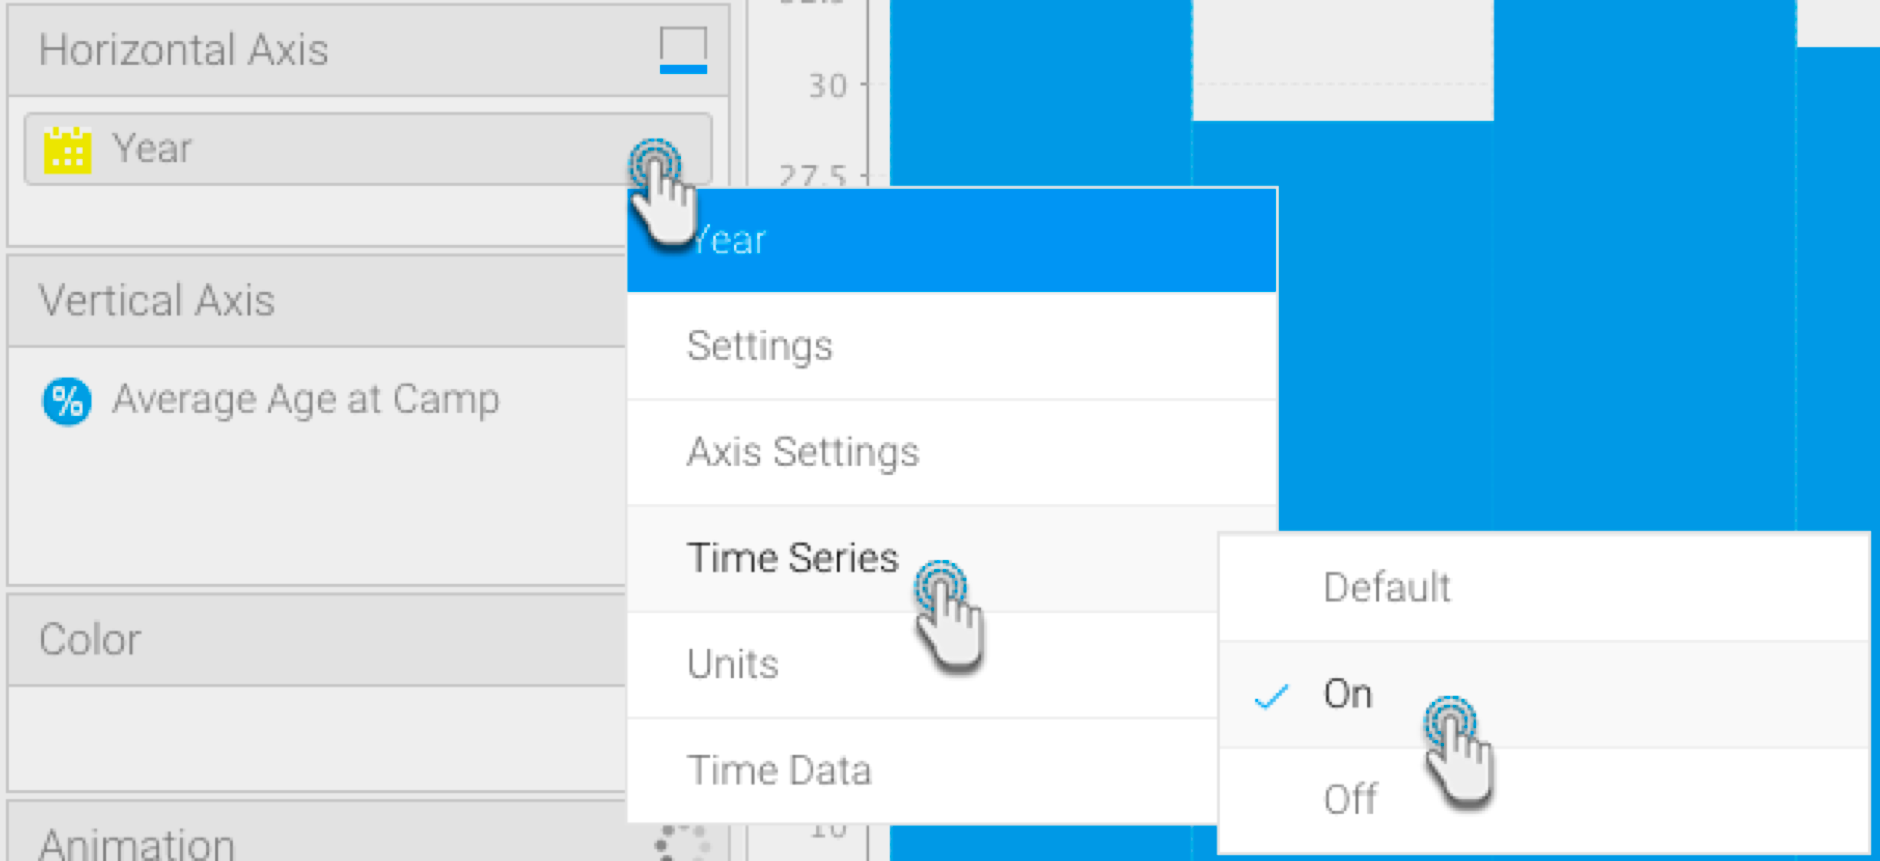
Logically, you can use time series charts only when a time/date field is available in the horizontal axis. The time series option is enabled on most chart types by default, but you can check by clicking on the triangle to the right of the date/time field, which will produce a pop-up menu.
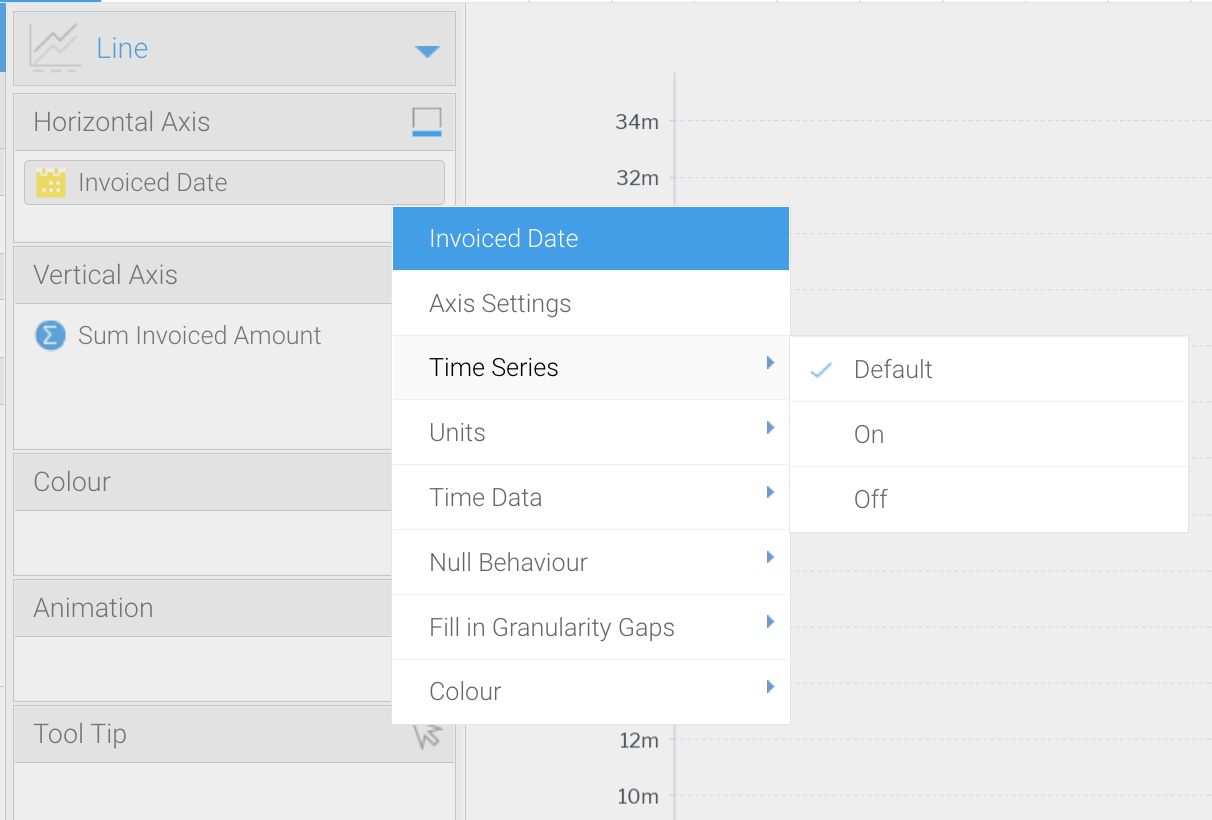
If Default shows a tick beside it, time series is already on. However, you can select On if you want to ensure it always remains on, regardless of chart type.
...
| Styleclass | ||
|---|---|---|
| ||
| Anchor | ||||
|---|---|---|---|---|
|
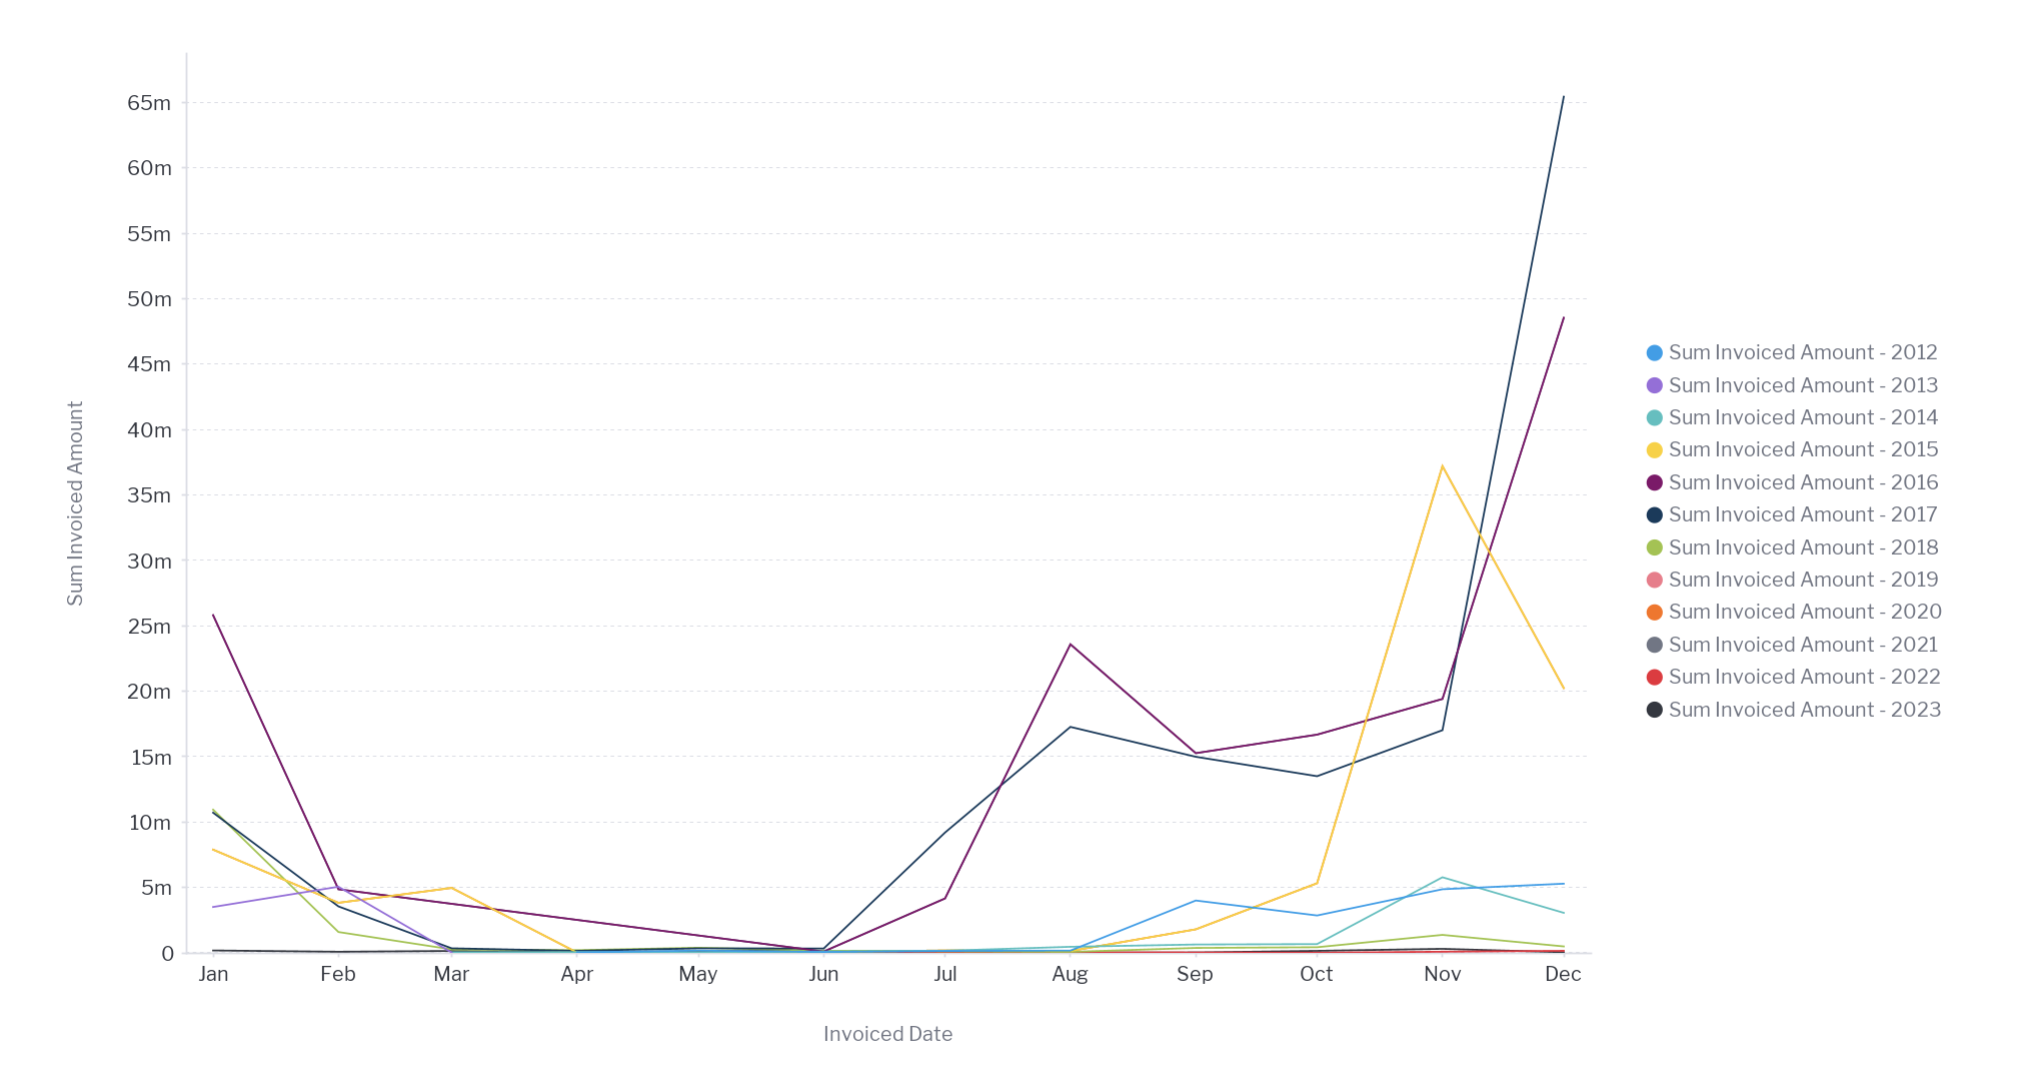
If you have a line chart which is time series spanning more than one year range, you can use this option to split the single line into 12-month groups for easy comparison. When using this option, the units are set to month and cannot be changed.
| Note |
|---|
This option won't be displayed while the Drill Down option for your report is switched on. By default, it is enabled, so you must switch it off manually in the Report Builder. |
- Using the information above, ensure that Time Series is enabled for your chart (this requires a time/date field in your X axis)
In our example, we have created a chart using the Ski Team view, with Invoiced Date in the Horizontal Axis field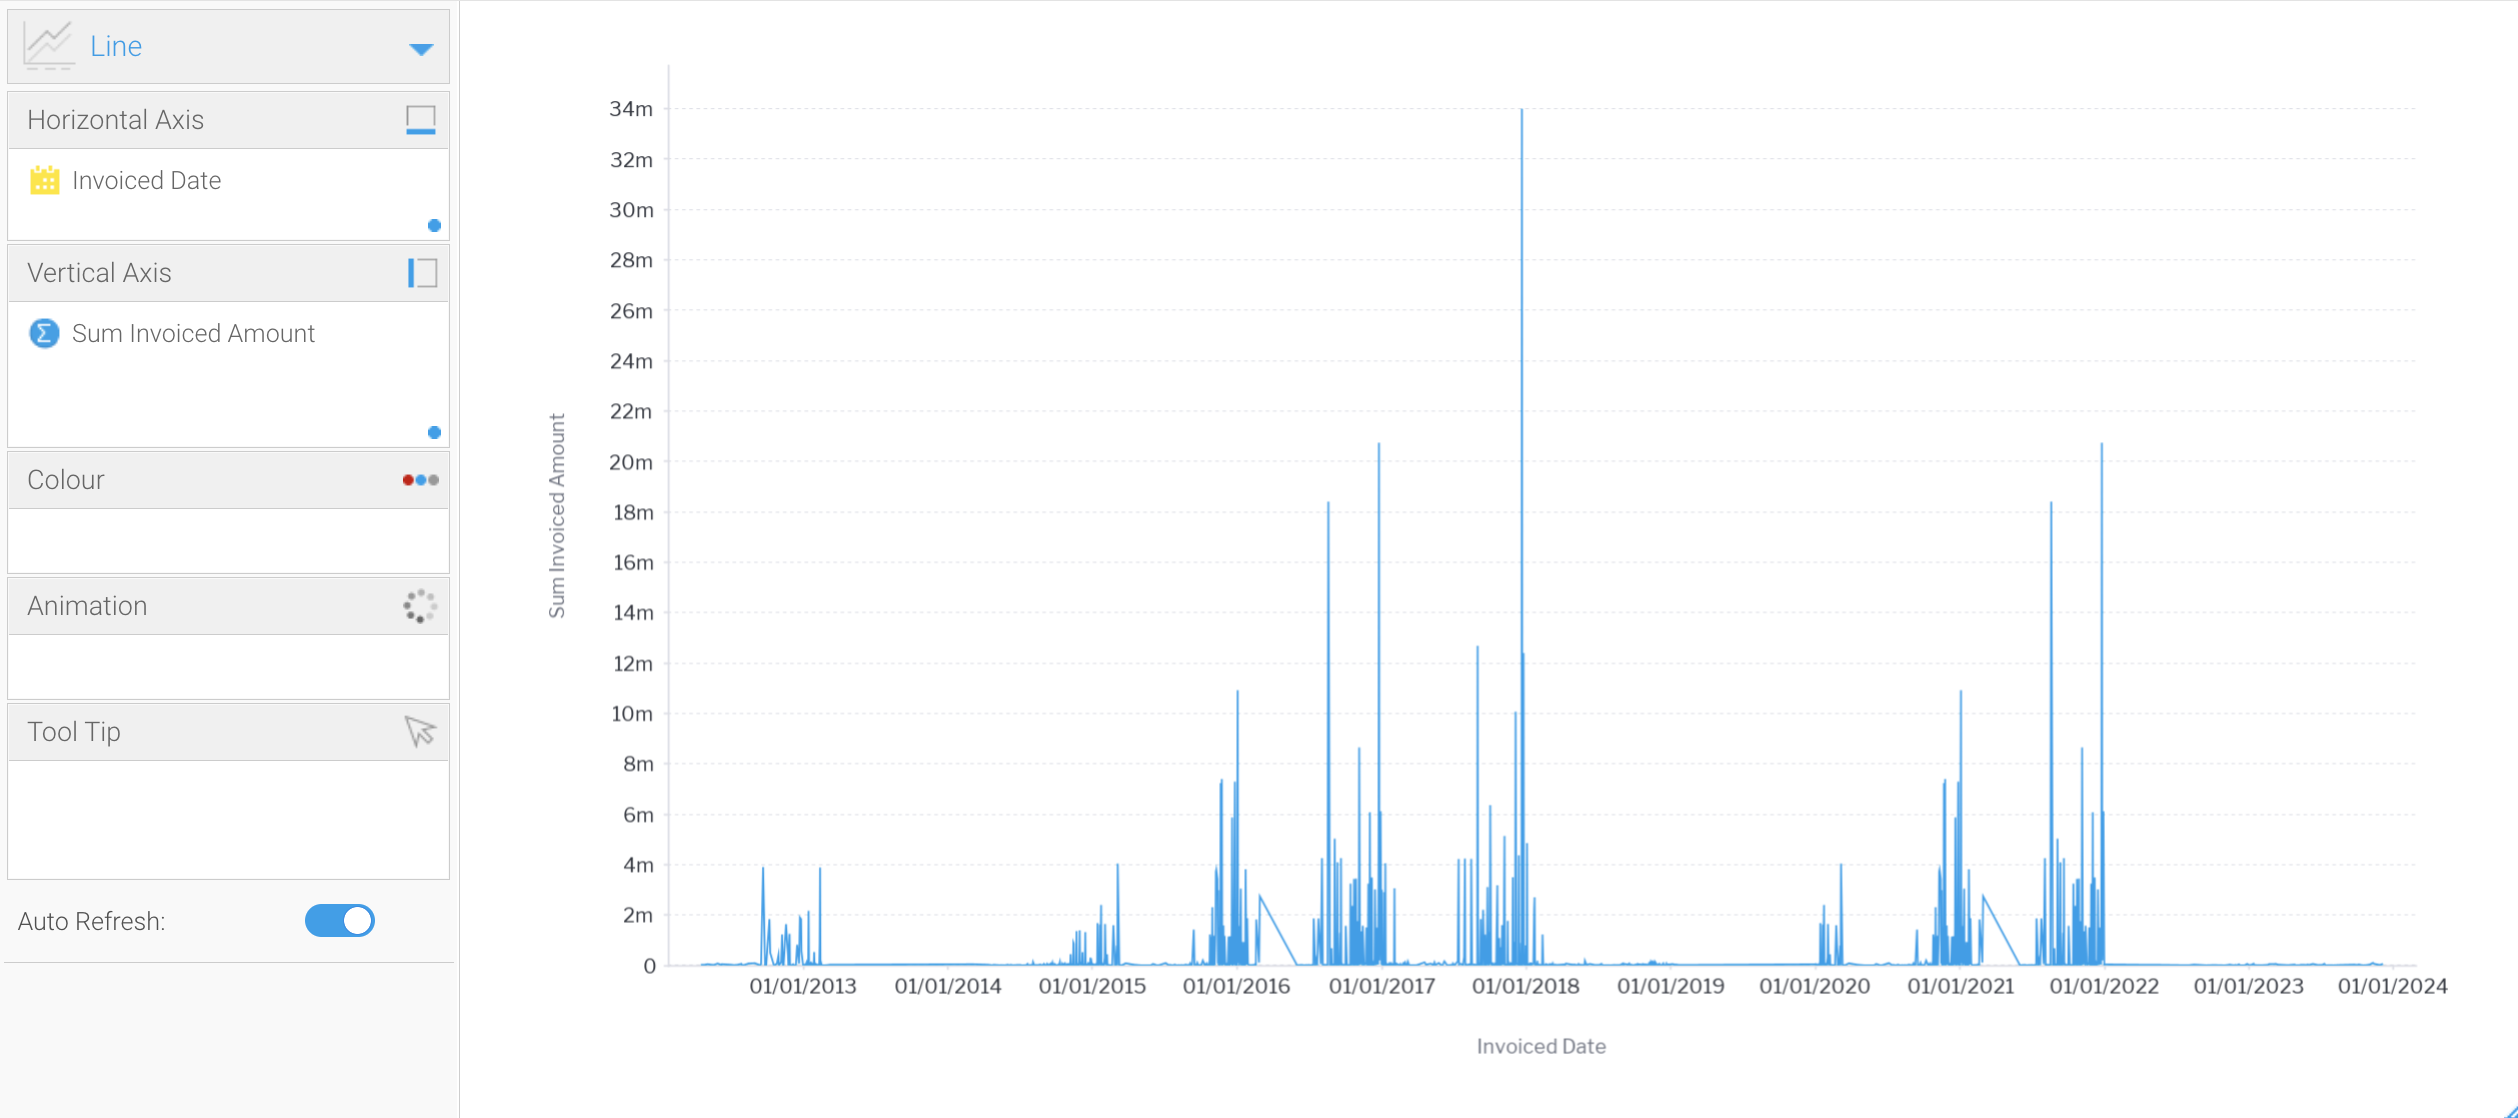
- Click on the Settings tool
 to display the Chart Settings dialog box
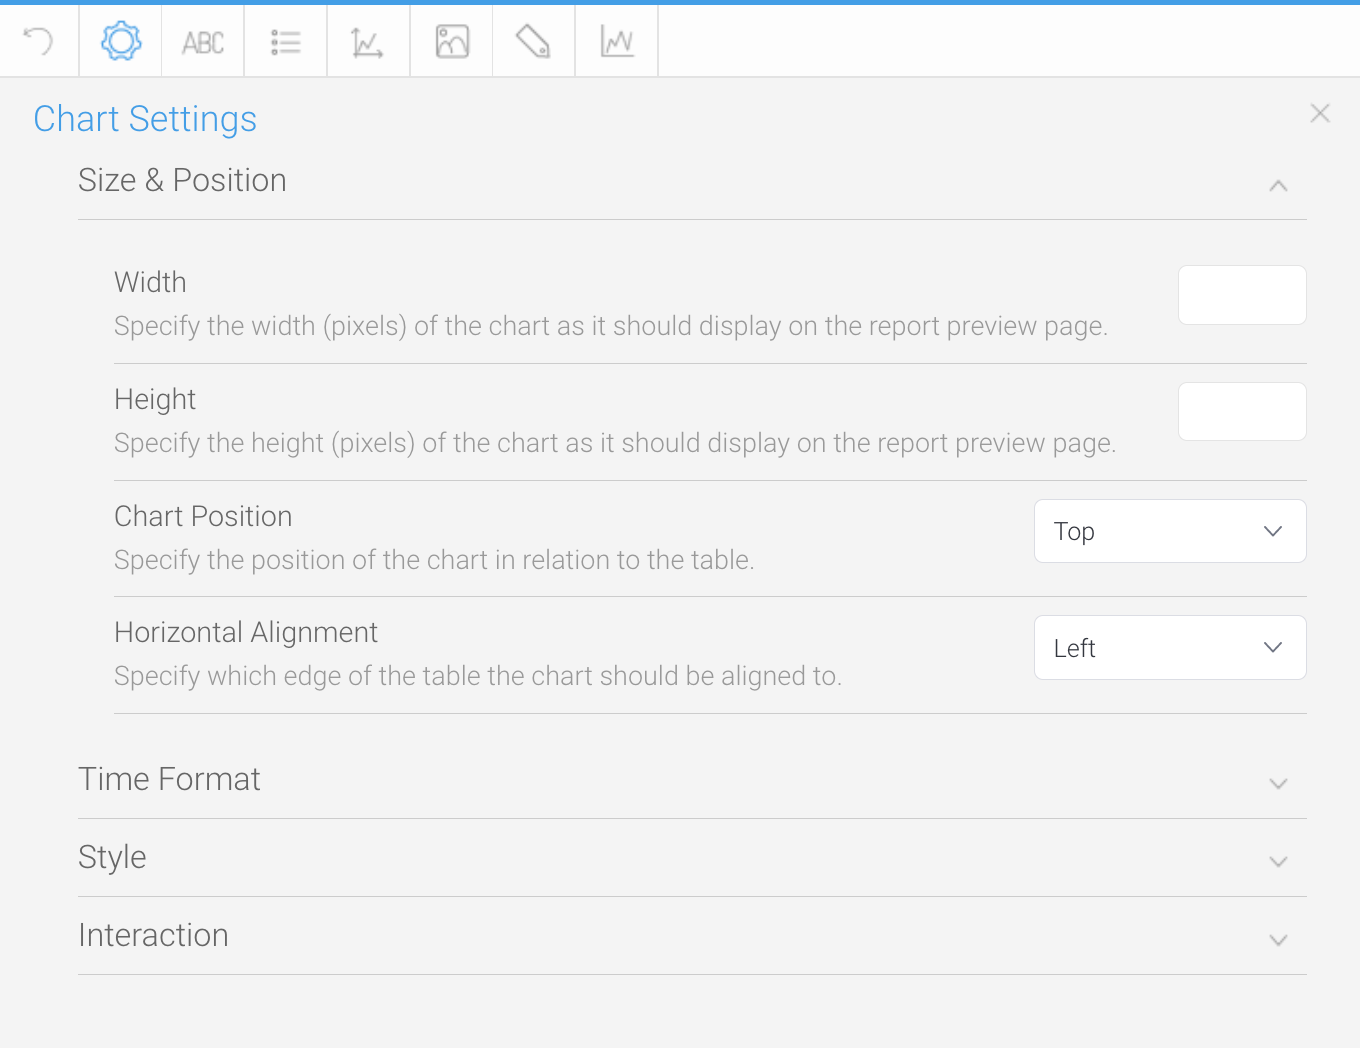
- Click on the Time Format section heading to expand it
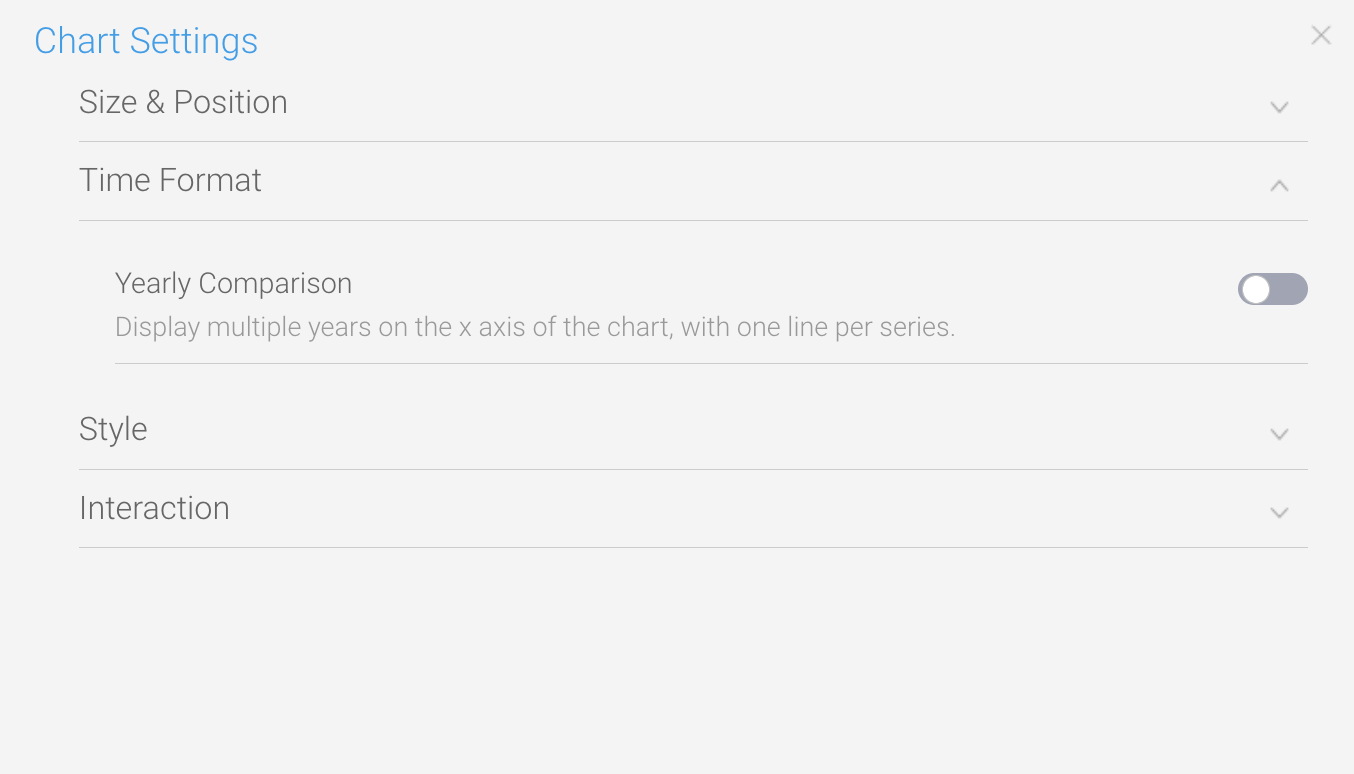
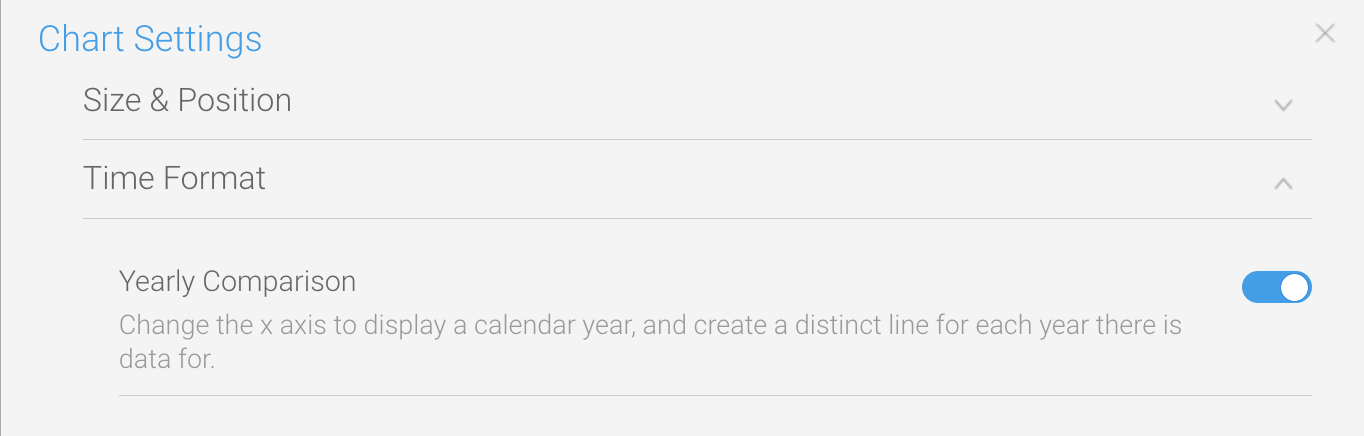
- Use the toggle for Yearly Comparison to enable the option
- Click on the Close button
 in the top right corner to close the dialog boxEnable Yearly Comparison through the chart Settings menu
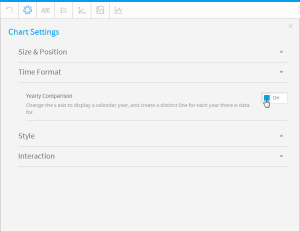
Your line chart will now appear with refresh, and year available year will appear as a seperate line for each available year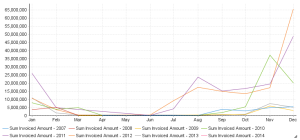
Units
| Styleclass | ||
|---|---|---|
| ||
Change chart units
Changing the chart units lets you Allows you to select the time granularity of the chart independant display independent of what the underlying table displays.
- Select the desired Units (granularity) in the chart Settings menu
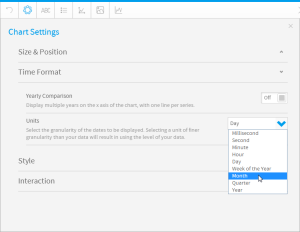
This won't alter any continuous units displayed along your horizontal access if your units. It might alter discrete units on your horizontal access.
Note that this option doesn't appear while the Yearly Comparison option is enabled.
- Ensure that Time Series is enabled for your chart (this requires a time/date field in your X axis)
In our example, we have created a chart using the Ski Team view, with Invoiced Date in the Horizontal Axis field - Ensure that the Yearly Comparison option is toggled off (use the steps from the previous section if you need to check)
- Click on the small blue triangle next to your date/time field to display the pop-up menu, then move your mouse to the Units option to display a sub-menu

- Click on any of the unticked options and check your chart to see how it is altered (the bigger the difference between granularity, the more obvious the change will be)
...
| Styleclass | ||
|---|---|---|
| ||
Allows the user select the time granularity of the chart independant of the table.
- Enable the Visible Unit Selection option through the chart Settings menu
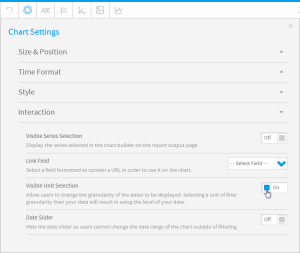
- Your chart will now have a list of available units for the user to select from
Enable visible unit selection
The Visible User Selection options lets you change the time granularity on published charts without any affect on the underlying data. This gives end users more flexibility in what they can see in chart vizualisations.
Note that this option will not be available if the Yearly Comparison option is enabled. See the Yearly Comparison section above for details on where to locate this option.
- Using the information above, ensure that Time Series is enabled for your chart (this requires a time/date field in your X axis)
In our example, we have created a chart using the Ski Team view, with Invoiced Date in the Horizontal Axis field - Click on the Settings tool to display the Chart Settings dialog box
- Click on the Interaction section heading to expand it
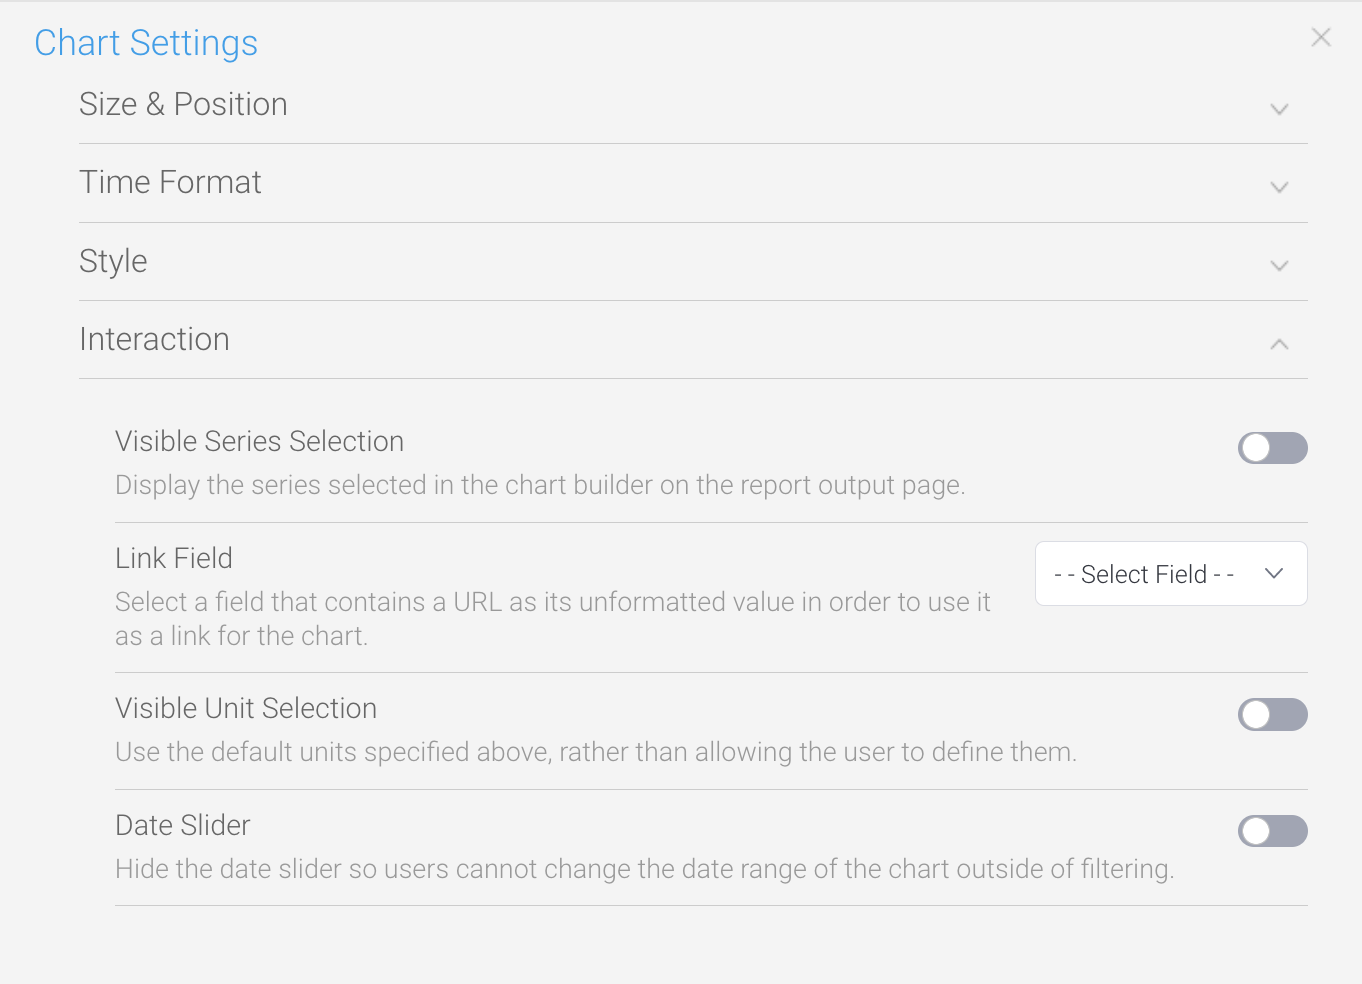
- Click on the toggle for Visible Unit Selection to enabled it
- Click on the Close button in the top right corner to close the dialog box
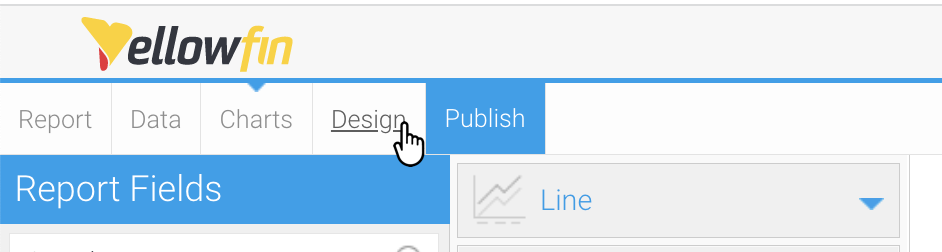
To see the new option, let's preview the chart - Click on the Design tab in the top left corner of the page
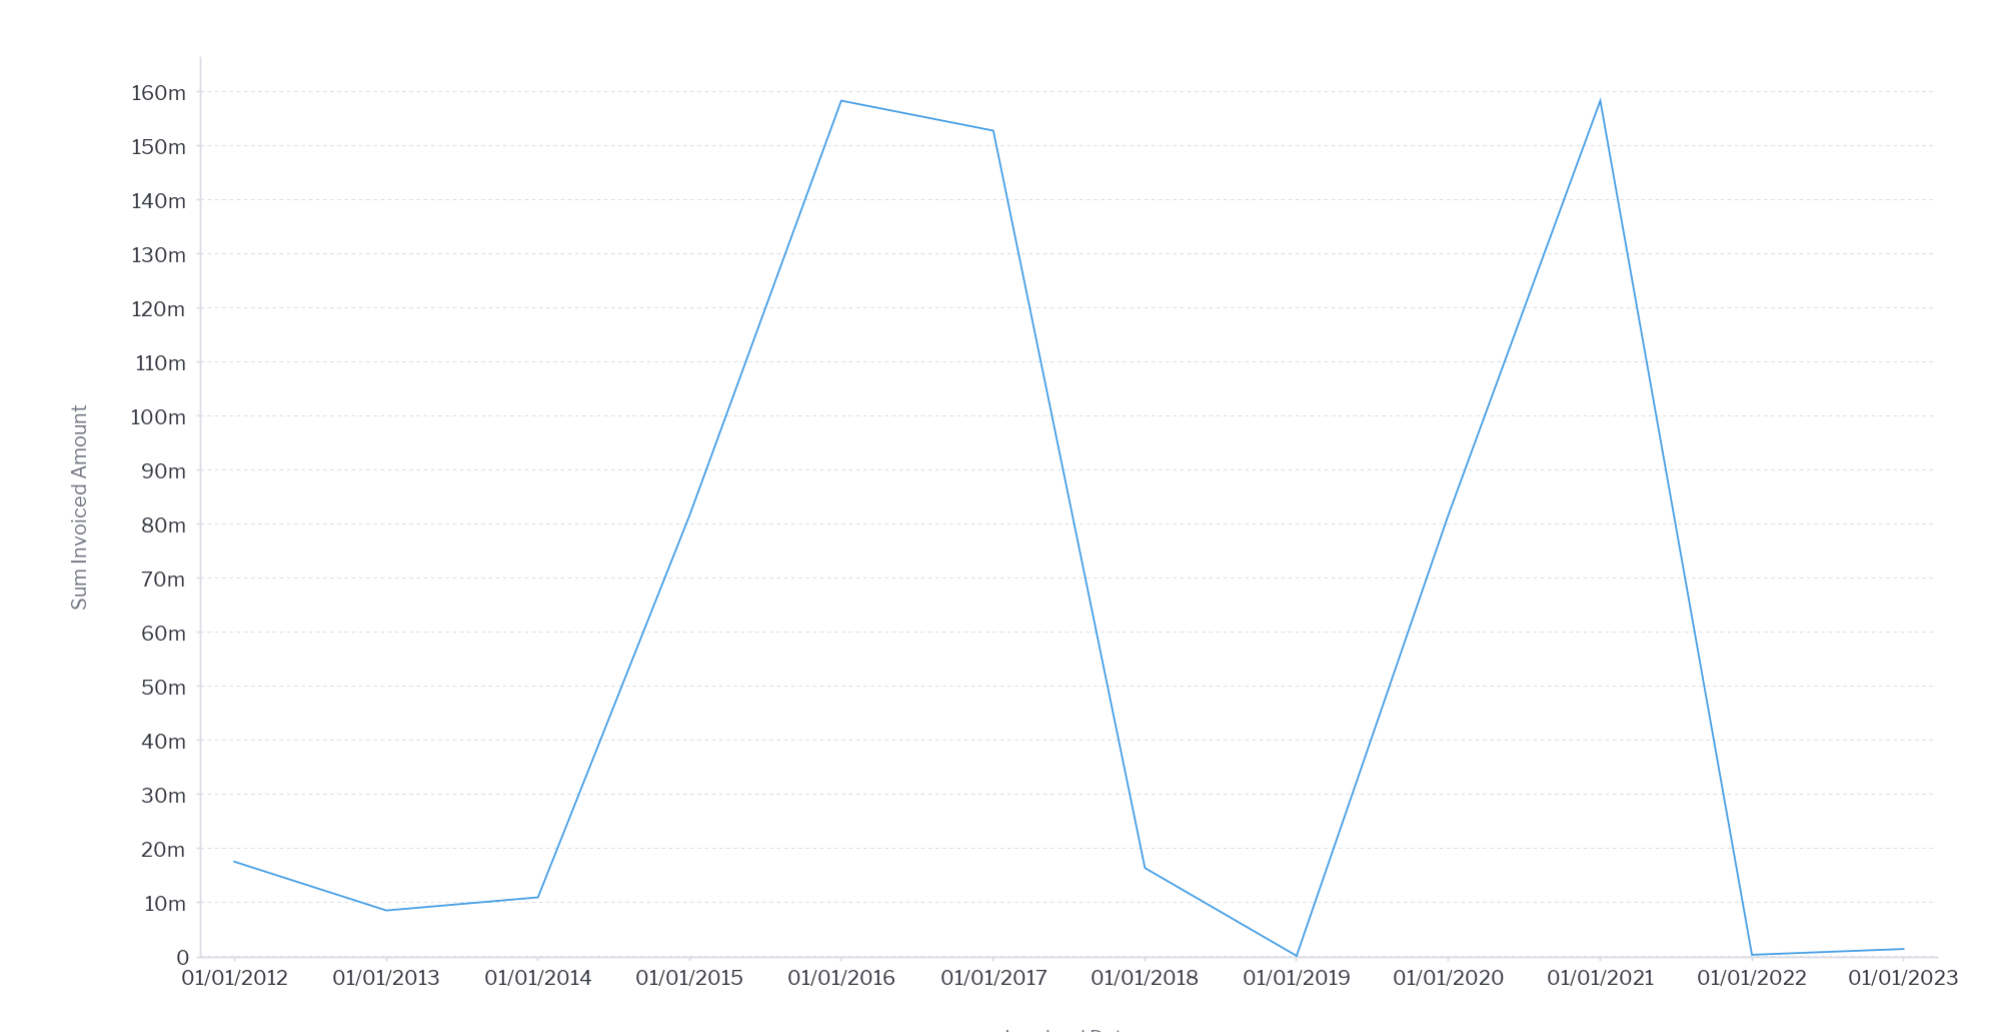
Your chart will now display a list of available units in the top left corner for the user to select
- Click on the different options to get a feel for how the unit selector works
- Click on the Charts tab in the top left corner of your screen to return to the Chart Builder
...
| Styleclass | ||
|---|---|---|
| ||
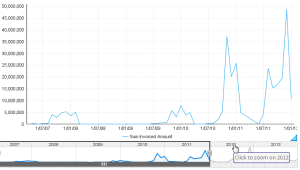
Date Slider
A date slider lets you Allows the user to zoom in and out of time-banded data.
| HTML |
|---|
<iframe width="700" height="394" src="https://www.youtube.com/embed/-l7KRn7P2Q4?color=white" frameborder="0" allowfullscreen></iframe> |
- Enable the Date Slider option through the chart Settings menu
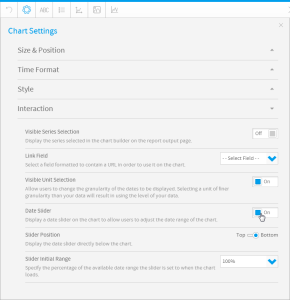
- Your chart will now have a slider the user can manipulate to view subsets of the data
Date Format Options
data on published charts. This option won't affect the underlying chart data.
Note that this option will not be available if the Yearly Comparison option is enabled. See the Yearly Comparison section above for details on where to locate this option.
- Using the information above, ensure that Time Series is enabled for your chart (this requires a time/date field in your X axis)
In our example, we have created a chart using the Ski Team view, with Invoiced Date in the Horizontal Axis field - Click on the Settings tool to display the Chart Settings dialog box
- Click on the Interaction section heading to expand it
- Click on the toggle for Date Slider to enabled it
- Click on the Close button in the top right corner to close the dialog box
To see the new option, let's preview the chart - Click on the Design tab in the top left corner of the page
Your chart will now display a date slider just under the chart display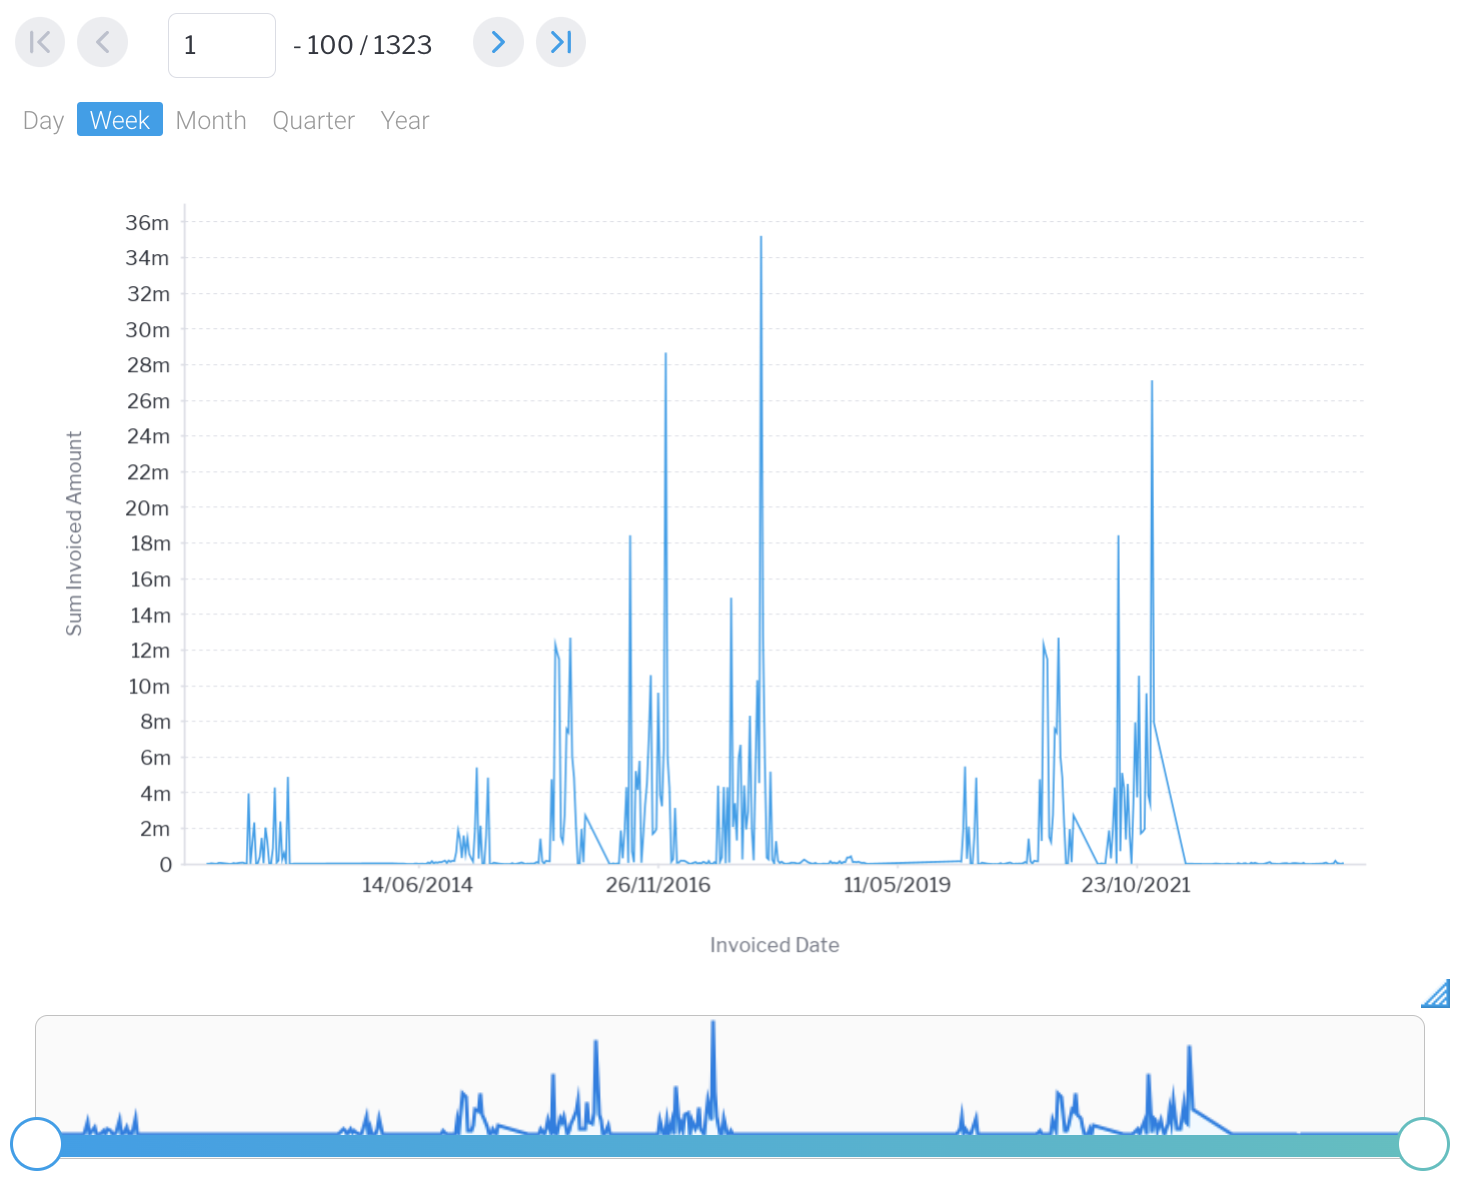
- Hold your mouse button down on one end of the chart slide and move it, then release your mouse button to see the effect
The data on your chart will expand or reduce to match the slider
- Click on the Charts tab in the top left corner of your screen to return to the Chart Builder
| Tip |
|---|
You can use the Slider Series option to choose which series to use in the slider if your chart has more than one available |
| Styleclass | ||
|---|---|---|
| ||
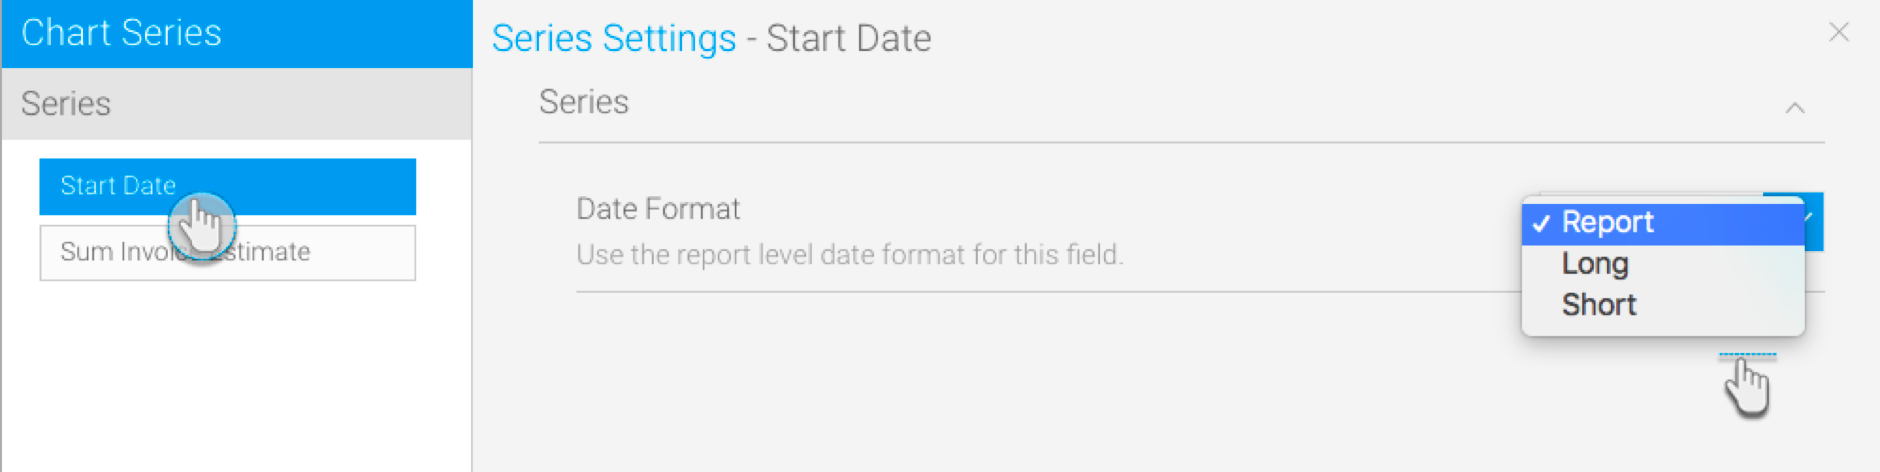
Change the date format
You can change the date format on your charts to different styles more suited to your needs. This is available for all discrete Change the date format on your charts to a different style. This is available for all charts that support time series.
Type | Description | Format/Example |
|---|---|---|
Report | This shows the date format as it is in the report. For example, if the date is in a numeric format, then it will be displayed as dd/mm/yyyy here. Note: This format can only be selected for continuous time series. | Default from the field format |
Long | Shows the full name of the selected date unit. For example, if month is the selected unit, it will display the full name of the month. | E.g.: Monday, August, or |
Short | Shows the shorter version of the selected date unit. Note: Some time units have no difference between their long and short versions, such as Year. | E.g.: Mon, Aug, or |
Note that this option will not be available if the Yearly Comparison option is enabled. See the Yearly Comparison section above for details on where to locate this option.
To check or change your date format for a series, follow the steps below.
- Using the information above, ensure that Time Series is enabled for your chart (this requires a time/date field in your X axis)
In our example, we have created a chart using the Ski Team view, with Invoiced Date in the Horizontal Axis field Create a report with at least one date value.
Navigate to the chart section.
Select a chart that supports the time series. Ensure that you use a date/time field (not a plain text field that stores a date).
Click on the Series tool
 on the toolbar
Click on the series setting button in the chart builder’s header.
Select the date/time field from the left side panel.Choose and apply a date format.
...
Click on the drop down for Date Format to see the available options
| Styleclass | ||
|---|---|---|
| ||
Display metric in color field
You can add a metric value to the color field when creating a time series chart. This will allow the metric field’s values to be represented in the chart with the help of colors.
Note that this option will not be available if the Yearly Comparison option is enabled. See the Yearly Comparison section above for details on where to locate this option.
- Using the information above, ensure that Time Series is enabled for your chart (this requires a time/date field in your X axis)
In our example, we have created a chart using the Ski Team view, with Invoiced Date in the Horizontal Axis field - If your chart is an auto-chart, consider changing it to a specific chart type that distinguishes Create a time series chart, using a time value. (You may want to select a non-auto chart which best distinguishes between colors, such as a bar chart.)Ensure that the time series is turned on through the time field’s menu, by selecting Time Series and then On. (Note: Time series is automatically turned on.)
- Drag a metric field to the color field in your chart builder.
- The colors of the chart data will change according to the value of the applied metric field. A legend will also appear at the bottom to help distinguish between the color range.
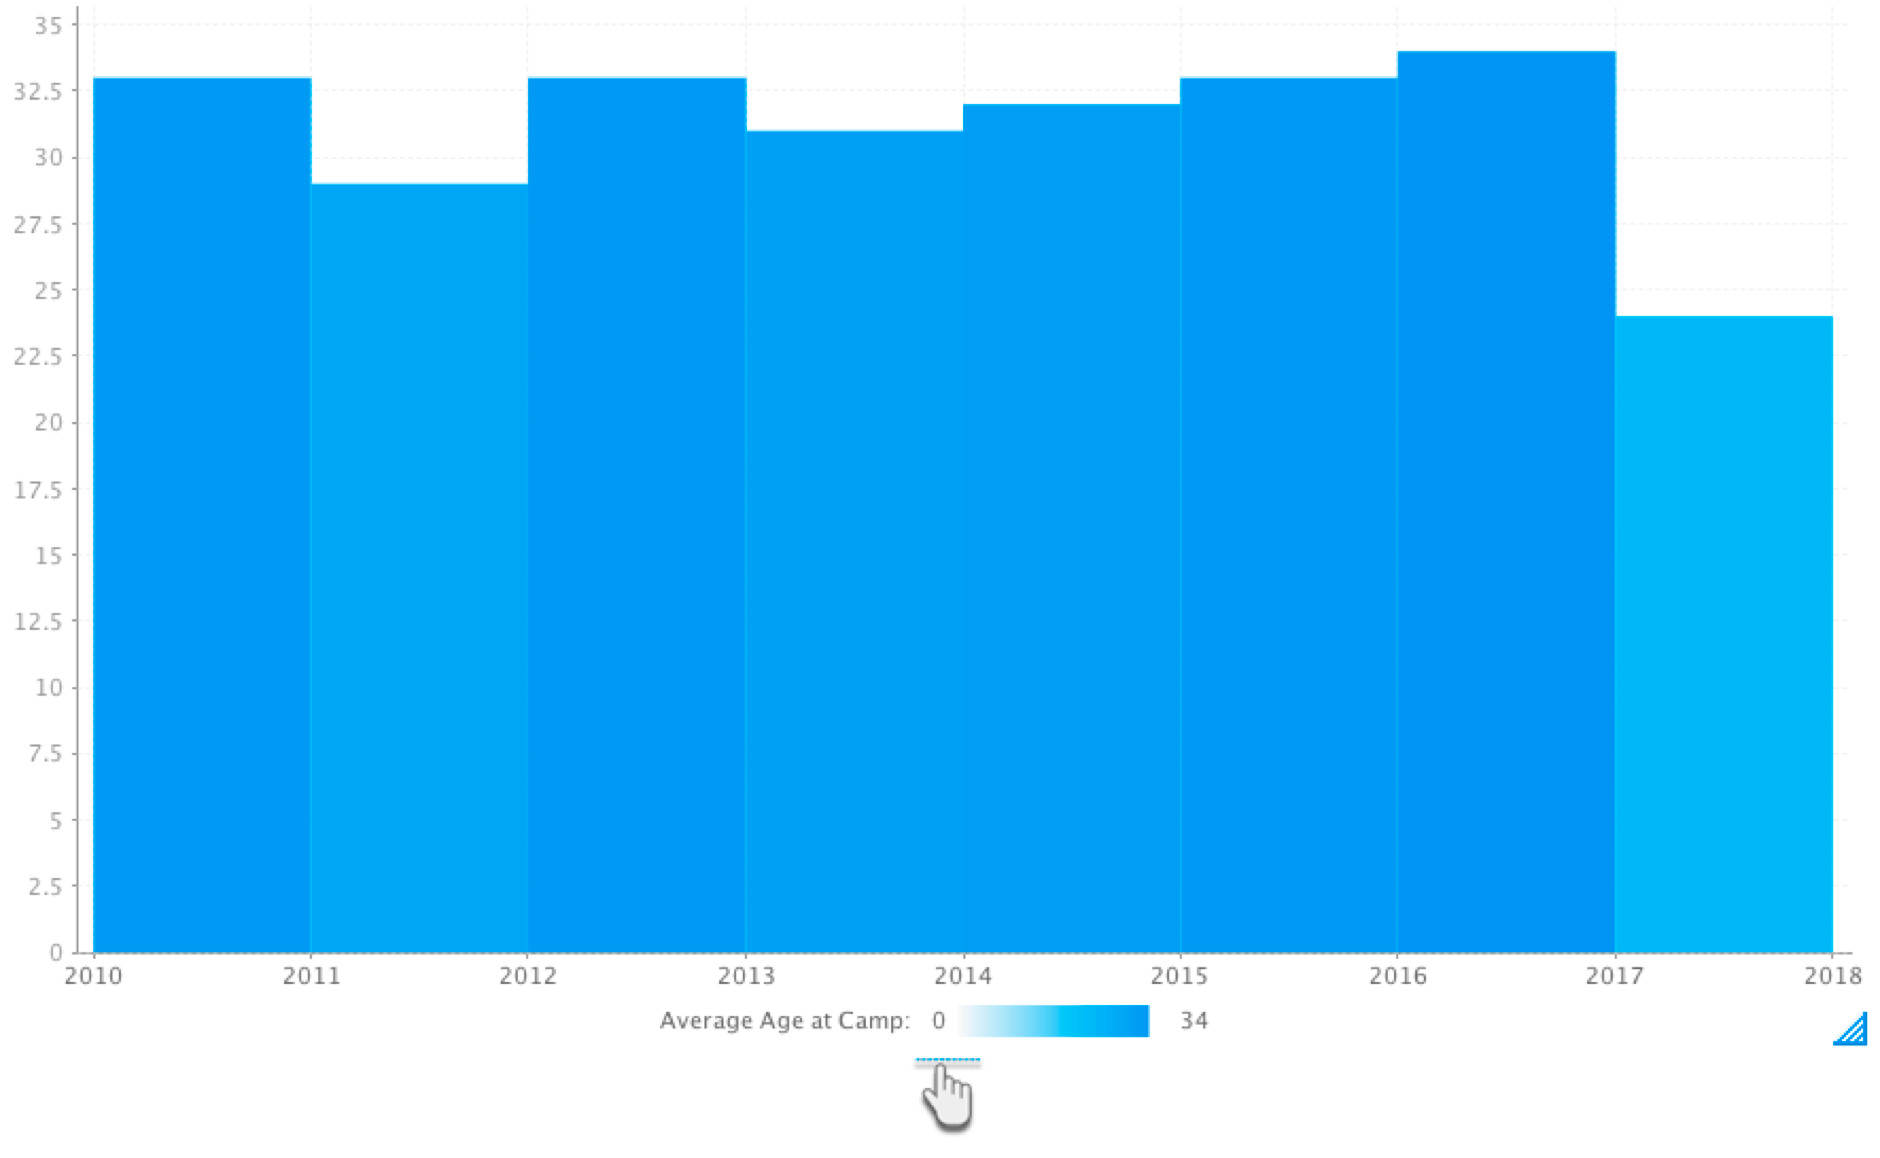
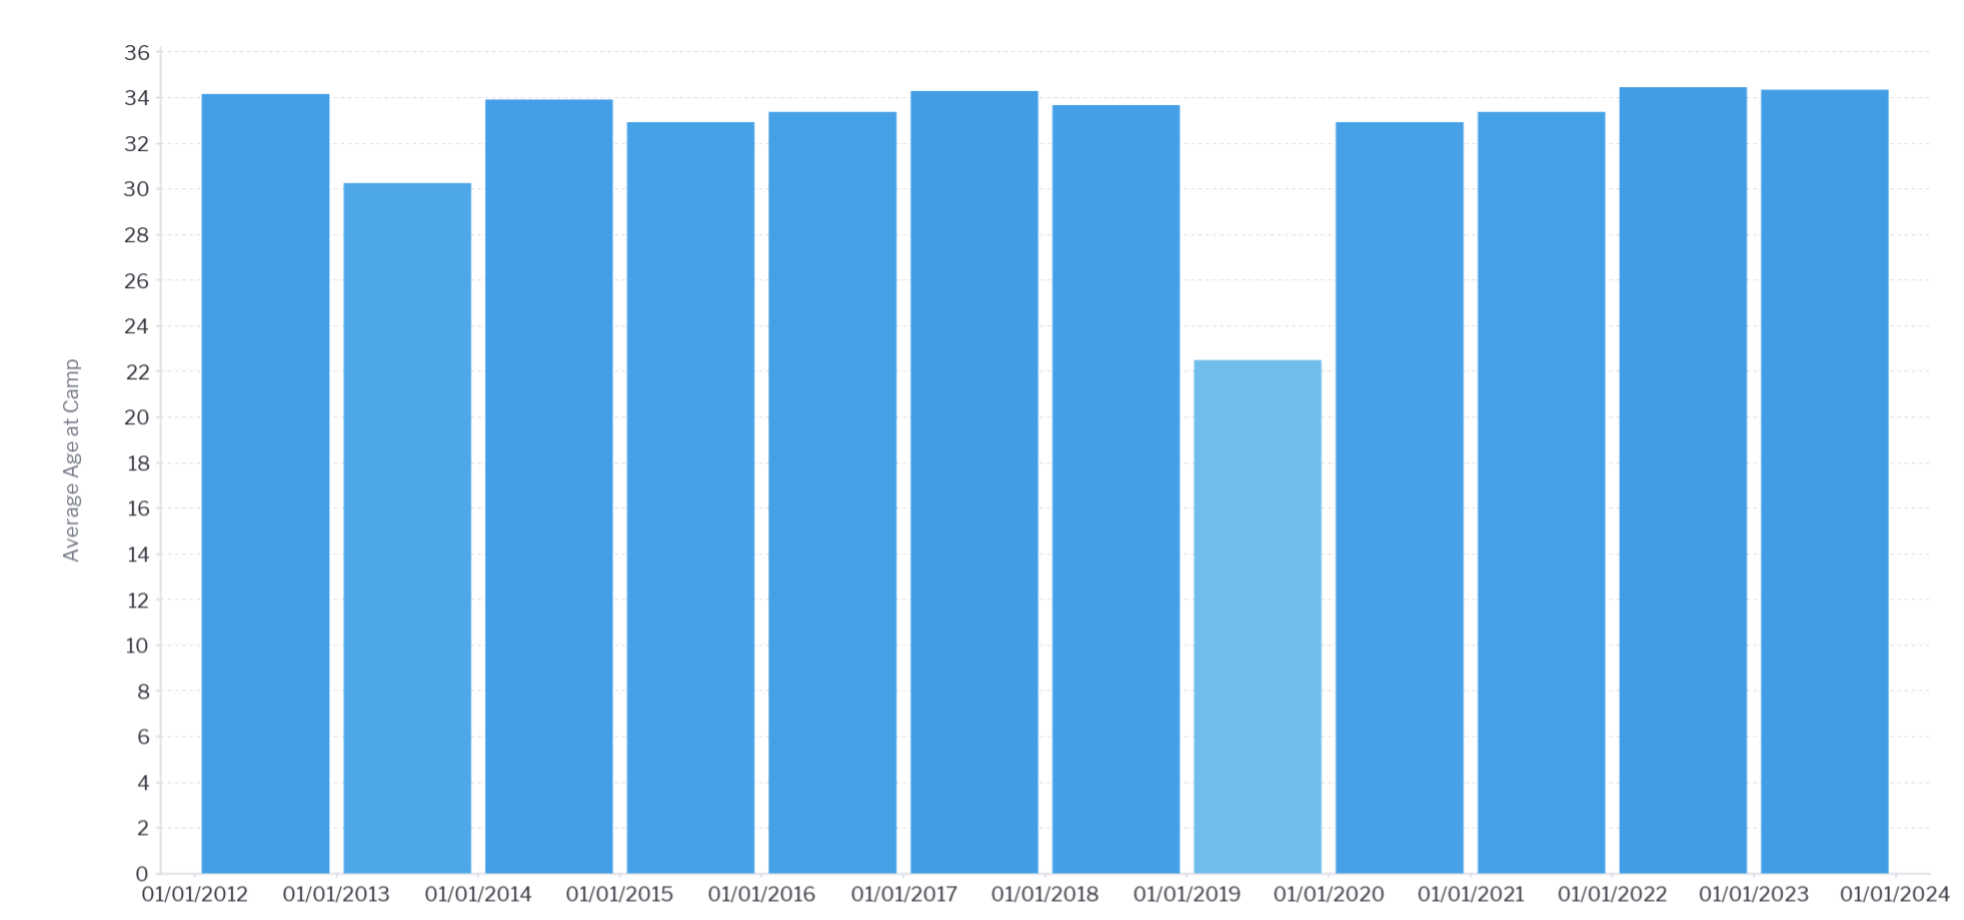
As seen in our example above, the 2017 2019 bar has an average age of 2423, and is therefore a lighter shade of color than the 2010 bar which has an average age of 33.
| Anchor | ||||
|---|---|---|---|---|
|
...
| Styleclass | ||
|---|---|---|
| ||
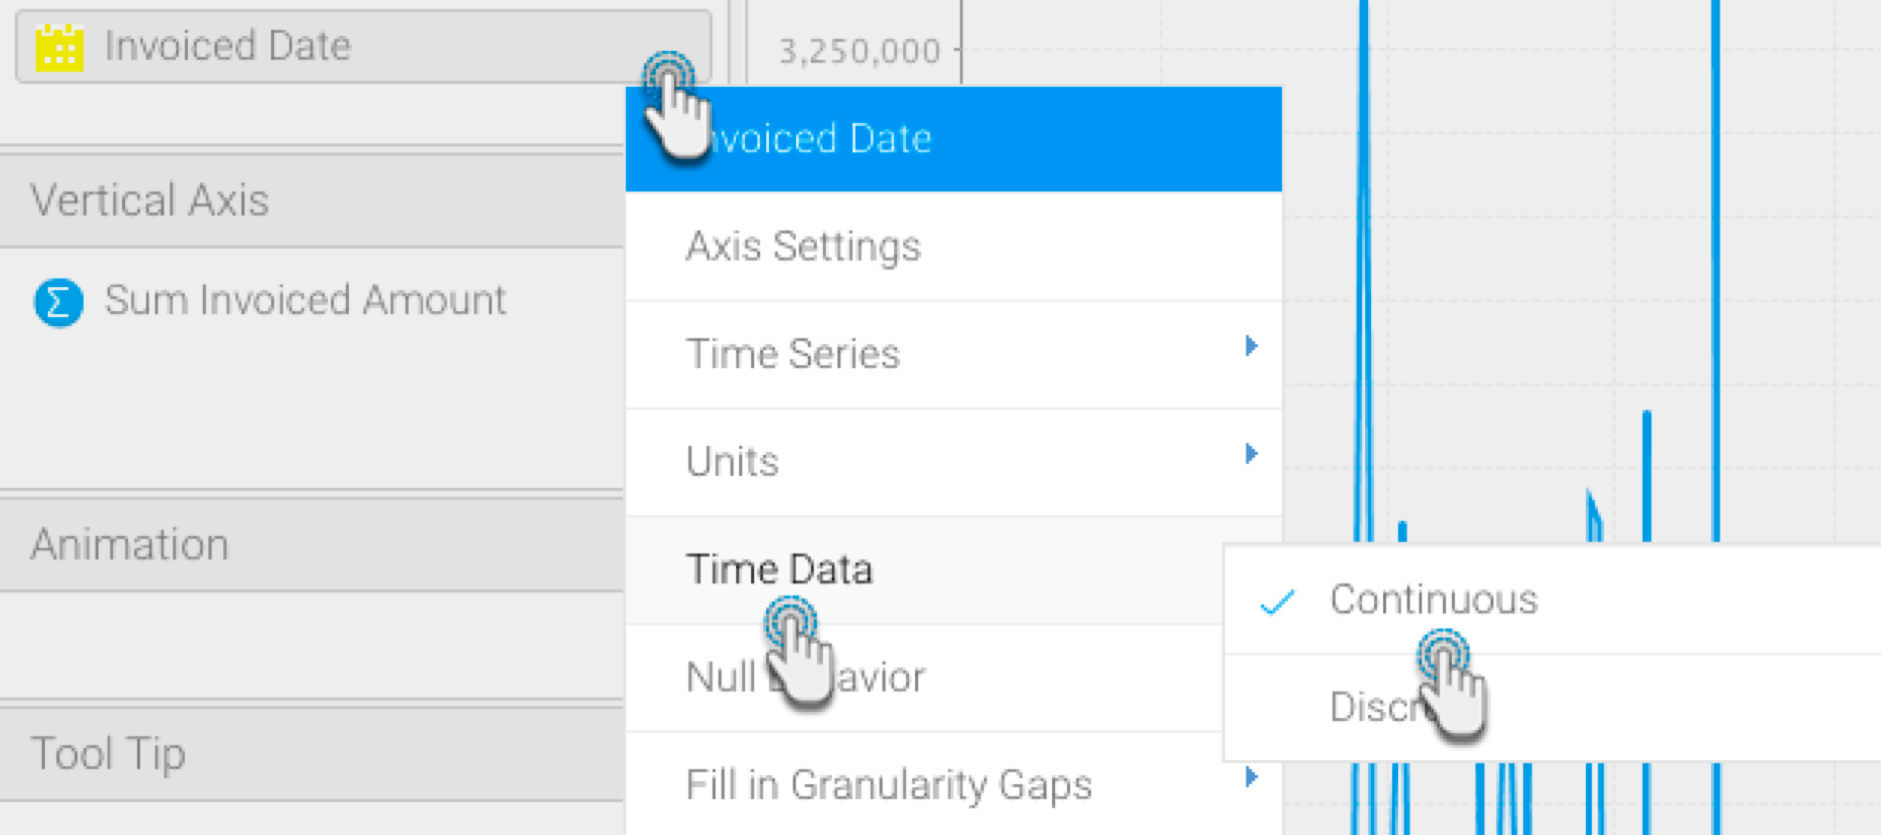
Control null behavior
If your data is missing any values (that is, it contains NULL values), then you can select how to control the gap in time granularity. Time granularity refers to the date or timestamp unit of your chart (millisecond, second, minute, hours, day, week, month, quarter, or year). You can choose to do the following to control the gap:
...
Note: This functionality is provided for all variations of line charts that support continuous time series, including auto-charts, line charts, stepped charts, combination charts, and overlay chart.
- Using the information above, ensure that Time Series is enabled for your chart (this requires a time/date field in your X axis)
In our example, we have created a chart using the Ski Team view, with Invoiced Date in the Horizontal Axis field Ensure that your time series chart is set to continuous. - Click on the blue triangle to the right of your time/date field, and from the pop-up menu that appears, select Time Data, then Continuous
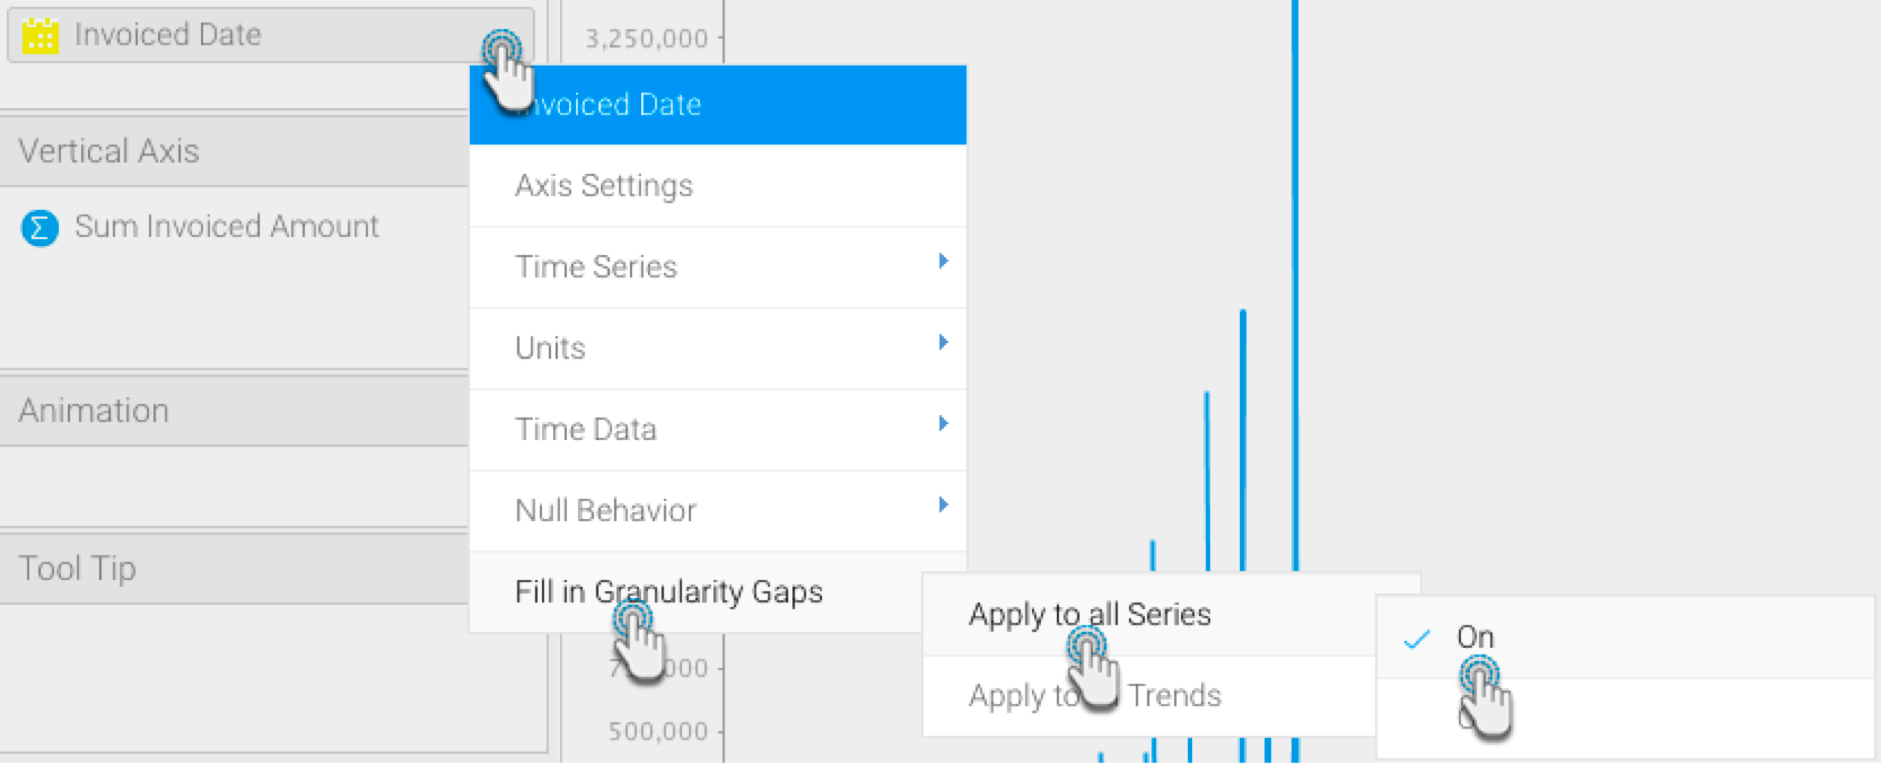
- Click on the date/time field menu arrow, and choose the
- same blue triangle and this time select Fill in Granularity Gaps option. Select
- , then Apply to all Series . Then choose On.
- , then On
This will enable the Null Behaviour functionality - null behavior for your line
- chart .
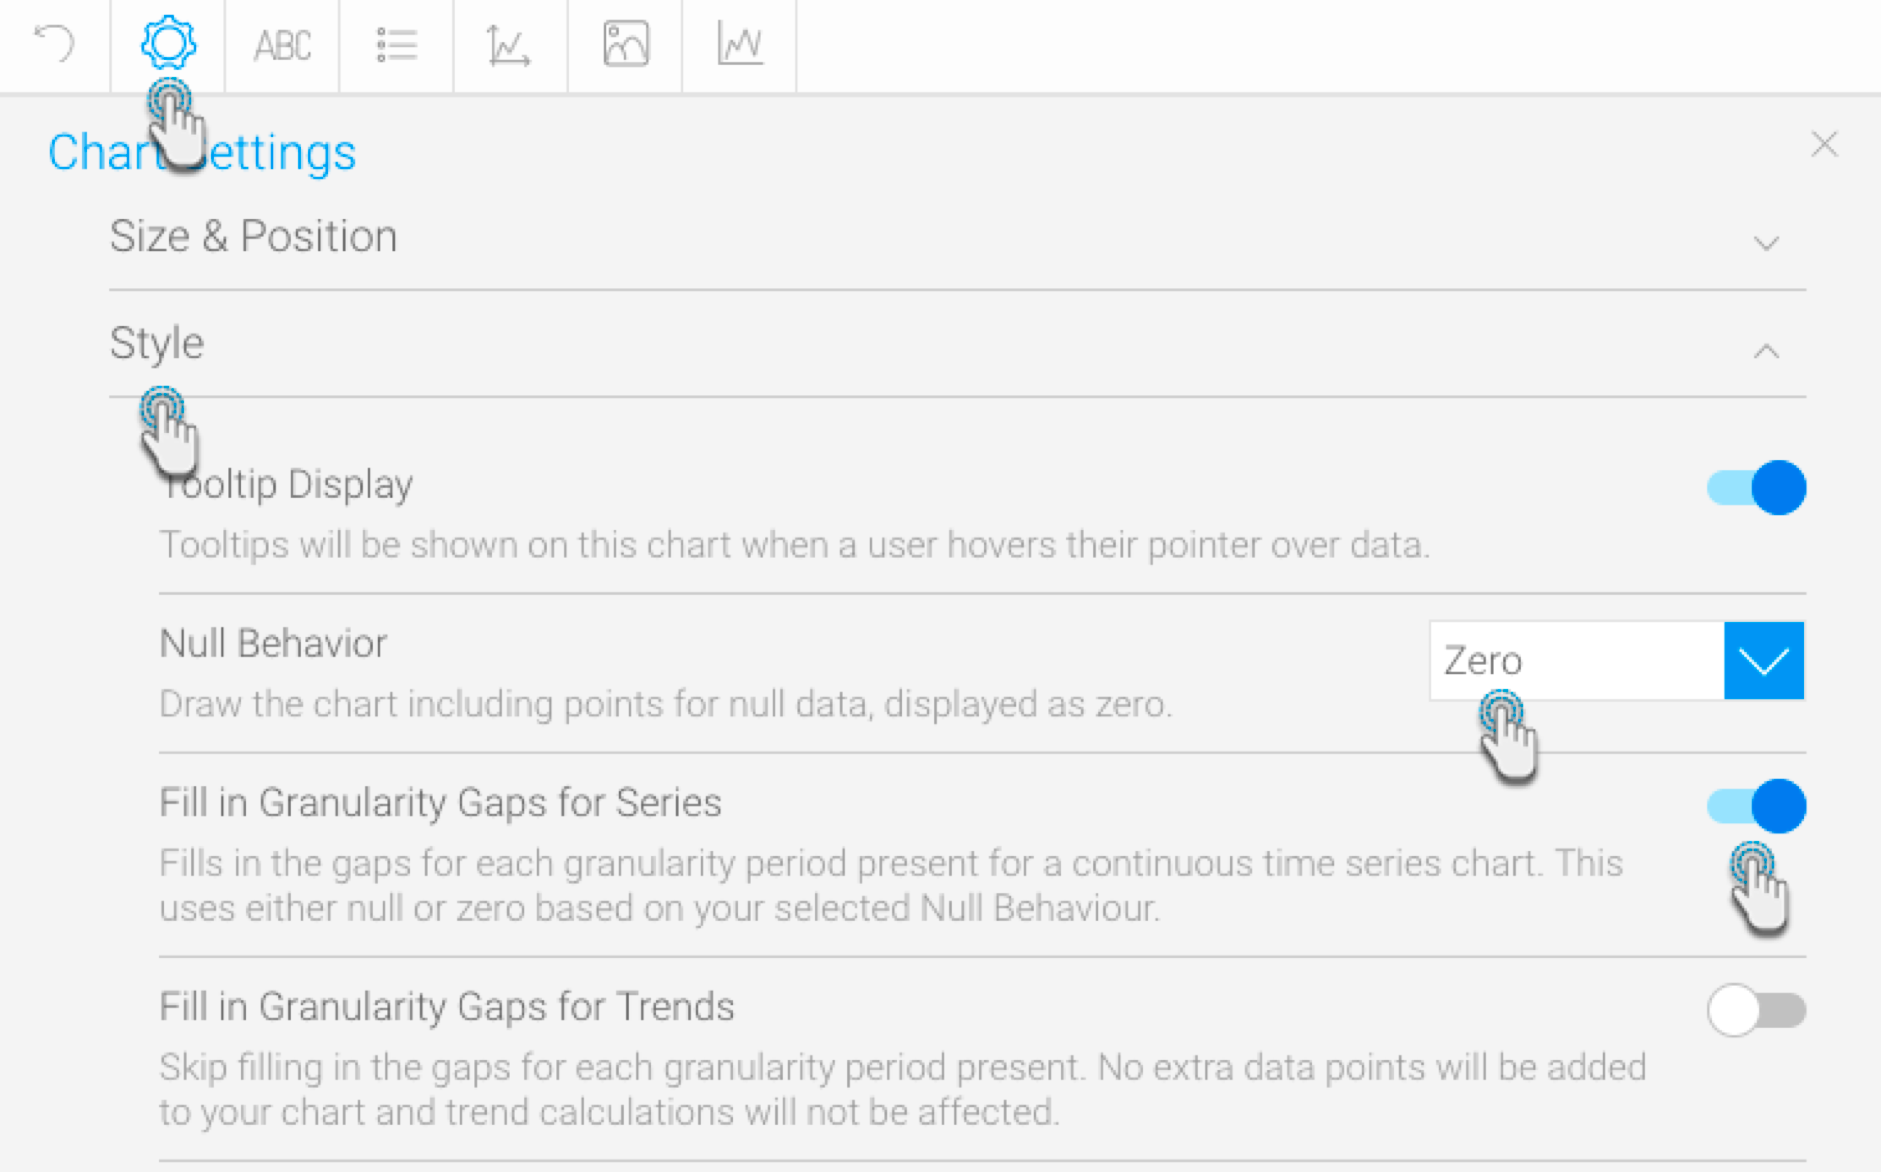
Next, choose the Null Behaviour option from the date/time field menu. Then select how you want the null values to be treated (click <here> for details on these values-link to above details)
- Click on the same blue triangle and this time select Null Behaviour, then select Break
Presuming your data has some null values, your chart will display a break in the data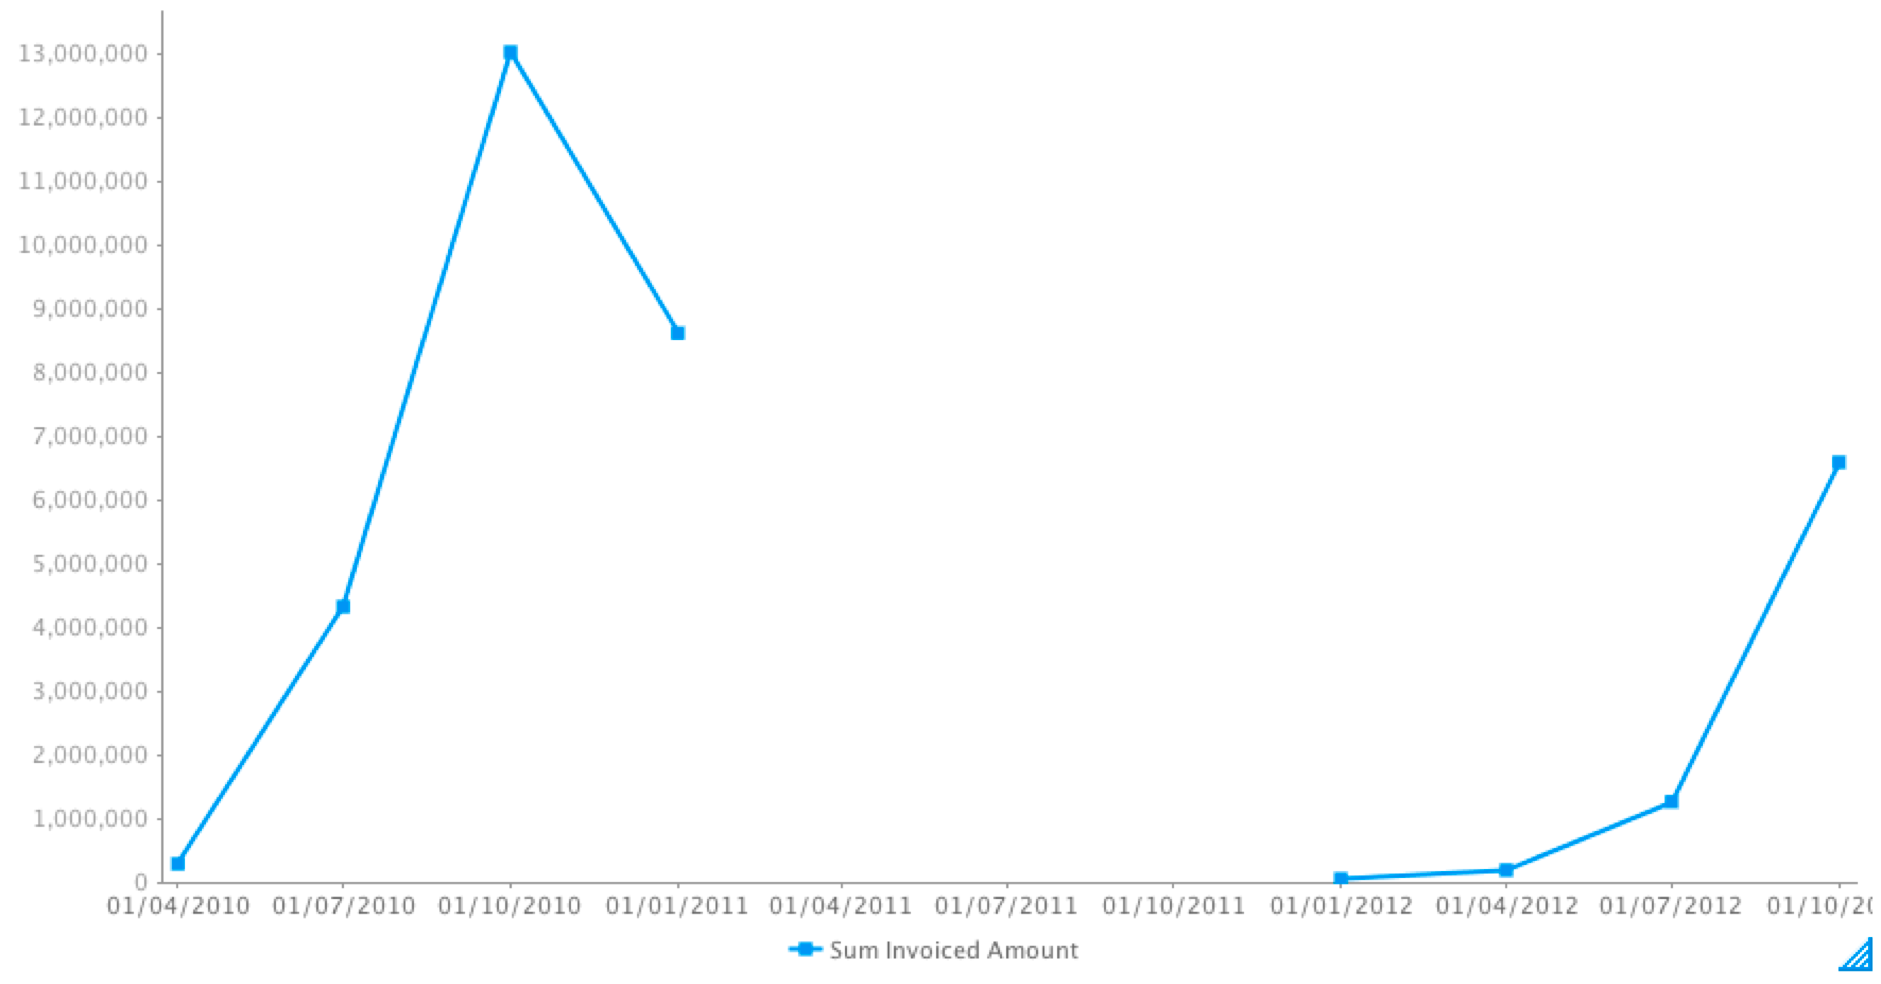
- Click on the same blue triangle and select Null Behaviour, then select Skip
Presuming your data has some null values, your chart will join any gaps (which is the default behavior for If Break is selected, the data will not be visible. - continuous time series charts) .
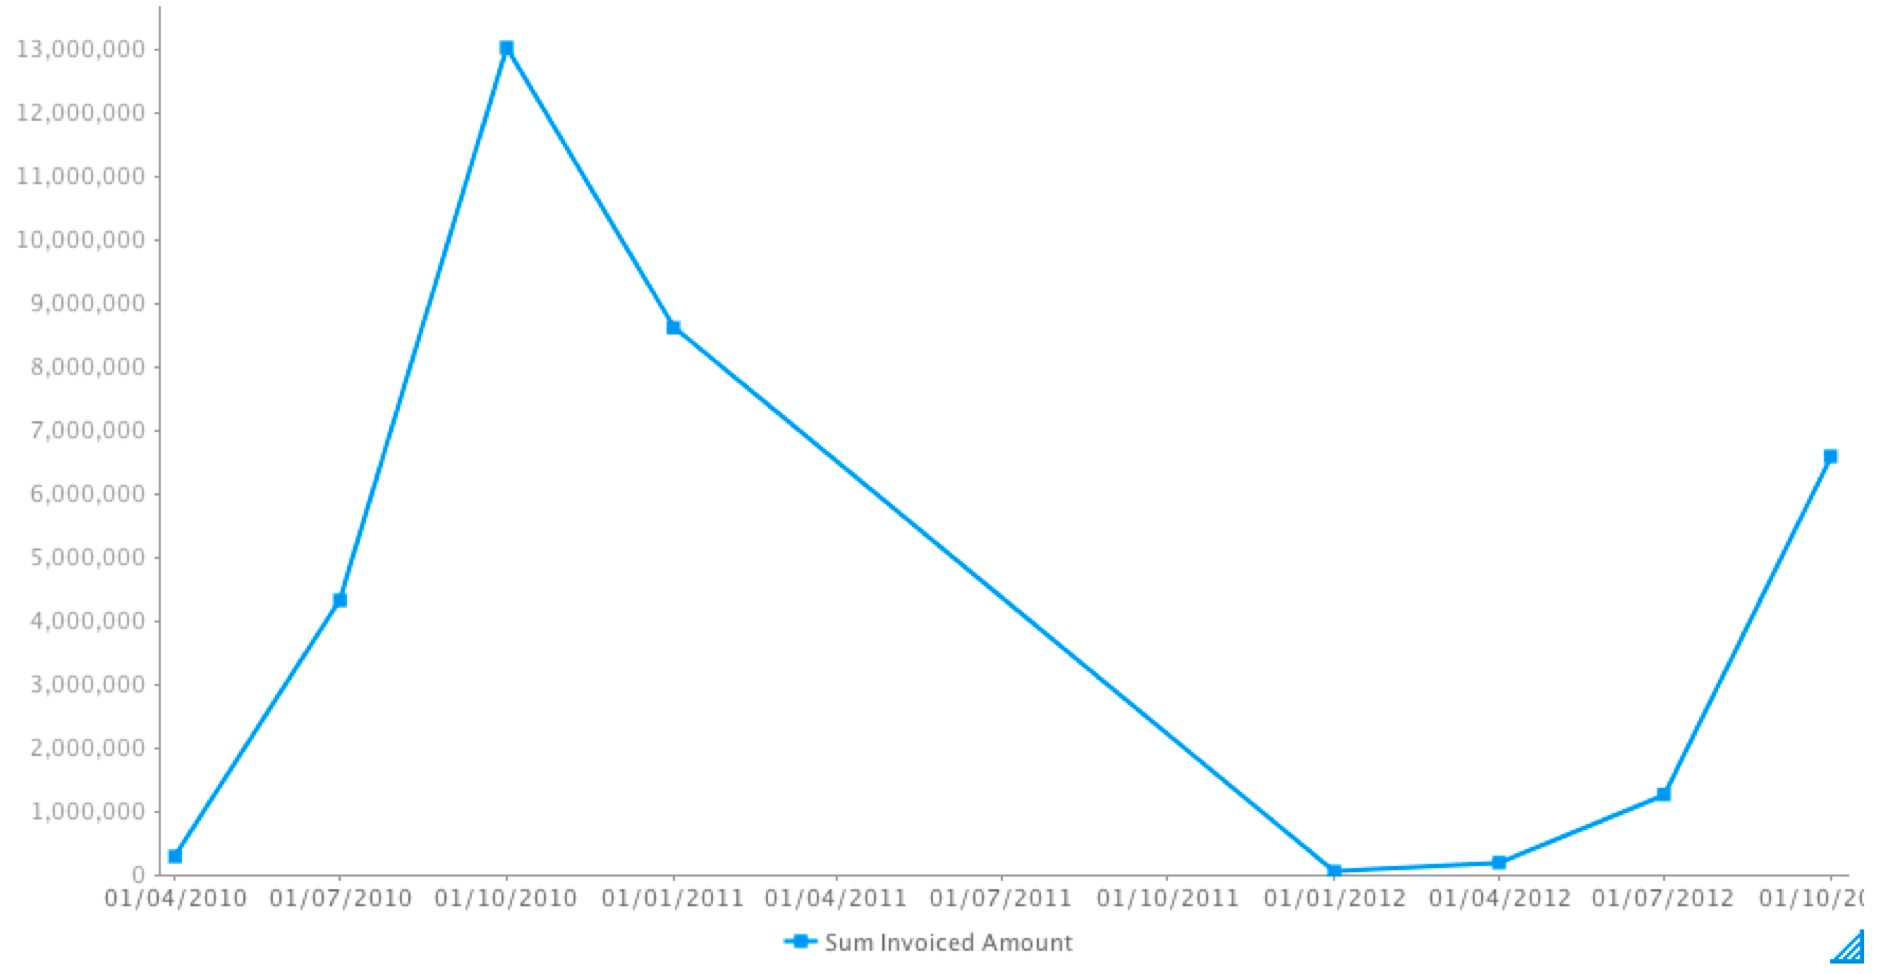 If Zero is selected, then the missing gap will be treated as zero values.
 - Click on the same blue triangle and select Null Behaviour, then select Zero
Presuming your data has some null values, your chart will use a value of zero for those null values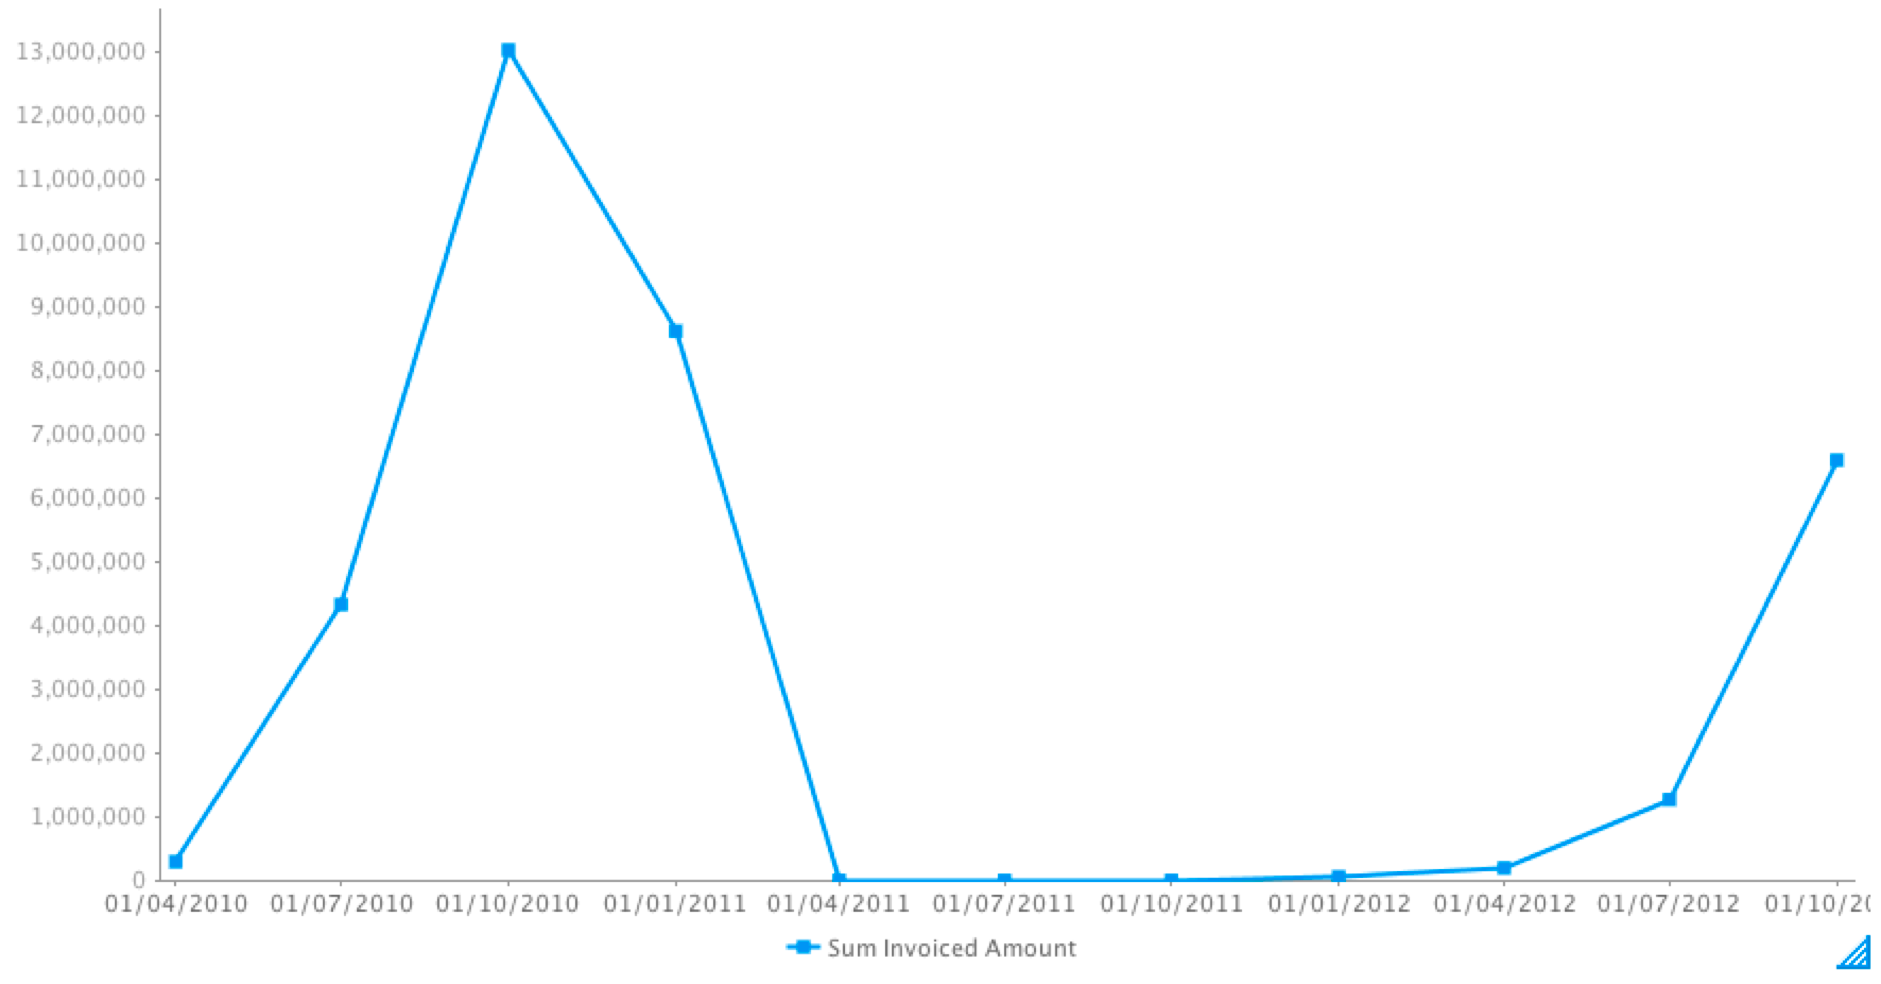
If Skip is selected, the line will be joined (this is the default behaviour of
Simultaneously, you can use these settings through the chart settings option.
You can also apply the null behaviour
In addition to these null behavior options for line charts, you can also apply them to a trend line, when a Chart Function (such as Trend, Average, or Accumulation) is used. To enable this, switch on the Apply to all Trends setting from the date
...
field menu.

...
| Tip |
|---|
The Null Behavior options are also available via the Chart Settings |
...
| Styleclass | ||
|---|---|---|
| ||