Page History
...
Yellowfin Stories gives you the power to include multiple types of content to your Storystory. This includes text narratives, reports, images and videos. You can add, edit, or delete content in this builder much like any other word processing tool. Stories use the same editing concepts and styles are other web-based tools, such as Medium or Wordpress.
Once you have created a new story in Yellowfin, you're ready to add content.
| Anchor | ||||
|---|---|---|---|---|
|
...
Adding content to a story
Add text to provide context to your story:
- Simply click Click on a new line in the Storystory.
- Start typing to enter your text, or you can also paste from your clipboard.
- The text will be automatically saved to your Storystory.
- To move on to the next line, press the Enter key.
Text formatting
Formatting story text
You You can format your text by using a formatting menu, as well as with a combination of your keyboard keys.
...
Icon | Type | Description | Key combination PC/Mac |
| Heading 1 | Converts the entire line of text into a heading. | — |
| Heading 2 | Converts the entire line of text into the sub-heading. | — |
| Quote | Converts the entire line of text into a quote. | — |
| Bold | Makes only the selected text bold. | Ctrl B/Command B |
| Italic | Makes only the selected text italicized. | Ctrl i/Command i |
| Link | Converts the selected text into a link. | — |
— | Numbered list | Creates a numbered/ordered list. See below for more details. | 1.<space> |
— | Bullet point list | Creates a bullet list. See below for more details. | -<space> or *<space> |
...
Start a numbered list
To initiate a numbered list, follow the steps below:
- Type 1. in either an empty line, or at the start of existing text, and then press the space key. Note that this will not work if the above key combination is added in the middle of a text.
- The text line will be transformed to a numbered list.

- After providing text, press Enter to move to the next numbered item in the list. You can repeat this to add multiple items to this list.
- To end the list, simply press the Enter key once again without providing providing any text.
Start a bulleted
...
list
The steps to create or edit a bullet point list are the same as above. However, the keyword combination to activate an unordered list could either be the hyphen key and then the space key, or the asterisk key and space.
Copying text into your
...
story
You can copy text from your Story, story into another section of the same Story. In doing so, any formatting applied to the copied text will be retained when it is pastedstory. Any formatting on text copied from a story is pasted with the text. However, text copied from an external source , will not keep any of its original formatting.
...
| Anchor | ||||
|---|---|---|---|---|
|
Embedding
...
reports
There are three types of report content to stories
...
You can add analytical reports to your Story. When adding a report, there are 3 types of content that you can add:
- Live reports
- Live reports with user prompt filters
- Bookmarks (a live report with pre-set filters)
- Snapshots (a saved copy of report data)
Choosing which report artifact to add, depends on what your Story is about. Consider the following to help you choose:
- Add a live report when you want to showcase the latest trends. Your report will display the most current data, as it is refreshed each time the Story is viewed.
- Include a bookmarked report to display results of pre-selected filters. For instance, instead of showing the sales of all the regions, you could limit the report to display only sales of the Asian region.
- Add a snapshot when you want to include static report data that does not change when the Story is refreshed. Ideal for when you want to point out results of a particular time period.
When you add a report artifact, you can choose which item to display for that report:
- chart or table
- the entire report canvas
- or in case of multiple charts, you can choose which of the charts to display (the first one is displayed by default)
Add a report
...
Report display options
...
Icon
...
Description
...
![]()
...
This resizes the report to a smaller size. You can switch between the small or big size of the report.
Size limit: 400 pixels in width.
...
![]()
...
Increases the displayed size of the report. (Enabled by default.)
Size limit: 700 pixels in width.
...
![]()
...
Displays only the report chart. In case of multiple charts, a popup will appear indicating the user to select one of the charts to be included. Click here for more details.
...
![]()
...
Displays the report table. Fits the size, but can be scrolled horizontally and vertically.
...
![]()
...
Displays the report canvas. (Disabled by default, and only available if the added report has a canvas.)
Note that a canvas cannot be resized in a story. The maximum size that can be displayed in the story is a default fit of 700 x 600 pixels. Bigger canvases will be cropped out. (When resizing the canvas in the Report Builder, pointers will indicate the maximum size that can fit a story.)
...
![]()
...
Redirects you to the report output page, where you can edit the report and re-publish it. The changes will be reflected in a live report added to the Story. You can also use this to replace the report with a snapshot or bookmark, or add another artifact of the same report to your Story. Learn more here.
...
Replacing Reports
Report artifacts, such as live reports, snapshots and bookmarks, that have been added to a story, can be replaced.
...
...
Chart Selection
If your report includes more than one chart, then you have the option of selecting which chart to include.
...
Sharing Hidden Content
...
| Report data type | Description | Example |
|---|---|---|
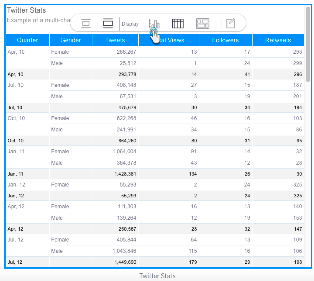
| Live reports | When embedded in a story, a live report is automatically updated with the latest data. If a report has any default filters set, the embedded report is displayed with the same filter settings. You can interact with reports embedded in stories (with or without user prompt filters), including tooltips, drilling, keeping/excluding filtering, brushing and annotation. | Last week's global sales. |
| Filtered live reports | From Yellowfin 9.6, some embedded reports can be filtered directly within the story. The embedded reports that can be filtered are those with user prompt filters enabled. That means you can set a report's user prompt filters while editing a story so that your published story displays the filtered report results. The filter details are saved as soon as you click on the Apply button or when you publish a story. Once published, the story, along with any filtered reports embedded within it, is readable only. The user prompt filter controls will no longer be visible and therefore not adjustable. Any filters applied to an embedded report at the time story publishing will be used to display the report data in the published story. Even if the original report is subsequently edited to change those filter values, the published story will not reflect those changes. If you edit a published story, the user prompt filter controls for embedded reports will return. Remember, a report must have at least one user prompt filter enabled for this functionality to be available. See the diagram below the table for further information. | Last week's sales for a particular region. |
| Bookmarks | Before Yellowfin 9.6, bookmarks provided a means of filtering live report data. Bookmarks are still available, but live reports with user prompt filters provide the same results with fewer steps. | Last week's sales for a particular region. |
| Snapshots | Snapshots are perfect for including report data that cannot be altered in any way. Taking a snapshot is like taking a photo of the existing data — a snapshot in time. | A specific event in your data that you wish to highlight. |
Diagram explaining embedded reports with user prompt filters

Adding report data to a story
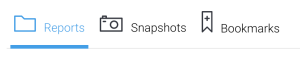
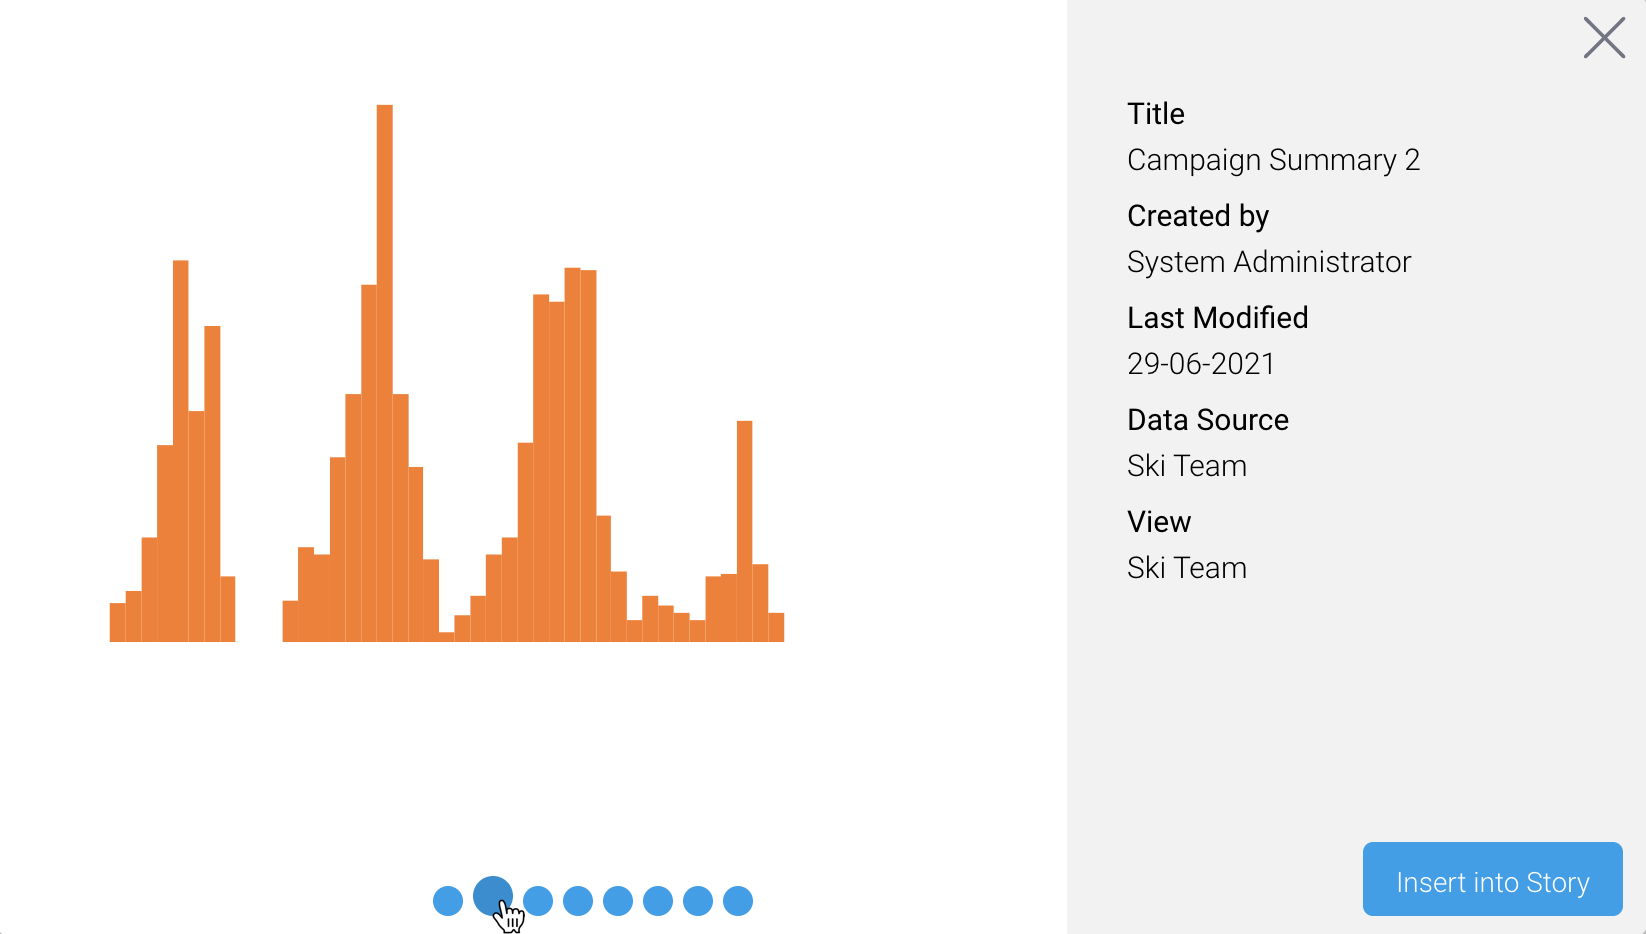
You can add a report, bookmark or snapshot to a story through a pop-up screen while editing your story.
When you add a report, you can choose which item to display for that report:
- chart or table;
- the entire report canvas;
- any other chart visible within the report (the first one is displayed by default); or,
- a report snapshot or bookmark.
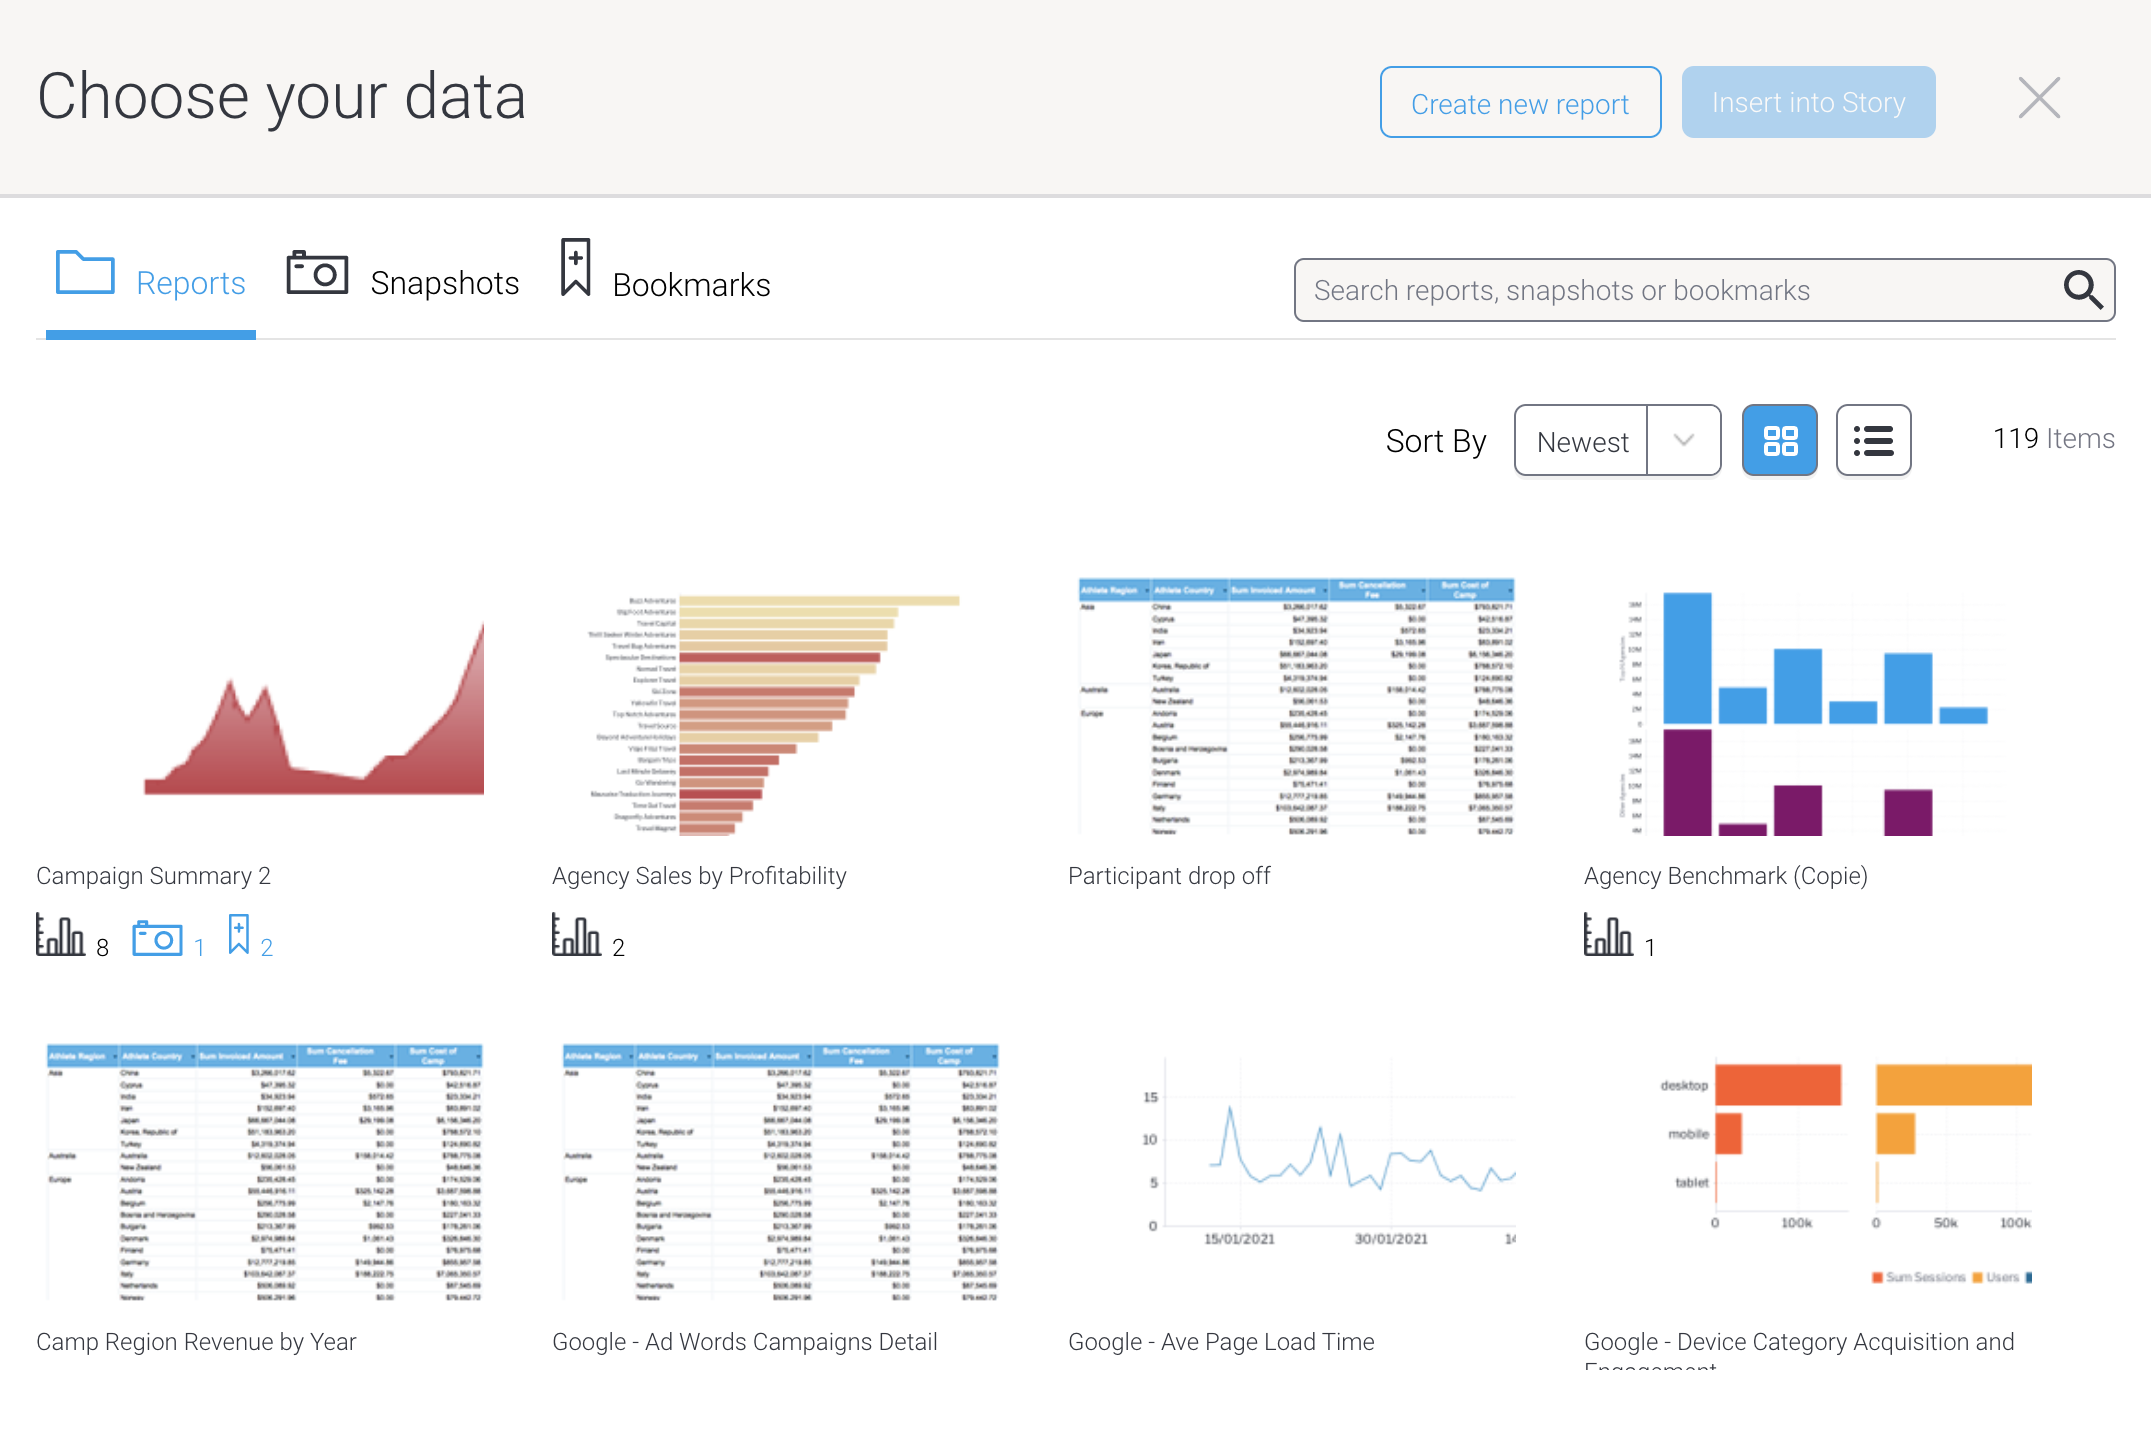
The elements of this screen are described in the table below.
| Element | Description |
|---|---|
| Select the type of report content you wish to embed. Choose between reports, snapshots and bookmarks, which are described elsewhere on this page. |
| If you know the name of the content you wish to embed, use the search bar to type any part of the name, then click on the magnifying glass to search for matching content. |
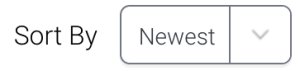
| Sort the display of reports by most recent, oldest, alphabetically ascending or alphabetically descending. |
| Change the display of reports between tiles and a list. |
| To the right of the sorting and display options, the screen will show you a count of the total number of items available to embed. |
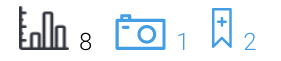
| These icons may appear under some of the reports shown in the list. It indicates how many charts, snapshots and bookmarks exist with a report. The item displayed in this preview window will only reflect one item available within each report. The steps below explain how to select a different item, such as a different chart from a report with five charts. |
| If you realise you need a new report while editing a story, you can click on the Create new report button to go directly to a new report, saving navigation time. |
| This button will be activated as soon as you have selected an item (a report, a snapshot or a bookmark) from the list of available options. You can select multiple items first, then click on this button to insert them all at the same time (in the order you selected them) |


When you're ready to embed some report content, follow the steps below.
- Click on the plus button at the start of a new line
If you can't see this button, click below any existing story content. The button will appear with a flashing cursor beside it, ready for you to click on it
- Click on the report button from the pop-up menu

- A popup box will appear displaying all the reports available to you
- If there are lots of reports, use the screen options described in the table above to sort and filter the number of reports displayed
- If you wish to insert a snapshot or bookmark, click on one of those options in the top left corner. In these steps, we'll embed a report
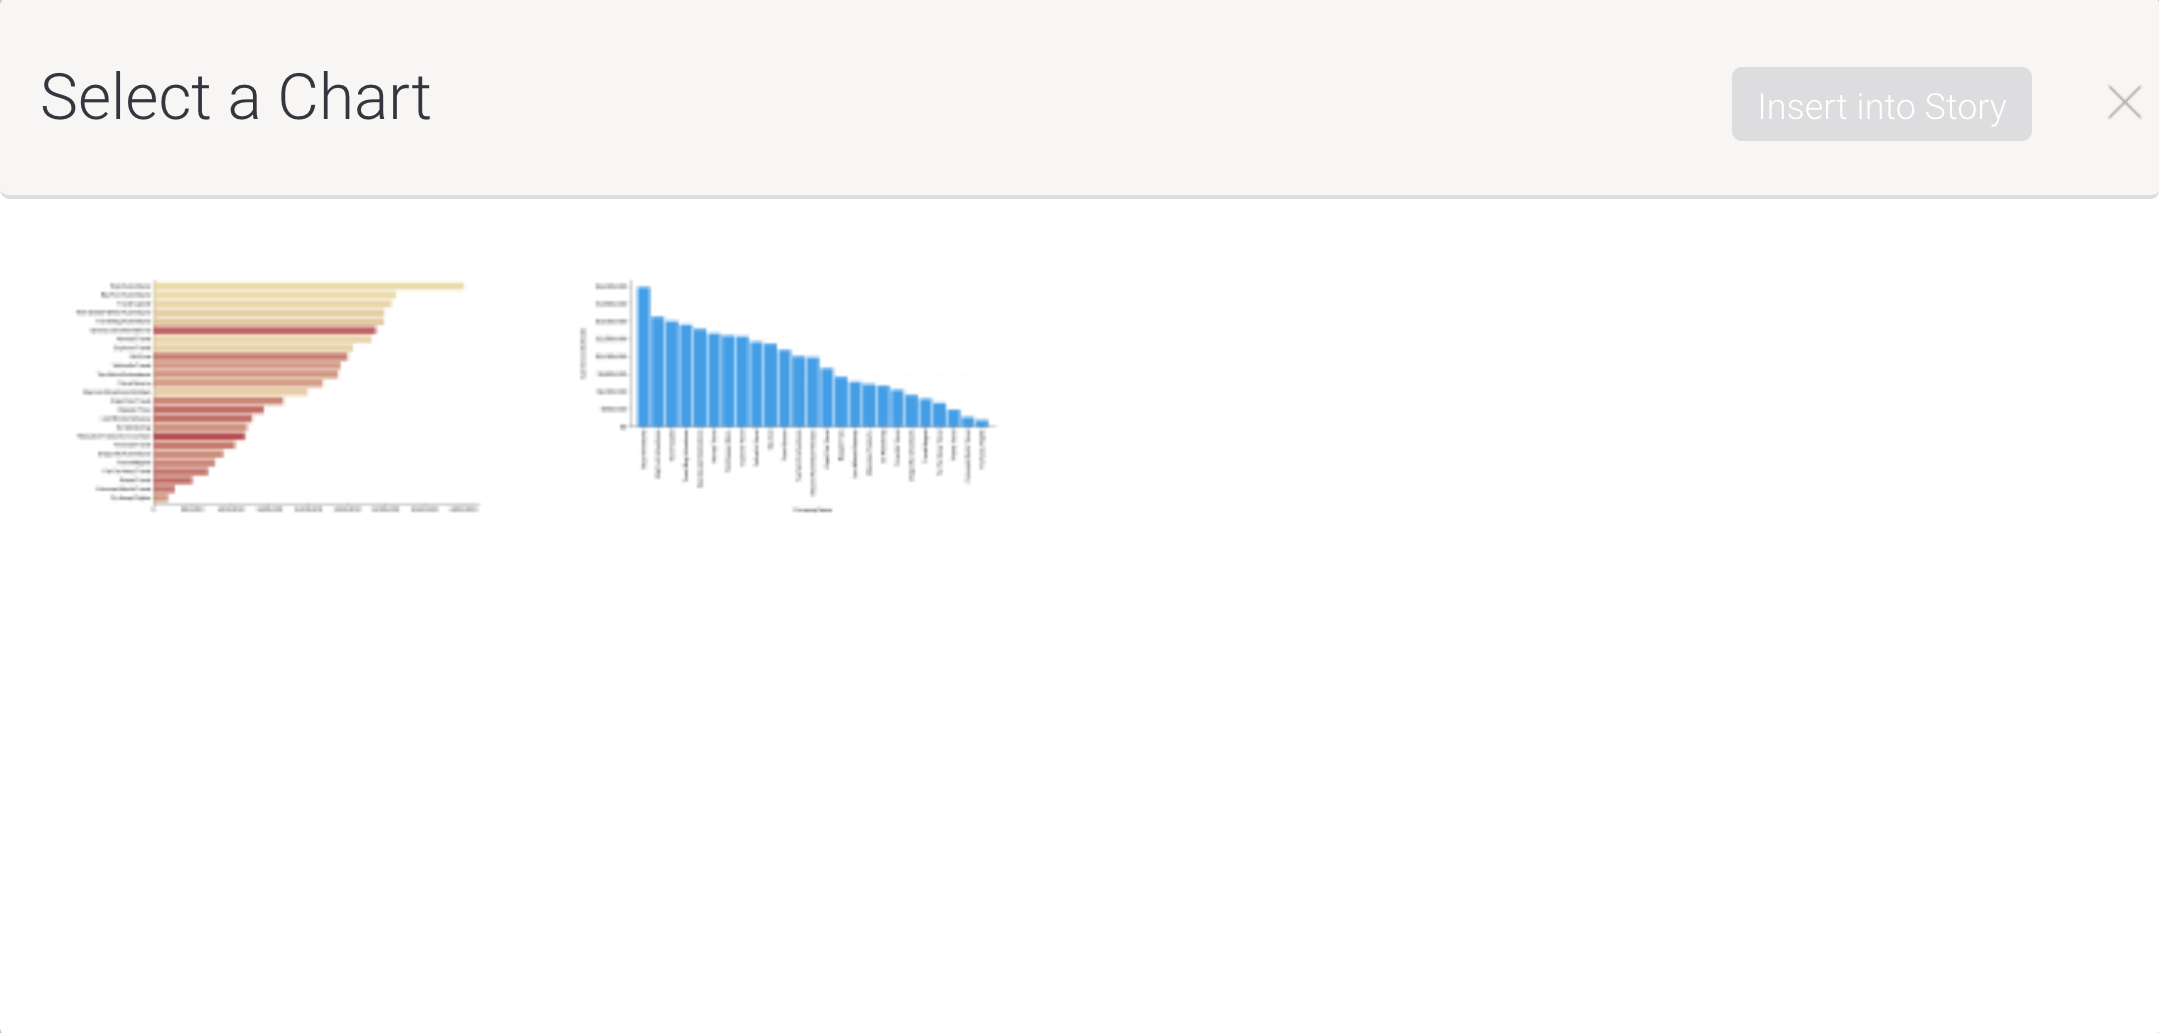
- Hover over the top right corner of a chart with more than one item listed
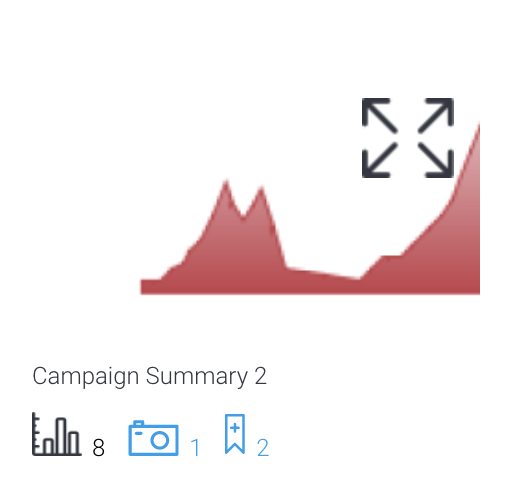
- Click on the arrows that appear to see the preview and chart selector
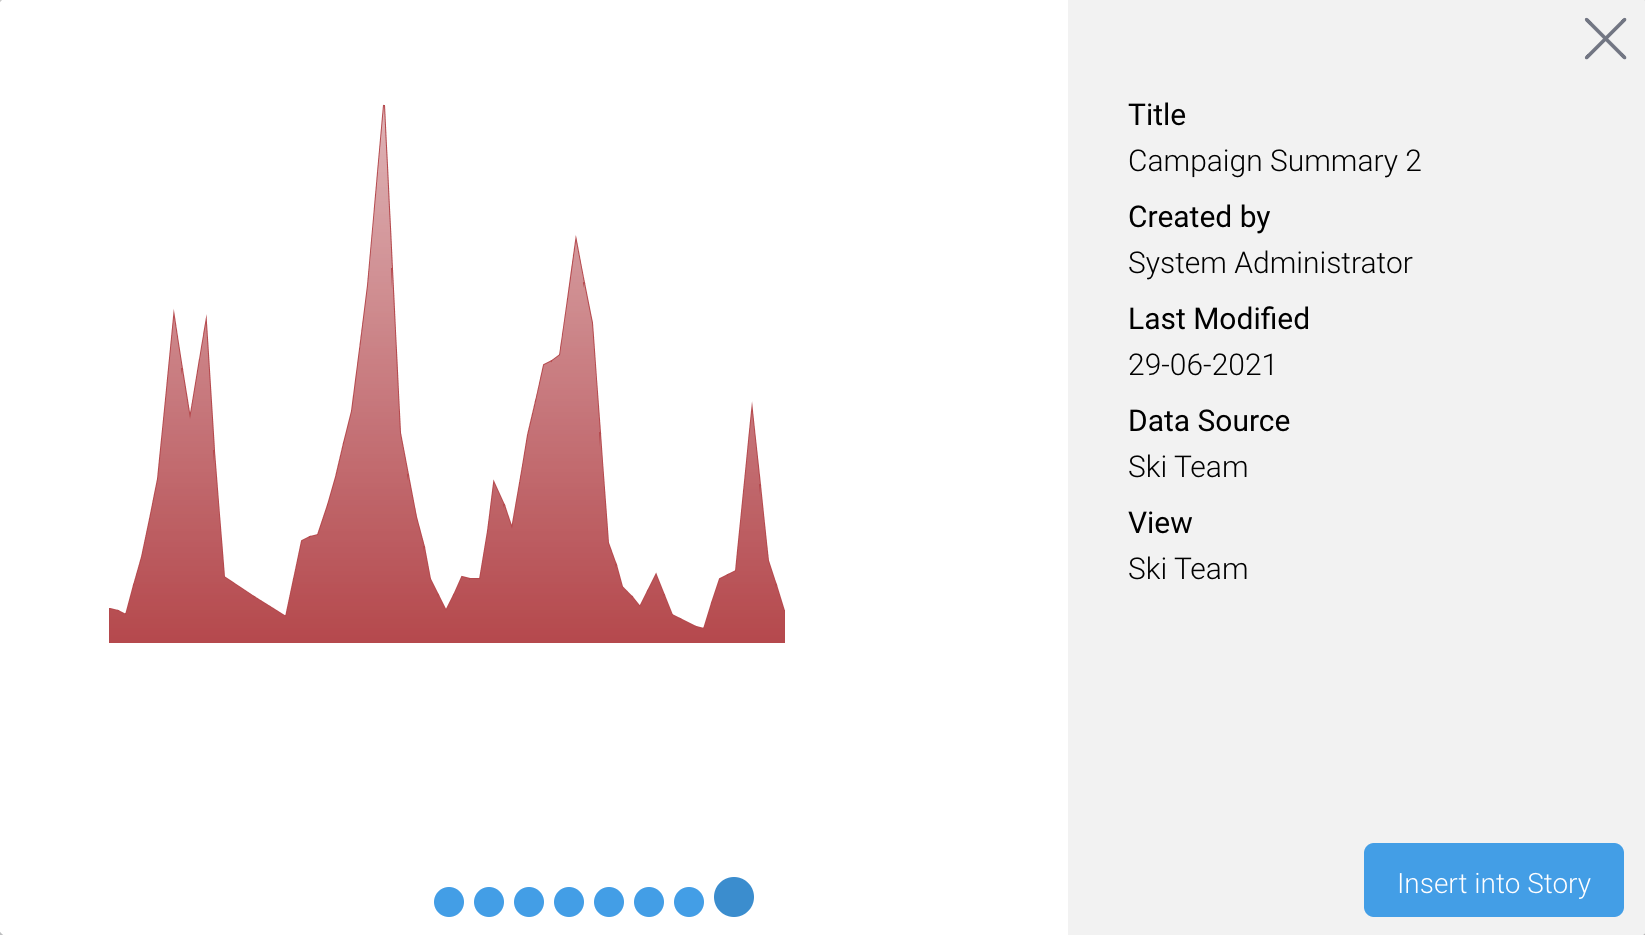
- Click on the blue dots beneath the chart to see the other charts available
- When you've found your preferred chart, click on the Insert into Story button
The previous window will reappear and show the chart selected (note that the preview thumbnail may look different to the chart you selected)
If you wish to embed more than one item, follow the steps above, or click anywhere else on the preview to select the item without entering preview mode - Click on the Insert into Story button in the top right corner to insert your selected items
You selected items will be embedded with an editable caption underneath, in the order you selected them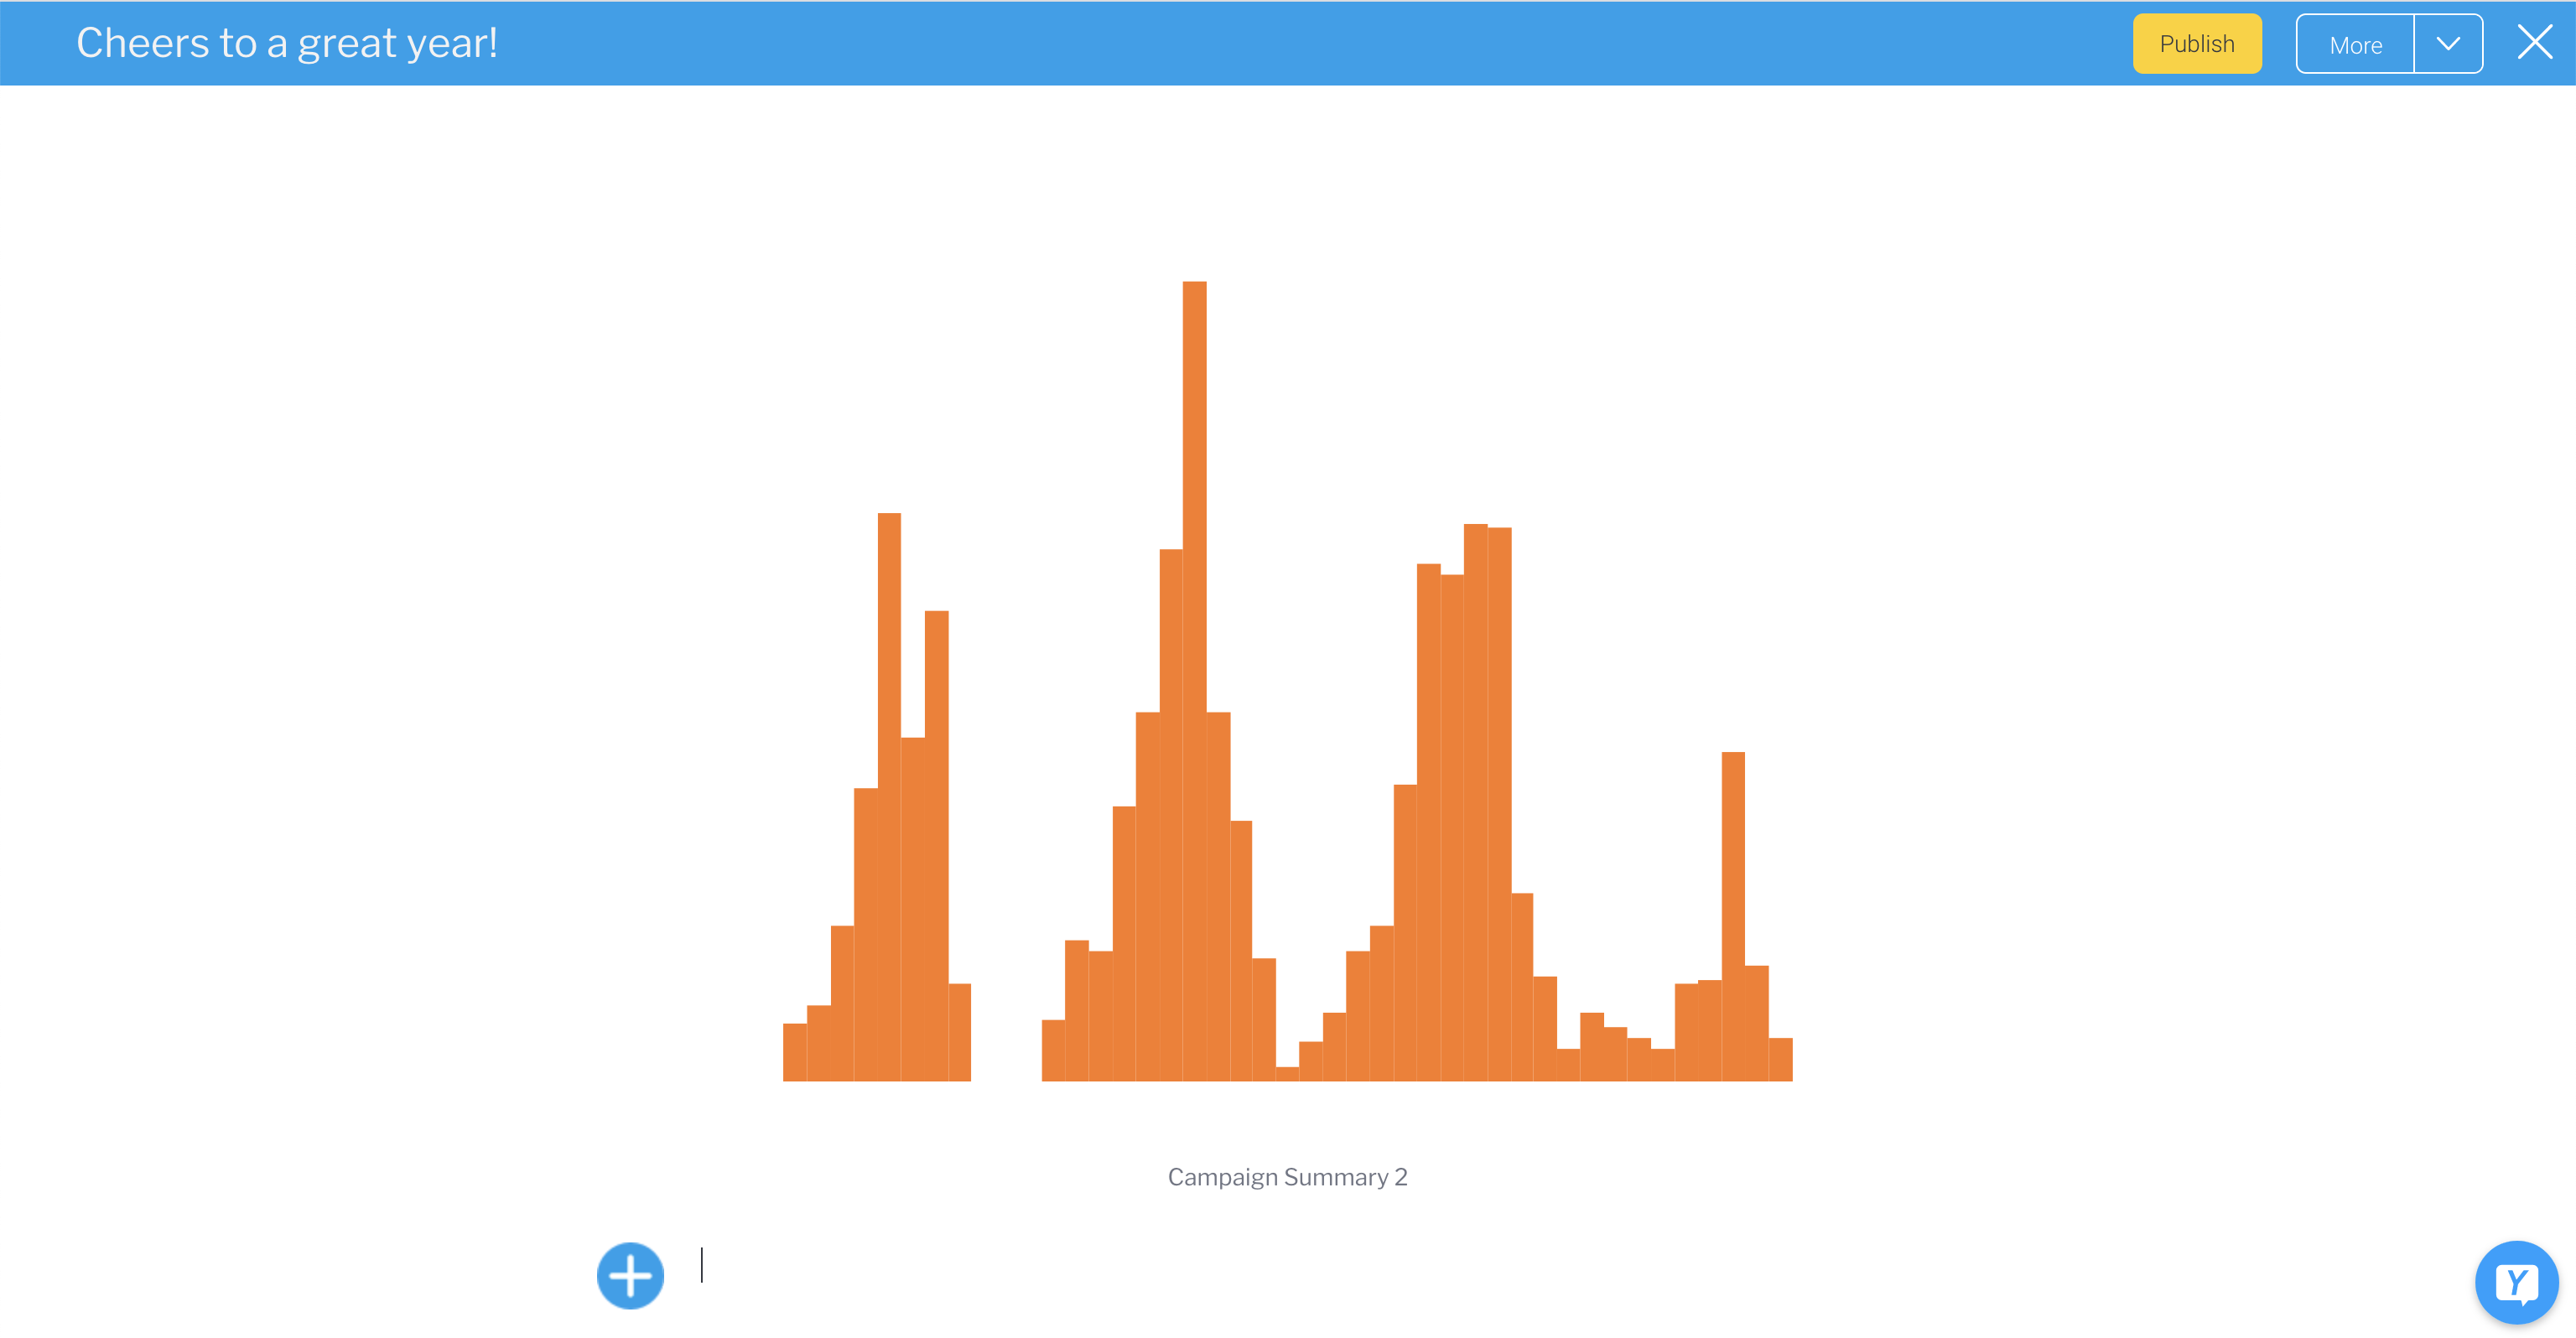
If you wish to change the display of your embedded report, follow the steps below.
...
| Anchor | ||||
|---|---|---|---|---|
|
Manipulate embedded reports
Hovering over a report will display a pop-up menu. From the menu, you can resize the report's display size, switch between report views to display in the story, (chart, table or canvas, depending on what content is available), open any available user prompt filters to adjust the content of the report, and view the report in the Report Builder. The toolbar typically looks like this, although some options may alter depending on the content of your report.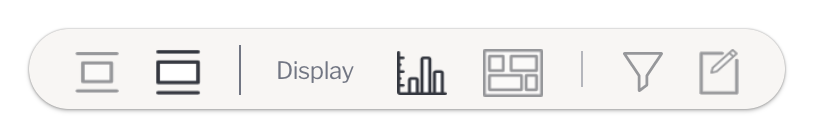
For paired buttons such as the display width or type, the active option is dark. Clicking on a gray button activates its functionality and deactivates the paired functionality. For example, clicking on the first gray button shown above would reduce the size of the report, darken the button, and lighten the button next to it. See the table below for further information on the tools available.
Button | Name | Description |
|---|---|---|
| Original size | This button resizes the report to a smaller size. You can switch between the small or big size of the report. |
| Fit size | This button increases the displayed size of the report (enabled by default). |
| Display chart | This button displays only the report chart. In the case of multiple charts, a popup will appear allowing you to select from the available charts to be displayed. Click here for more details. |
| Display table | This button displays the report table. Fits to the size of the placeholder, and can be scrolled horizontally and vertically if required. |
| Display canvas | This button displays the report canvas (disabled by default, and only available if the added report has a canvas). Size limit: 700 pixels wide x 600 pixels long. |
| Filters | If your report contains user prompt filters, you can create filtered reports directly from your story with this button. Read more about these reports in the content earlier on this page. |
| Maximize | This button redirects you to the report output page, where you can edit the report and re-publish it, if required. The changes will be reflected in a live report added to the story. You can also use this to replace the report with a snapshot or bookmark, or add another item from the same report to your story. Closing the report output page takes you back to editing your story. Learn more here. |
Most of the buttons above are easy to use and don't require steps. However, the last few are described in more detail.
...
| Anchor | ||||
|---|---|---|---|---|
|
Apply filter values to an embedded report
Prior to Yellowfin 9.6, a bookmark was the best way to embed report data with certain filter values always set. Yellowfin 9.6 introduced embedded reports with the option of updating user prompt filters directly from your story, as described earlier on this page.
To use this functionality, your report have must at least one user prompt filter activated. Reports with one or more user prompt filters will display the Filters ![]() button in the pop-up menu for embedded reports.
button in the pop-up menu for embedded reports.
- Ensure your embedded report or chart has at least one user prompt filter activated
- Hover over your report to display the pop-up menu for embedded reports
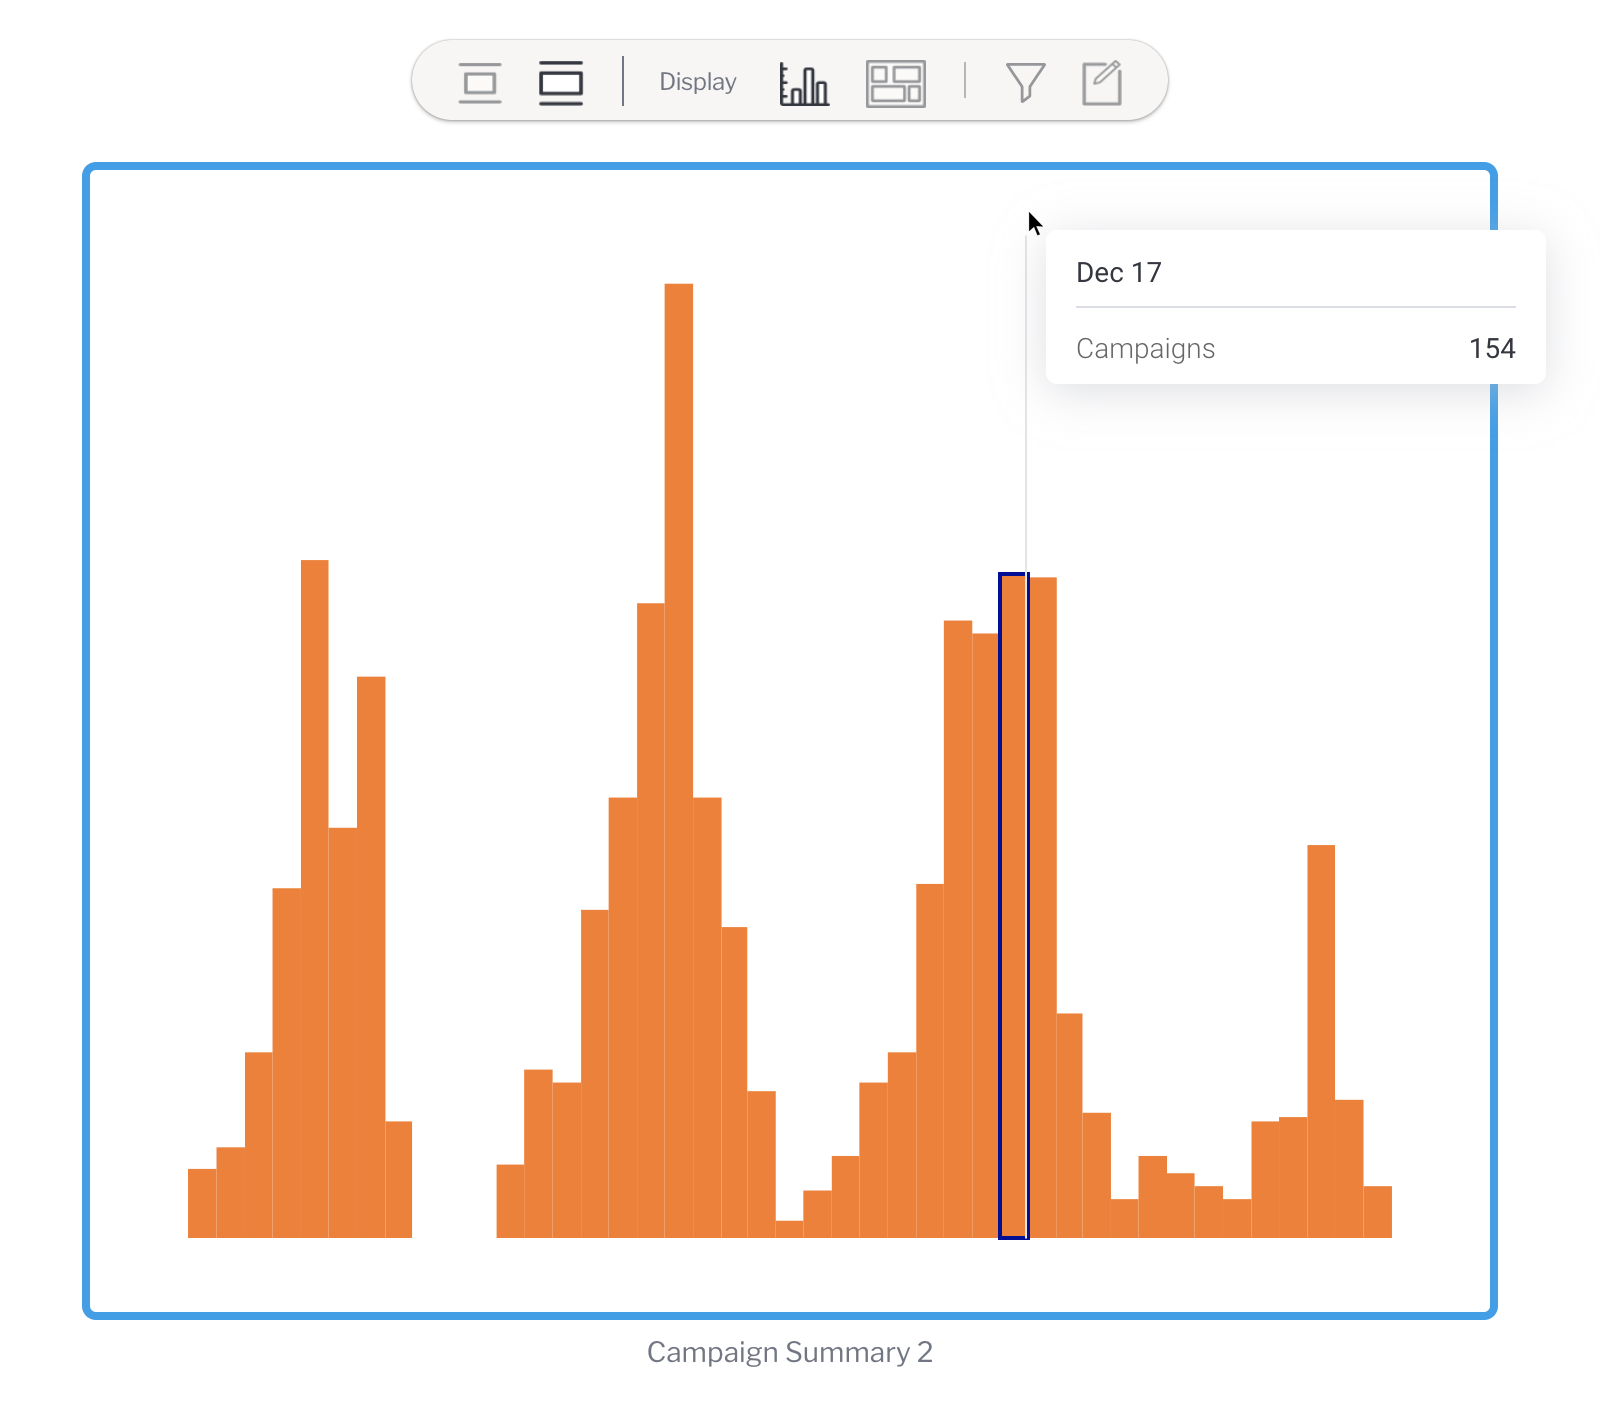
- Click on the Filters button on the pop-up menu
Any available user prompt filters will be displayed on a scrollable panel on the right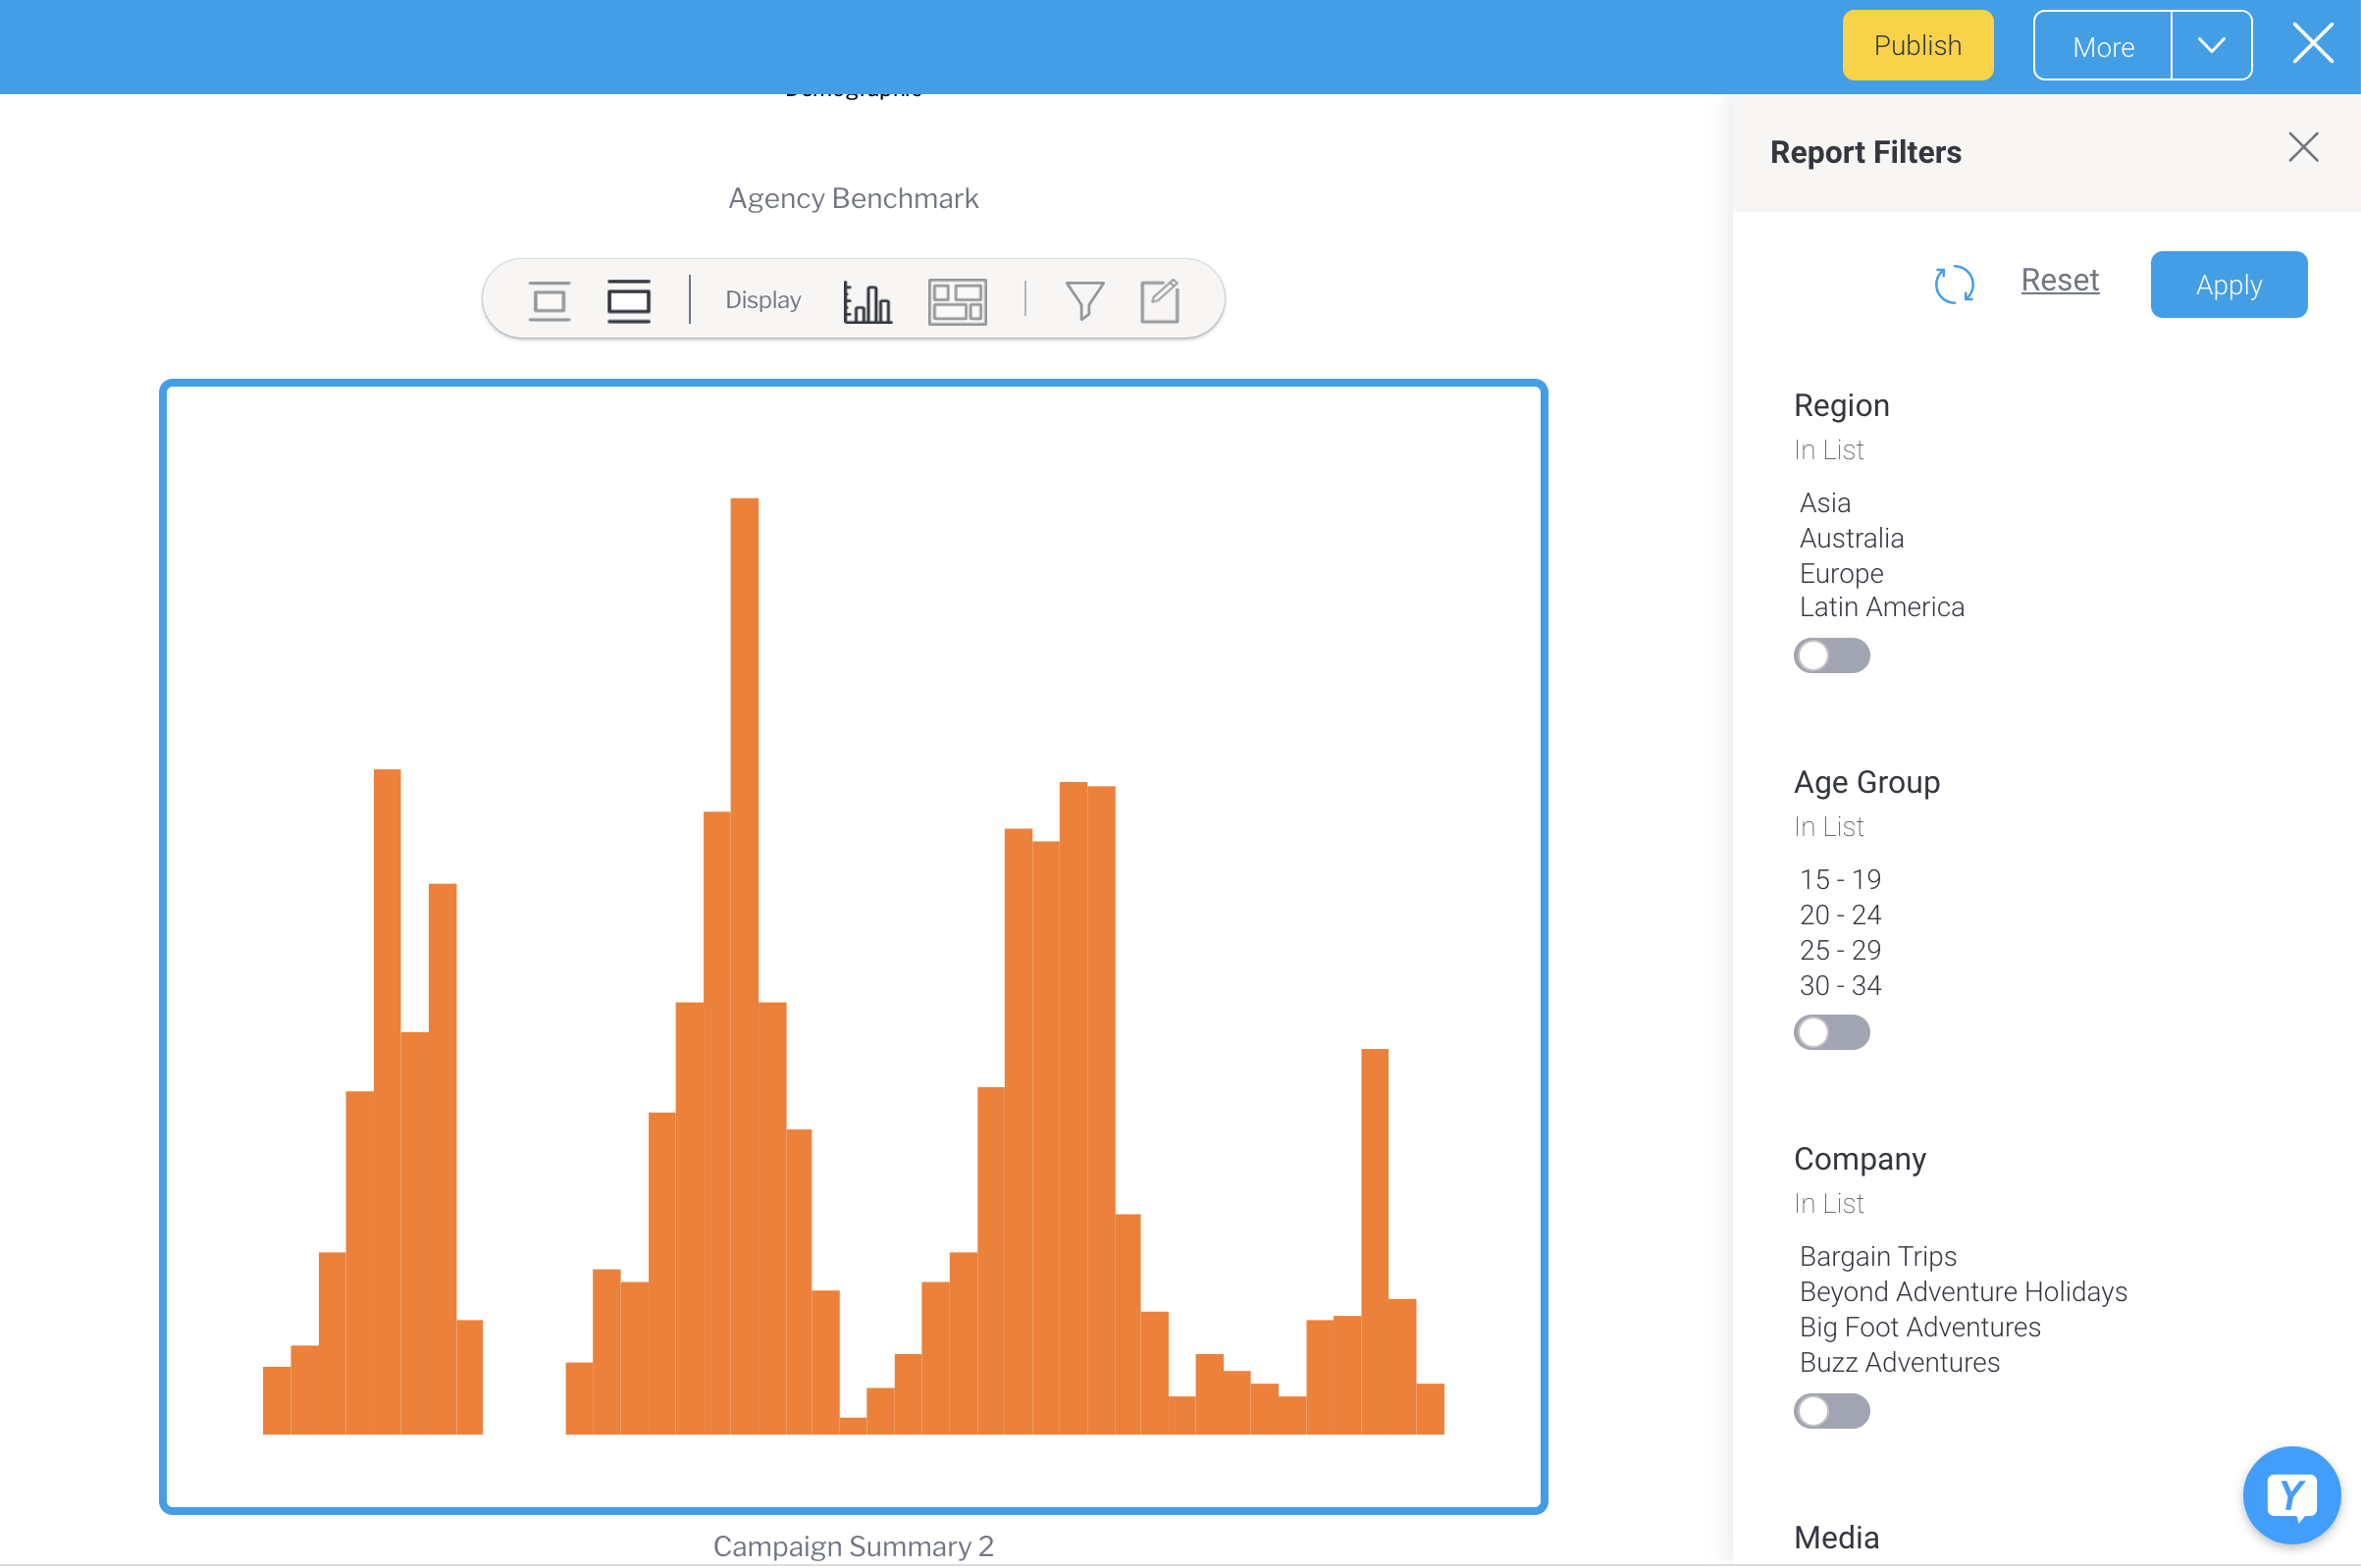
- Adjust one of the report filters to see the effect on your chart, then click on the Apply button
In the example below, we've selected just the age group of 20-24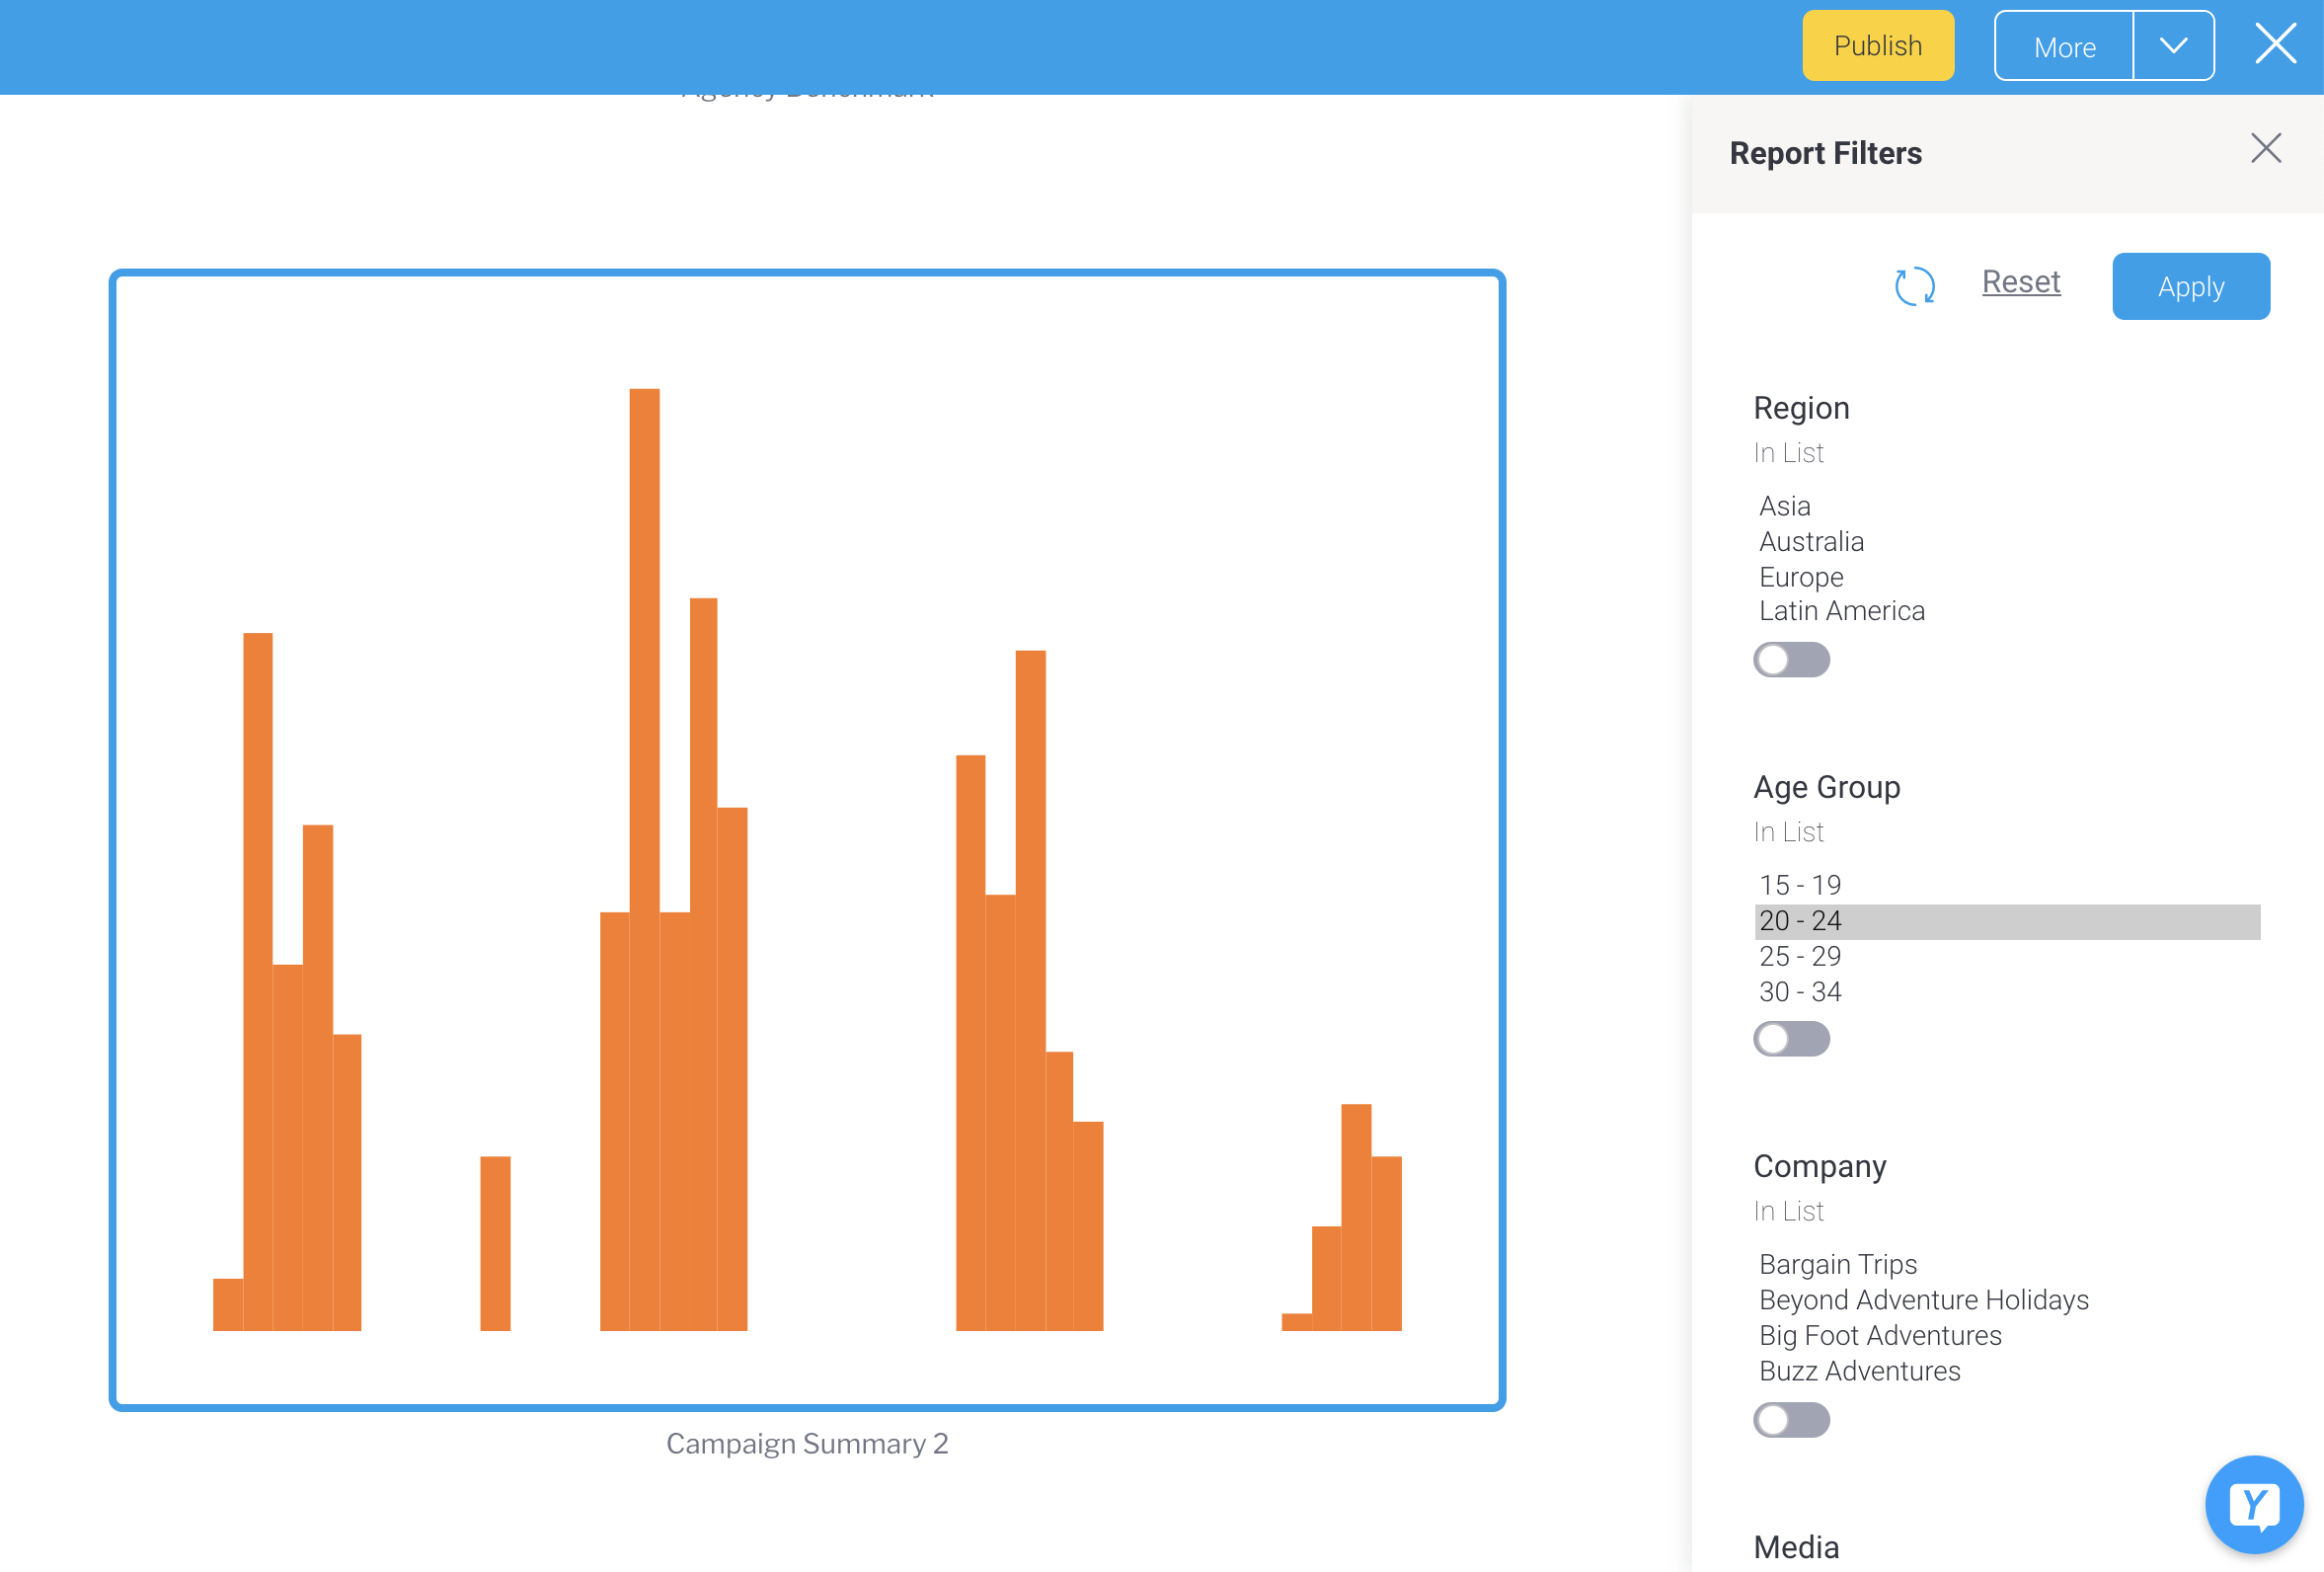
Even if you change the default filter values in the original report, the display of the report embedded in your story will retain the values of any filters you have already set using these steps.
...
| Anchor | ||||
|---|---|---|---|---|
|
Replacing reports
Report items, such as live reports, snapshots and bookmarks can be replaced within a story at any time.
- Place your cursor over the report item you wish to replace
- Click on the Maximise button
 , which will redirect you to the report's output page
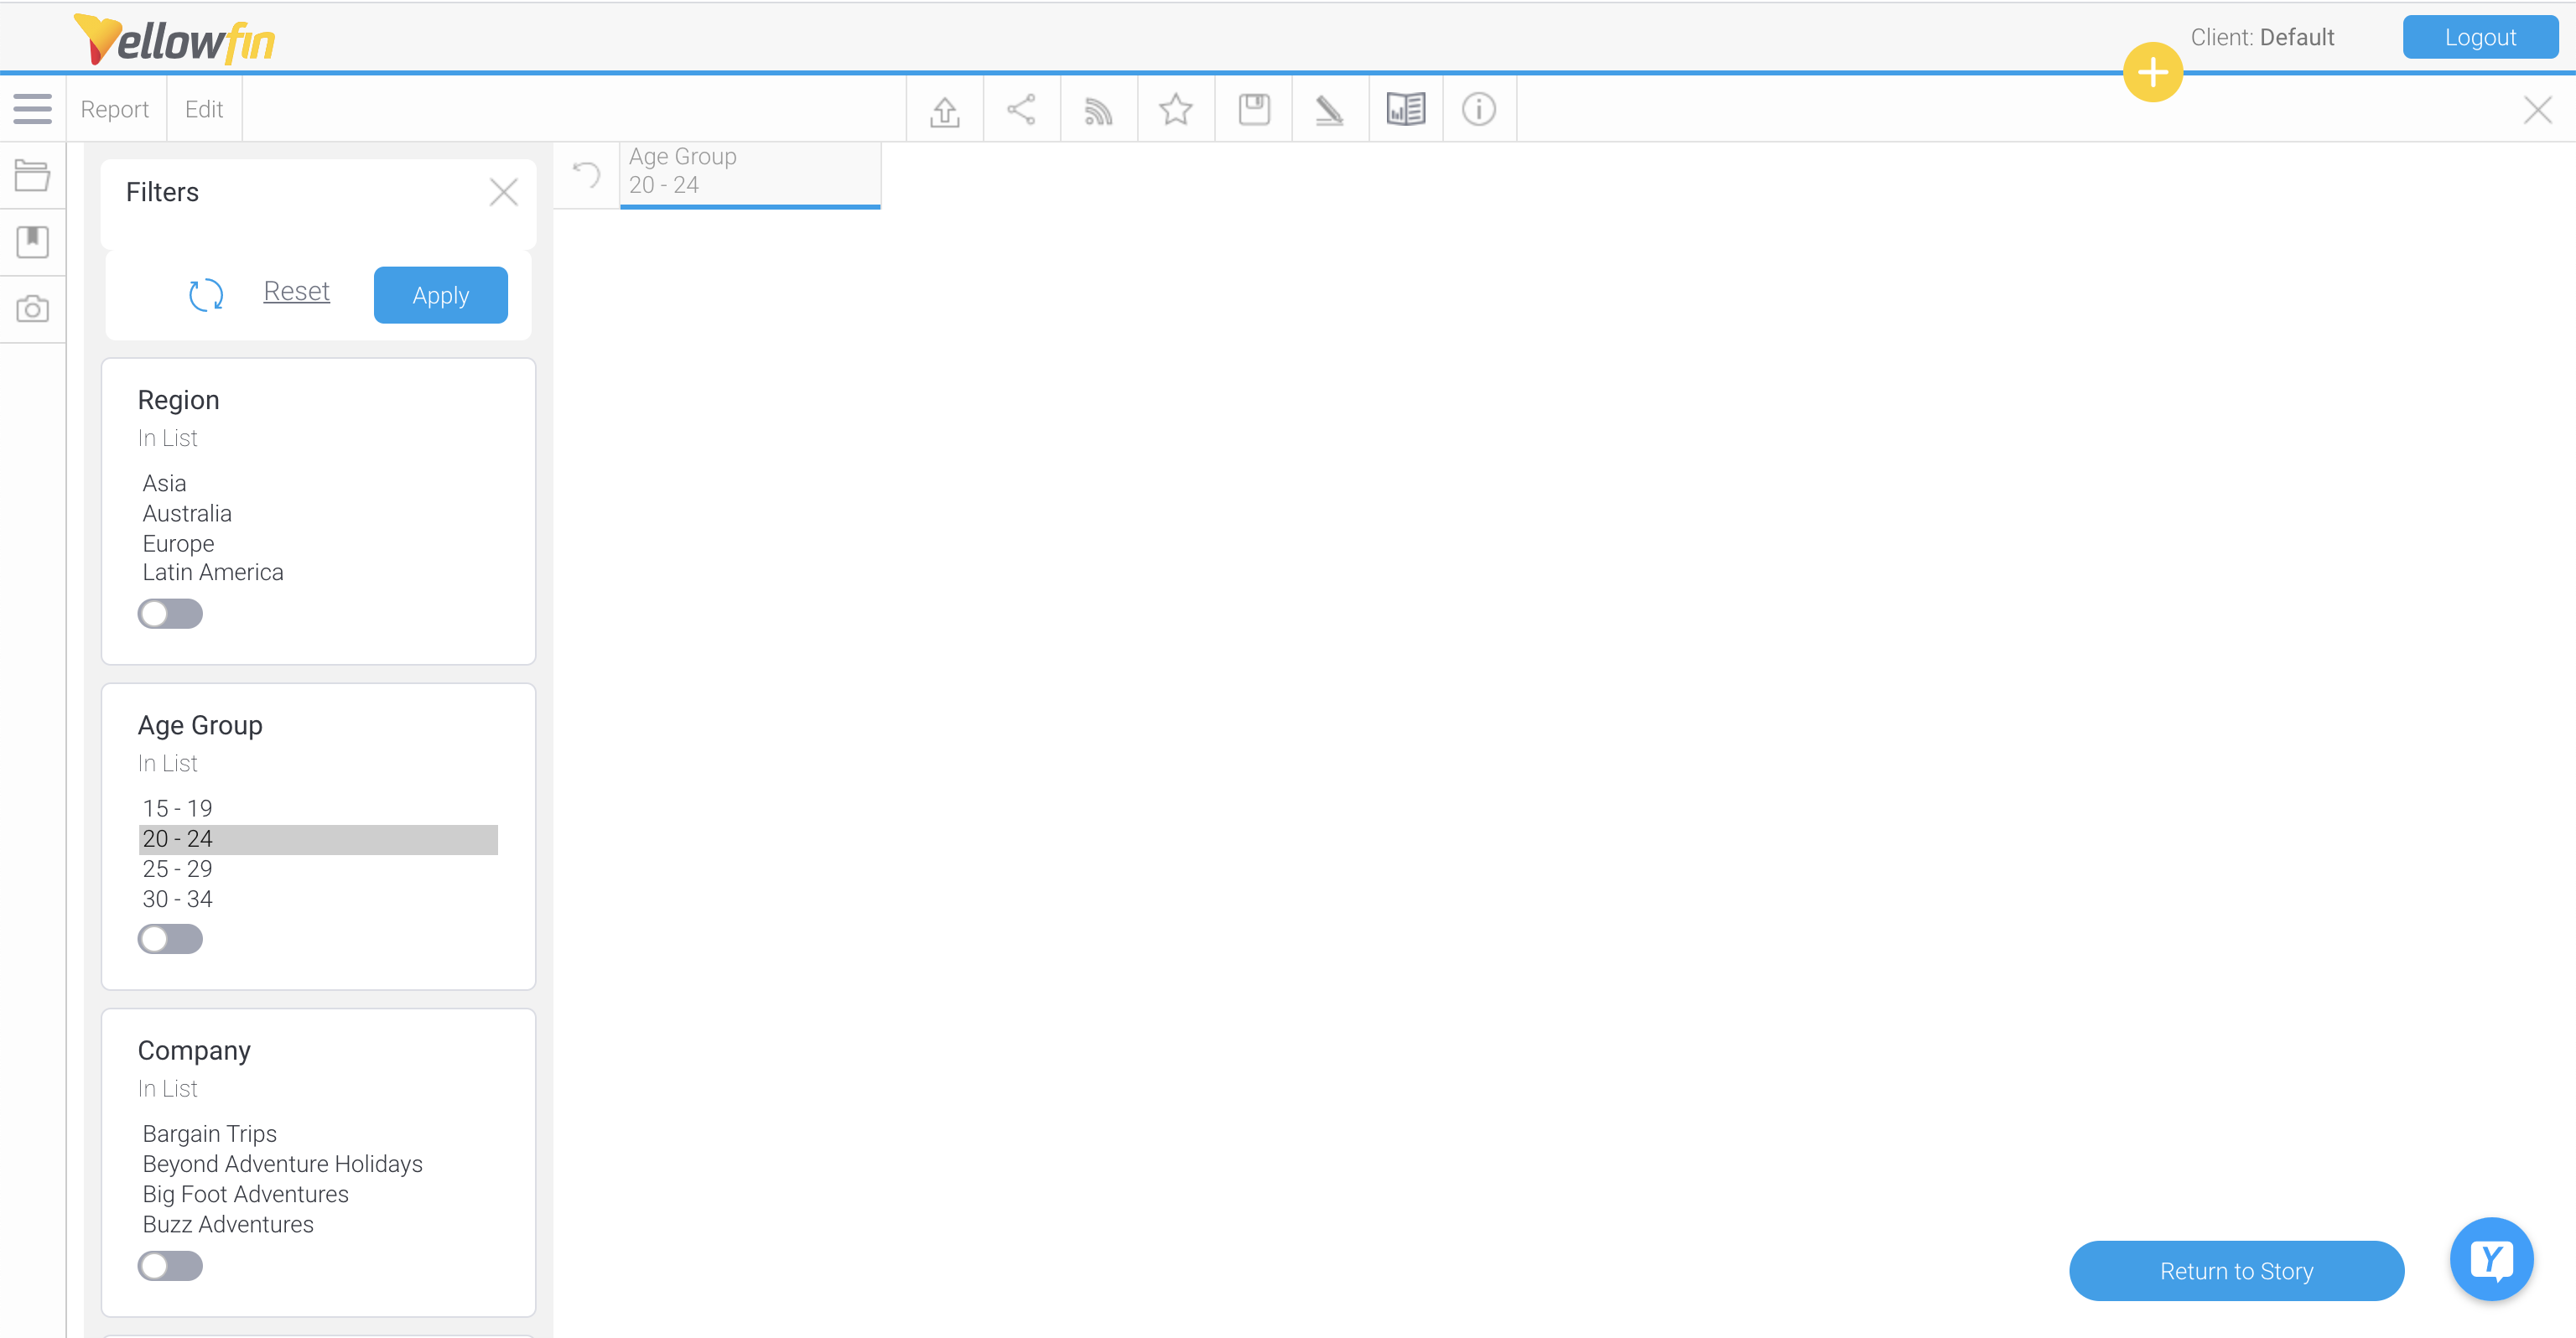
- From here, you can replace the existing report item with a snapshot, bookmark or report by choosing an existing one or creating a new one
- For example, to replace the current chart with an existing snapshot, click on the Snapshot button, then hover over the snapshot to be added, then click on the +Story button
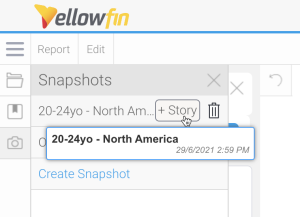
You will be prompted to either replace the existing content or add the snapshot to the end of your story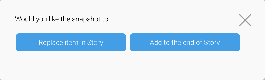
- Click on the Replace item in Story button to replace the existing item in the story with this snapshot, or click on Add to the end of Story to add the snapshot to the bottom of the story (without replacing the existing report item)
- Repeat the steps above to add any other items from this report that you wish to include in your story
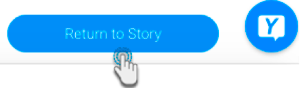
- Once done, click on the Return to Story button to exist the report's output page and return to your story
Your new report item will now be displayed in your story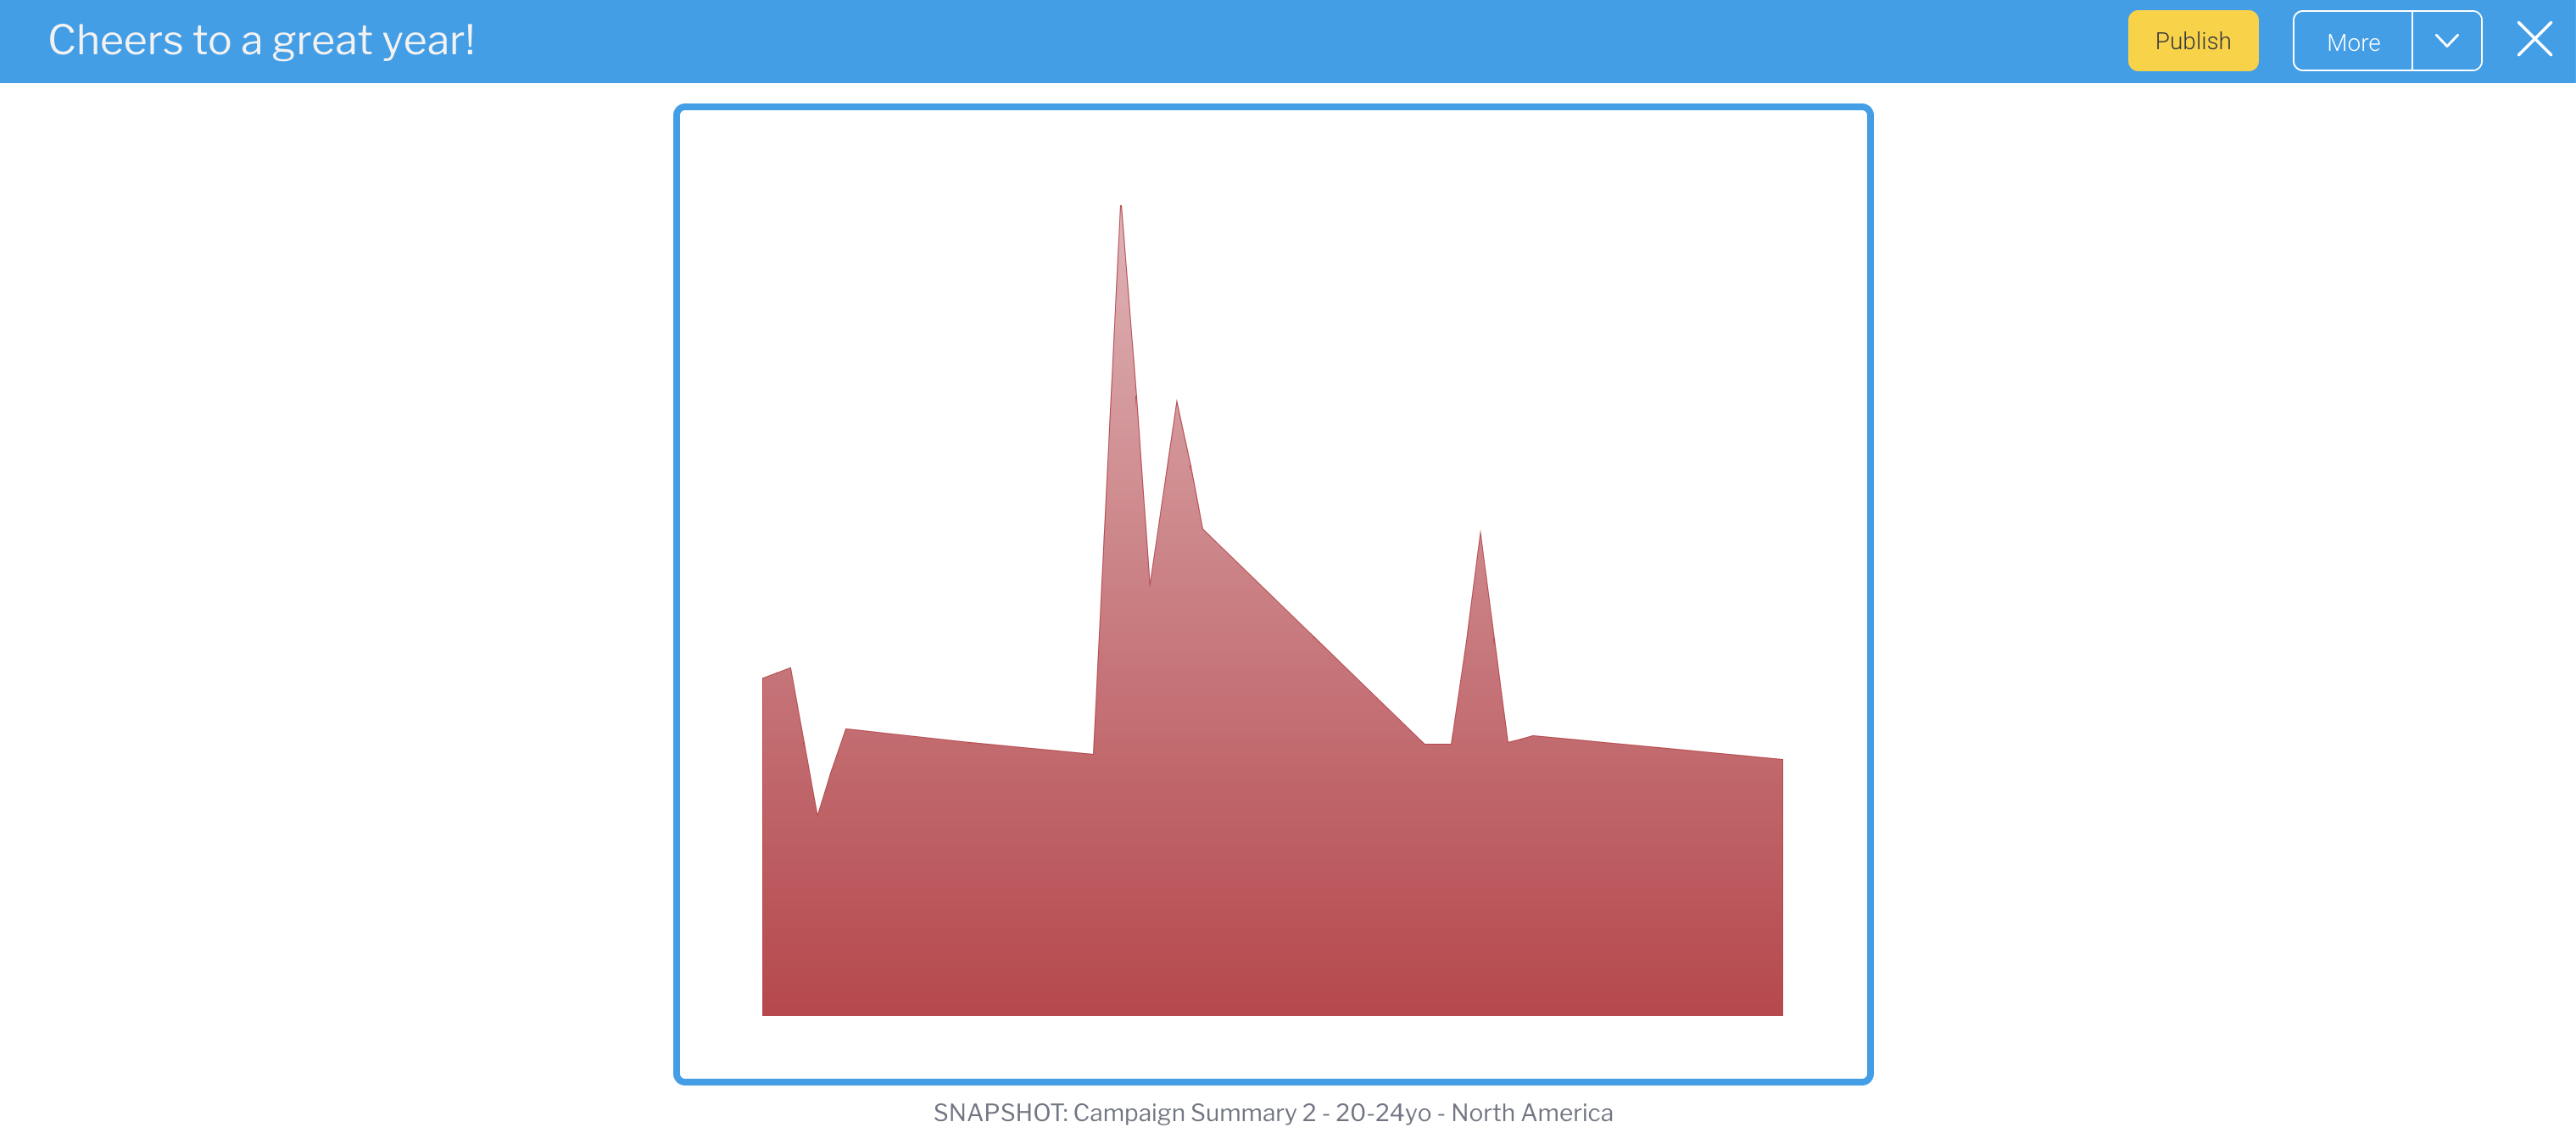
...
| Anchor | ||||
|---|---|---|---|---|
|
Changing chart selection
If your report includes more than one chart, you can change which one is displayed when embedded in a story.
- Hover over a report, and when the menu appears, click on the chart button
- In case of multiple charts, a popup will appear
- If this screen is display, choose the chart you wish to include, then click on the Insert to Story button
The story content will update to display the chart you selected instead.
| Tip |
|---|
You can change back to the report table by clicking on the the Display Table |
...
Sharing hidden content
If you add a secure report that is inaccessible to all your readers, the the story will display a placeholder instead of the report, with a message notifying them of the reason they can't view the report content. See the example below: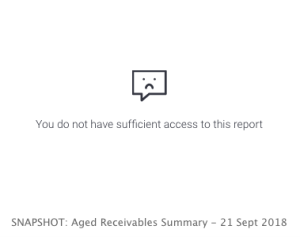
...
Creating a new report
You can create a new report directly from stories by using the Create new report button. If you opt to do this, the live report will be automatically added to the story when you publish it. You can then navigate back to your story by clicking on the Return to Story button at the bottom right corner of the Report Builder page. 
Note: while this report is being created, and until it is activated, story author and collaborators would see a placeholder in place of this report. To get back to the report while editing your story, click on the Maximise ![]() button for this placeholder.
button for this placeholder. 
...
| Anchor | ||||
|---|---|---|---|---|
|
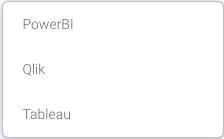
Inserting content from other BI tools
You can incorporate reports from other reporting tools, such as Tableau, PowerBI, or Qlik, into your Yellowfin story. All you need is the report URL to embed the report. The URL must match the reporting tool and must be valid to display the report.
| Note | ||
|---|---|---|
| ||
Before you begin, ensure that you have a proper Yellowfin license that supports the Stories tool and the external content add-on. Users who wish to embed external reports also require an additional user role function, External Content, to be enabled. |
Follow the steps below to add a report from external BI tools.
Click on the plus button at the start of a new line (if you don't see this button, click on a new line: the button will only appear if no text is entered)

Select the Reporting tools button from the pop-up menu

This provides you with a selection of available reporting tool choicesSelect a report type from the list that matches the content you'd like to embed in your story (if you select the wrong one, an error will occur when you try to insert the link in the next step)
A popup menu will appear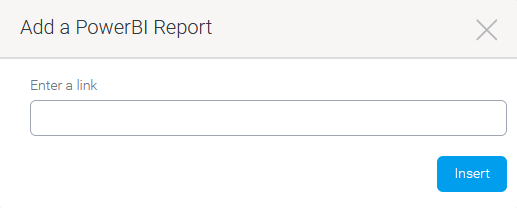
Paste the shareable link to your external report here — and make sure you have provide the correct link for this to work: if you accidentally provide a link to a PowerBI report while choosing the Tableau option, an error will occur
Click on the Insert button
Once the report appears on the screen, you can resize it, if necessaryTo resize the report, hover overit, and when the resize option appears in the bottom right corner, click and drag it to change the size of the embedded report
If you wish to add a caption, click directly under the report to update the grey text
...
Other story content
Besides text and reports, you can include additional content such as images, videos and even dividers into a story.
| Anchor | ||||
|---|---|---|---|---|
|
Adding an image to a story
Use the Image Manager to locate, manage and add images to your story. See the table at the end of this section for a full description.
- Click on the plus button at the start of a new line. If you can't see the button, click on a new line: the button will only appear if there is no text already entered.

- From the pop-up menu that appears, click on the Add an image button.

The Image Manager dialog box will appear. From here, you can select an existing image, upload a new image, manage corporate images and your own images, sort and search for images and much more.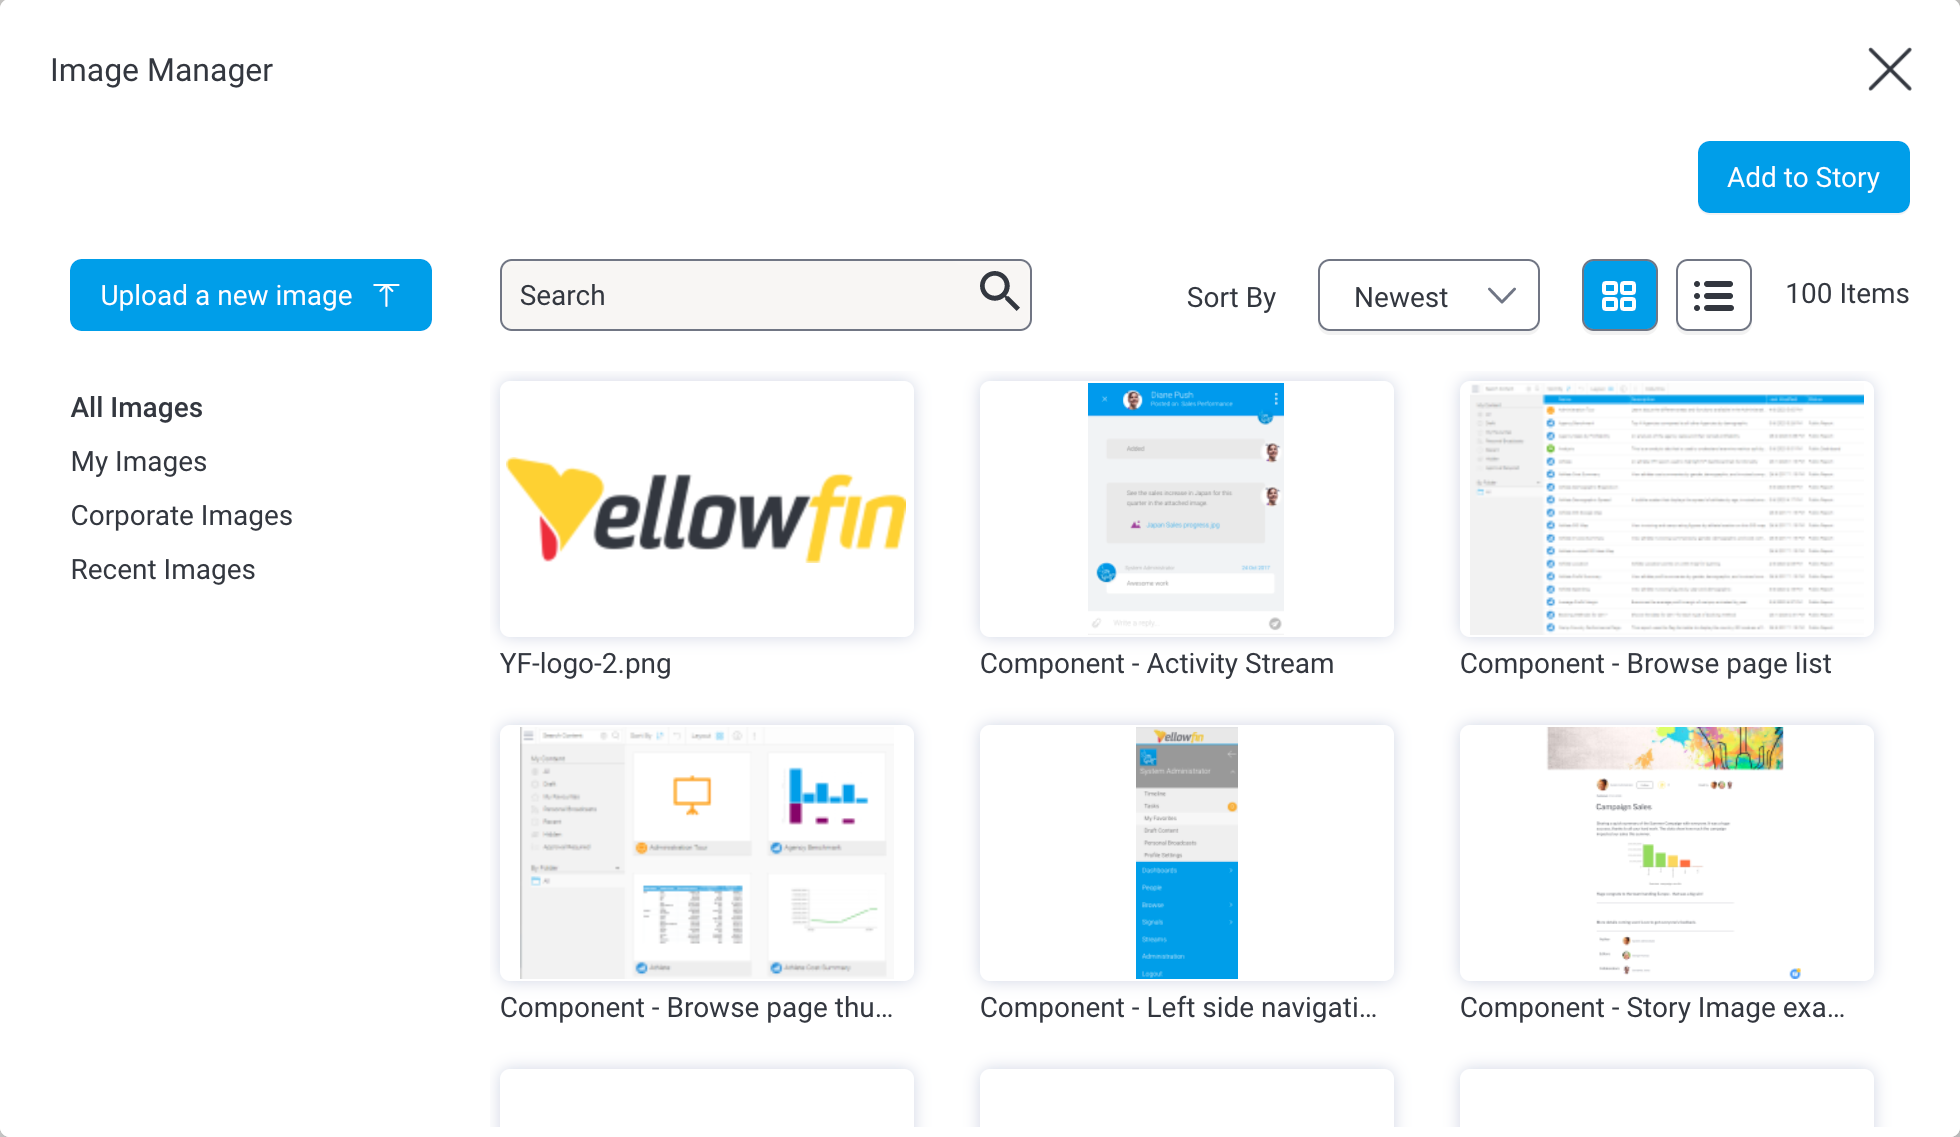
- Locate the image you wish to add and click on it, then click on the Add to Story button.
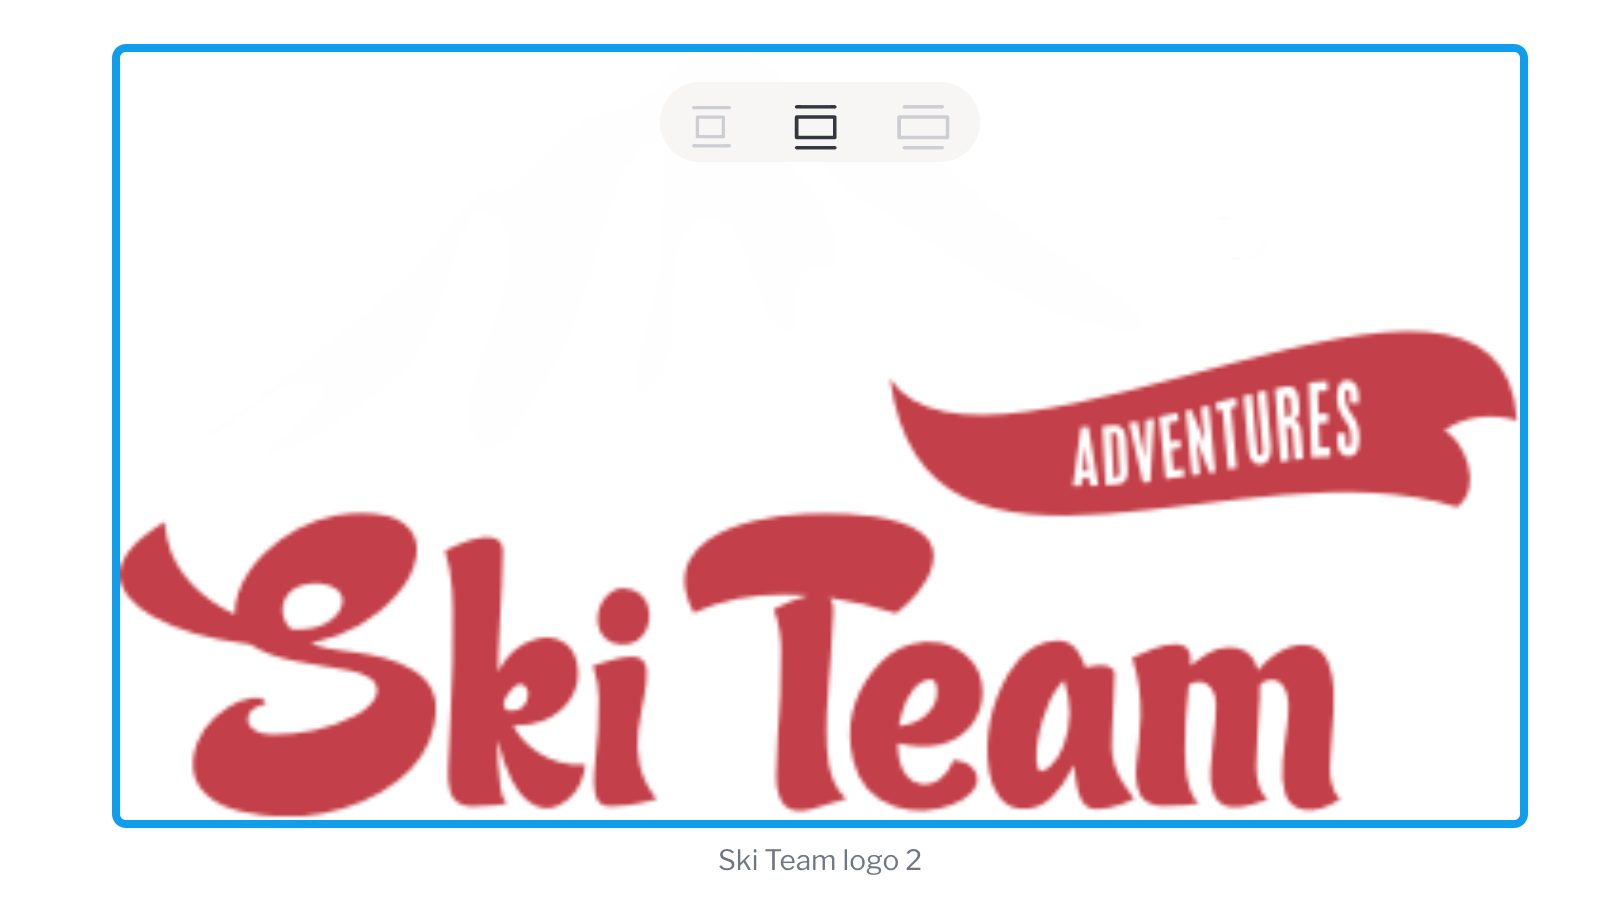
- Once added, resize the image using the options displayed at the top of the image. See the chart below for a description of the options available.
- If you wish to edit or remove the caption that appears below the image, click on the text to edit it.
Image resizing options
Icon | Size option | Description |
|---|---|---|
| Original | Displays the image in its actual size. This option is only available if the original image width is less than 700 pixels. |
| Fit | Displays the image to fit the story size, which is 700 pixels (that is, the image width will be stretched to 700 px while maintaining the aspect ratio). The image is displayed in this size by default. |
| Wide | The maximum size an image can be displayed in. (This option will stretch the width to 900 pixels, while maintaining the aspect ratio.) |
Image Manager options
The Image Manager provides a range of tools for fast and easy management of image files within Yellowfin. See the table below for more details of each of its features.
| Feature | Description |
|---|---|
| Click on the Upload a new image button to upload a new image. Only valid image formats such as JPEG, PNG and GIF can be uploaded. |
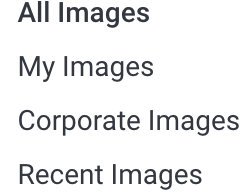
| Click on All Images to see all images, and Recent Images to see the most recently used images. Click on My Images to see images you have uploaded. Other users cannot see your images listed in their Image Manager. Click on Corporate Images to see the current pool of corporate images. By default, the Corporate Images folder is read-only for all user roles. To make it accessible to users, system administrators need to edit the relevant user role, expand the Administration section and click on the checkbox for Save Corporate Images. |
| Use the search bar to refine the list of images — useful for anyone who has built a substantial library of images and knows what they're looking for. Type some text and use your Enter key to see the results of your search. |
| Hover over the top right corner of any existing image and click on the blue circle to see an enlarged version of the image. |
| Change the sort order between alphabetic and newest/oldest by clicking on this dropdown. |
| Change the display of images between thumbnail view and list view. |


| Info |
|---|
The Image Manager contains a variety of tools that you might like to take advantage of, including storing images in the Corporate Images area and globally updating images. See our Dashboard Images page for more info. |
...
| Anchor | ||||
|---|---|---|---|---|
|
Embedding a video within a story
You can embed Youtube or Vimeo videos into your story. Here's a simple procedure that explains how to do this:
- Click on the plus button at the start of a new line. (Note if you do not see this button, simply click on a new line. The button will only appear if no text gets entered.)
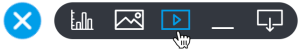
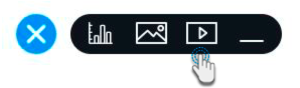
- Select the video icon.
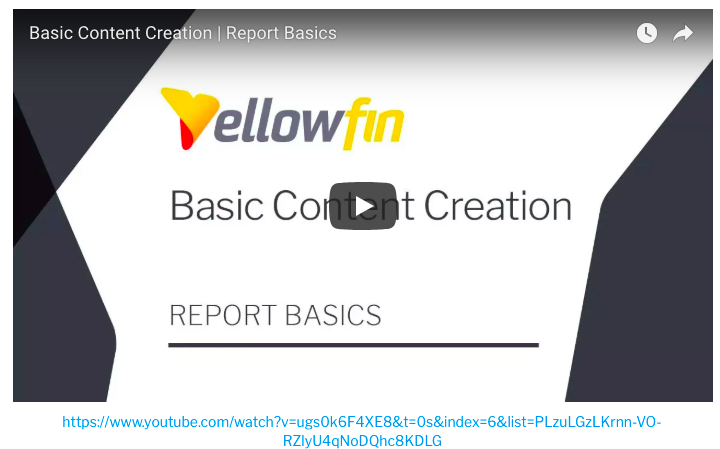
- Copy the link from either video platform, and paste it in the area specified. Press the Enter key.
- The video will be displayed, and captioned with the link. You can edit or remove the caption.
- To delete the video, simply select it and press the Delete key.
Note: Although the video image will be displayed in a story while in draft mode, it can only be played when the story is published.
...
| Anchor | ||||
|---|---|---|---|---|
|
Adding a divider
Include a divider in your story to display a horizontal line that's used to divide your story content.
...
Other Story Content
Besides text and reports, you can include additional content such as images, videos and even dividers into a Story.
...
Adding an image to a Story
...
Image resizing options
...
Icon
...
Size option
...
Description
...
![]()
...
Original
...
Displays the image in its actual size. This option only appears if the original image width is less than 700 pixels.
...
![]()
...
Fit
...
Displays the image to fit the Story size, which is 700 pixels (that is, the image width will be stretched to 700 px while maintaining the aspect ratio). The image is displayed in this size by default.
...
![]()
...
Wide
...
The maximum size an image can be displayed in. (This option will stretch the width to 900 pixels, while maintaining the aspect ratio.)
...
Embedding a video to a Story
You can embed Youtube or Vimeo videos into your story. Here's a simple procedure that explains how to do this:
- Click on the plus button at the start of a new line . (Note if you do not see this button, simply click on a new line. The : the button will only appear if no text gets entered.) Select the video icon.
- Copy the link from either video platform, and paste it in the area specified. Press the Enter key. The video will be displayed, and captioned with the link. You can edit or remove the caption.
- To delete the video, simply select it and press the Delete key.
Note: Although the video image will be displayed in a Story while in draft mode, it can only be played when the Story is published.
...
Adding a divider
Include a divider in your story to display a horizontal line that's used to divide your story content.
...
- is entered)
- Click on the Divider button

- A horizontal line will appear in your story
...
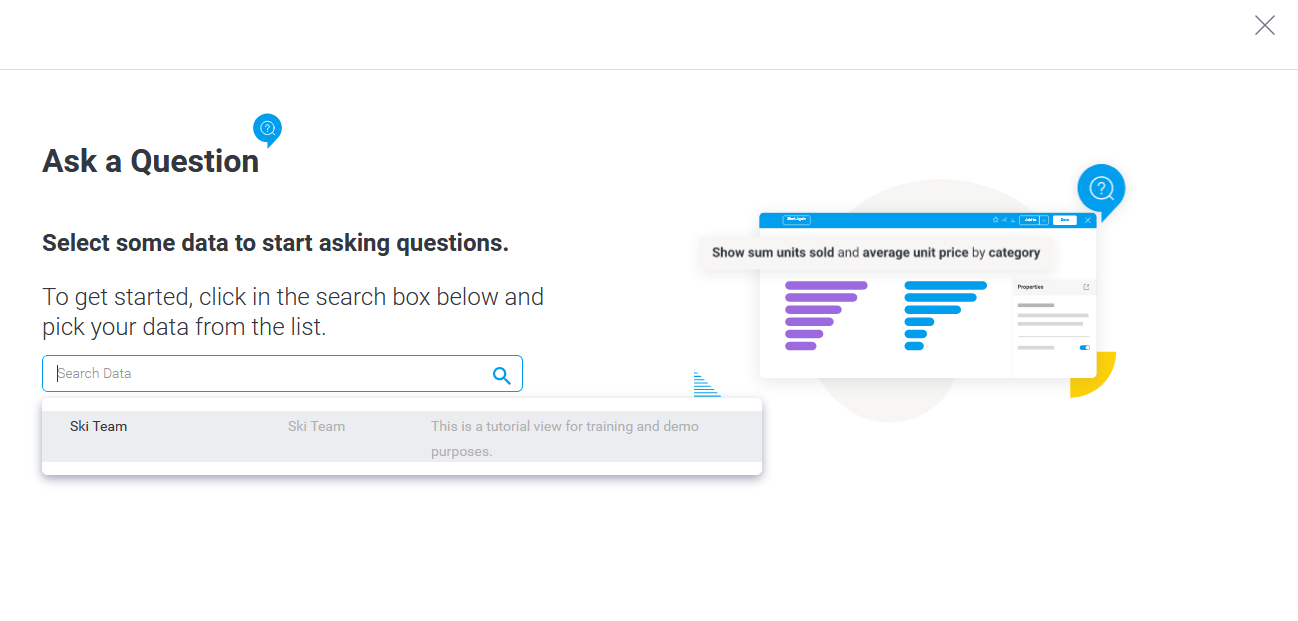
Add data to your Story using NLQ
- Click on the plus button at the start of a new line (if you do not see this button, click on a new line: the button will only appear if no text is entered)
- Click on the Question mark button
![]()
3. Use NLQ to ask a question and create a report or chart. Once finished, the data will be added into your Story. Read about how to use NLQ here.
...
Restructuring story content
Once you have added content, such as text, reports, images, or videos, you can drag it to another part of the story. This gives you freedom to restructure your story content after adding it (even highlighted text), saving you the trouble of redoing your story.
A drop indicator will show you the exact location you’re dropping the content to.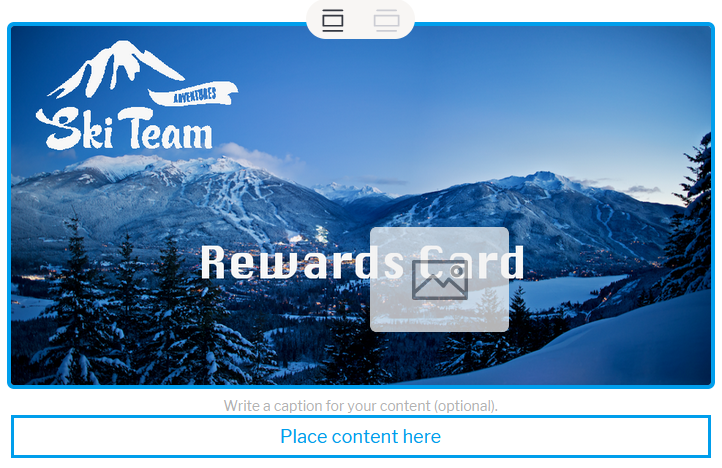
...
...
| Anchor | ||||
|---|---|---|---|---|
|
Deleting
...
content
You can delete an any attached content, such as a report, image, video, etc, by selecting the item and pressing the backspace or delete key.