Page History
...
Marking a published dashboard as a favorite will add its tab on the main dashboard page.
Every time a user opens a published dashboard (that is not already added as a favourite), the system will ask them the following message.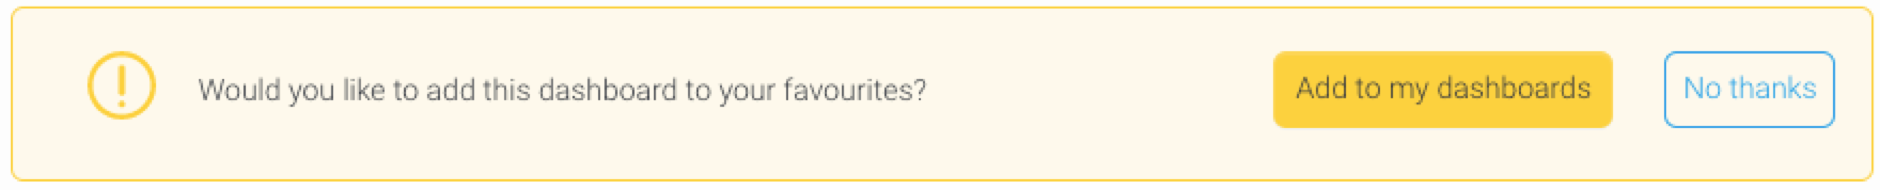
...
If too many dashboards are added to the main page, a More Dashboards drop down will appear.
...
Dashboard
...
subscribers
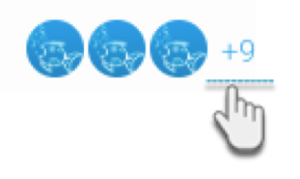
All users who have marked a dashboard as favorite will appear on top of the dashboard. To see a full list of who these users are, click on the number next to the user avatars.
...
| Anchor | ||||
|---|---|---|---|---|
|
Dashboard access
Yellowfin Dashboards can be made secure to ensure only trusted users have access to it. This can be determined by icons that shows the user access level of the dashboard. Following is a description of these.
...
- Click on the access icon. It will bring up the following popup.
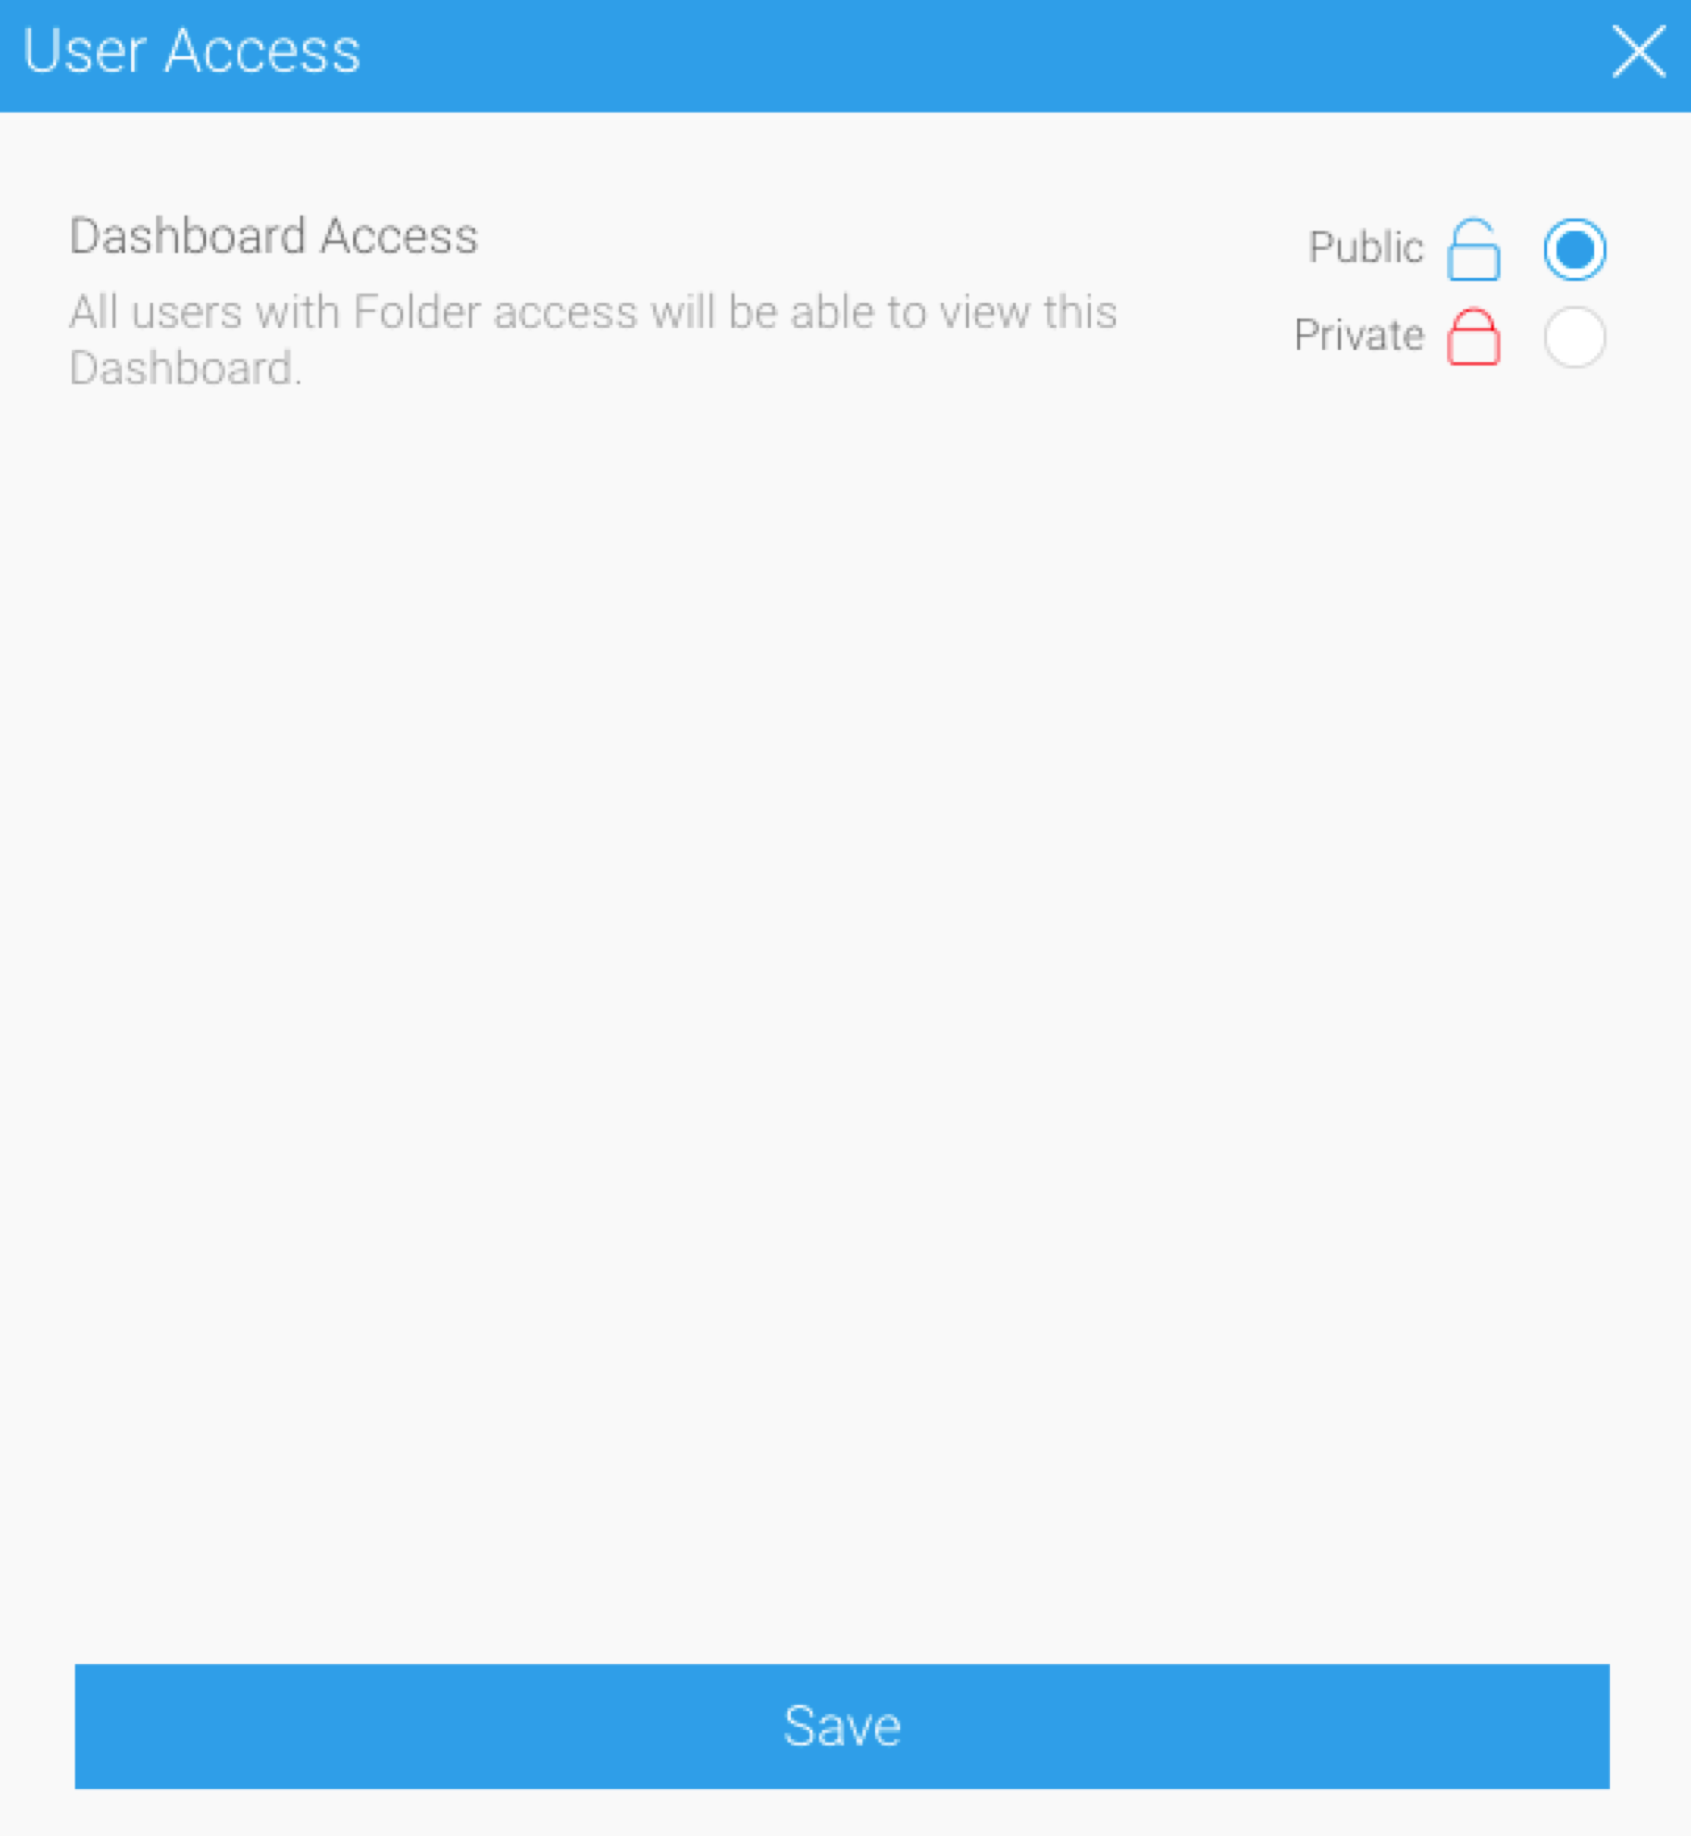
Select an access setting (see above for a description of each).
If making a dashboard private, select users who can access the dashboard.
Warning If a public dashboard that has subscribers (that is, users who have marked the dashboard as a favorite), is made private, then all the subscribers will lose access to it.
Click Save to update the settings.
...
Dashboard sharing
Published dashboards can be shared easily with other users, without first going into edit mode. This is done through a Share button that is only available to users with access to share.
Click on the Share button on the top-right corner of a dashboard. The following popup will appear.
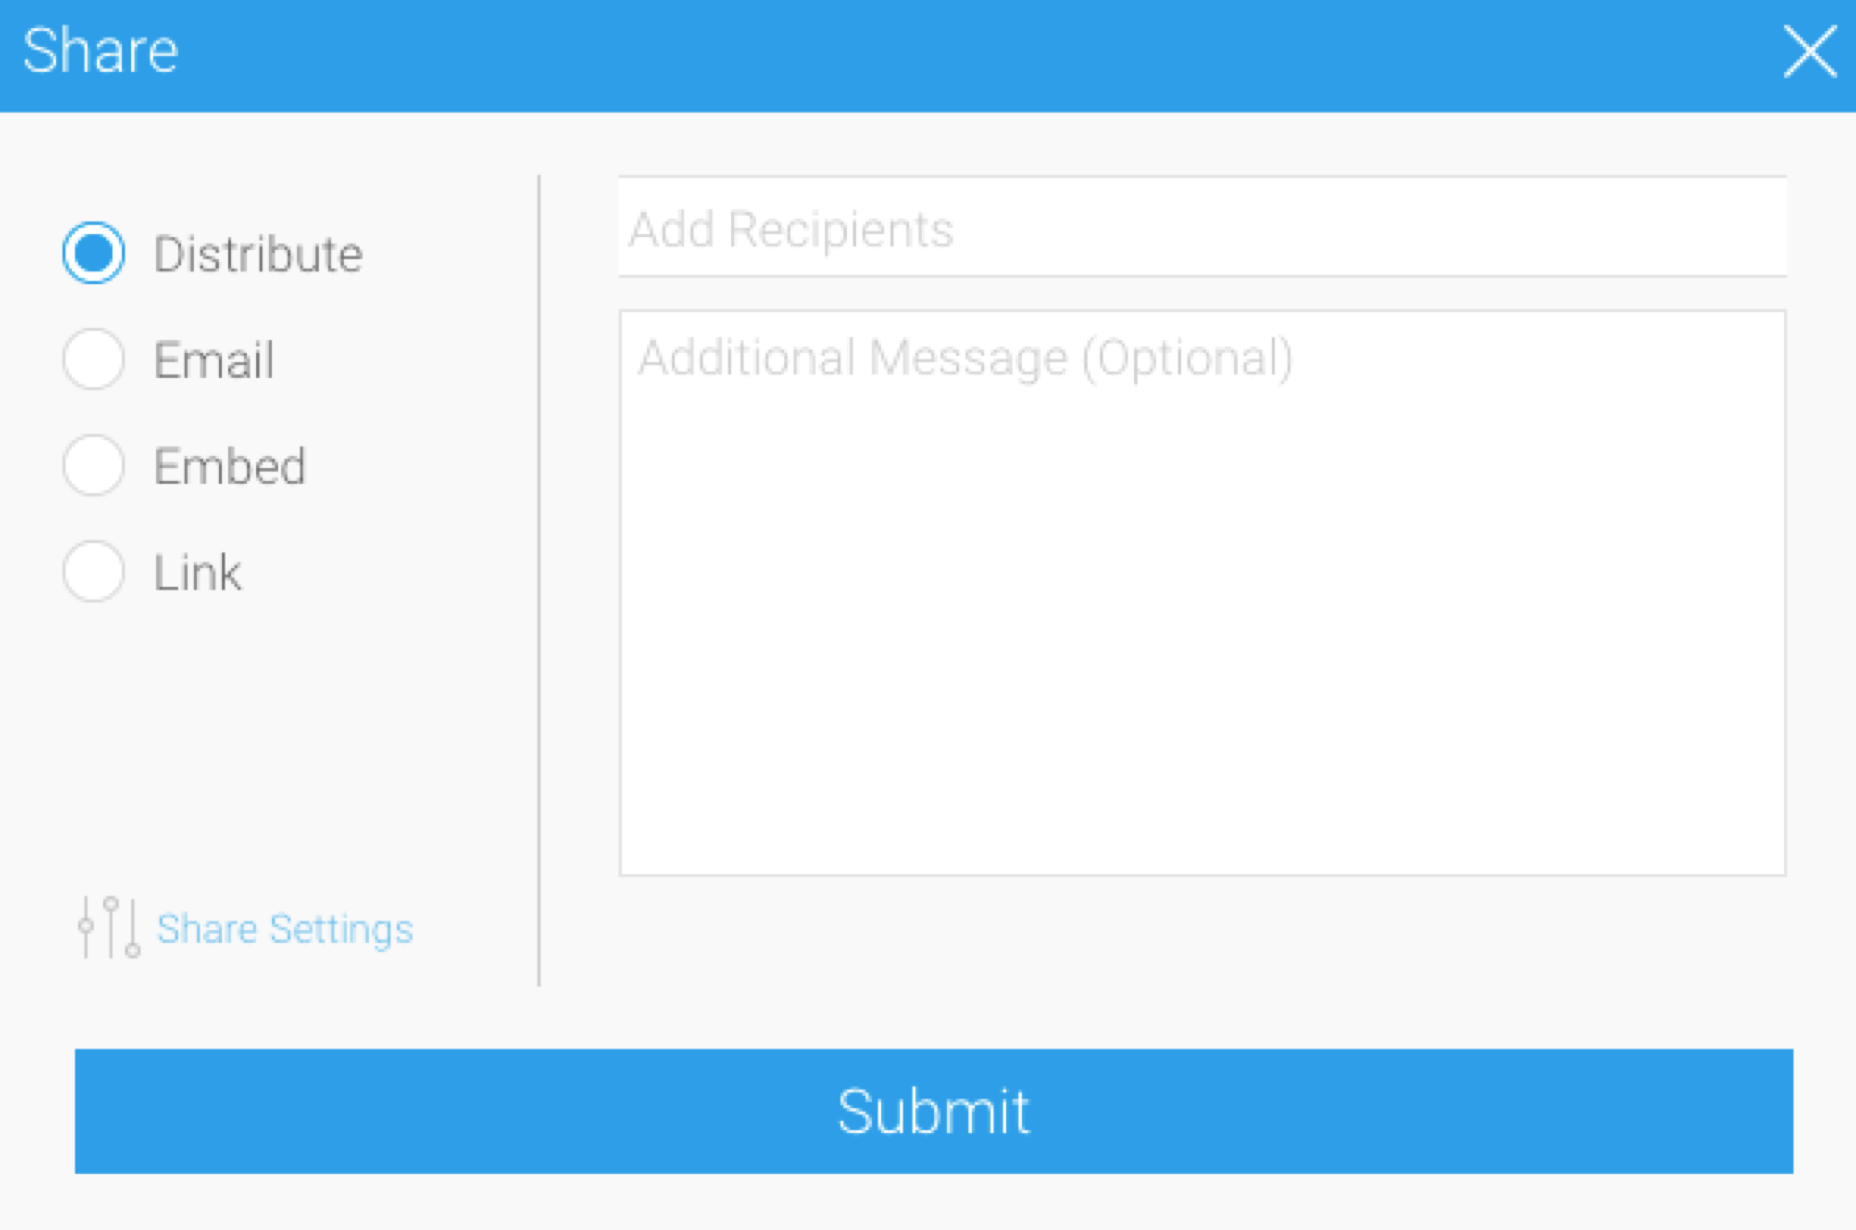
Use any of the options to share a dashboard. Here’s a quick description of each:
Option | Description |
|---|---|
Distribute | Allows the user to share the dashboard on another user's Timeline. |
Allows the user to send the dashboard to another user via a one-off email. | |
Embed | Allows the user to embed the dashboard into an HTML, wiki, or blog page. |
Link | Allows the user to share a link to the dashboard. |
...
| Anchor | ||||
|---|---|---|---|---|
|
Full Screen
Click on the fullscreen button to open a published Dashboard in full screen. 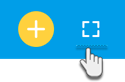
Whilst in full screen, other control buttons on the Dashboard will not be available. This includes dashboard subscribers, security options and the Share button.
To close the full screen, simply press the Escape key.
...
| Anchor | ||||
|---|---|---|---|---|
|
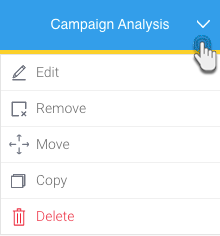
Dashboard menu
...
| Section | ||||||||||||||||||
|---|---|---|---|---|---|---|---|---|---|---|---|---|---|---|---|---|---|---|
|
Applying Filters to a Dashboard
If a dashboard has filters, you can use them to filter reports by a set of values. For example, a region filter will allow you to consume region-specific data on the same dashboard.
To apply filters to your Dashboard, simply choose the filter values, and click on the Apply button at the bottom of the filter panel.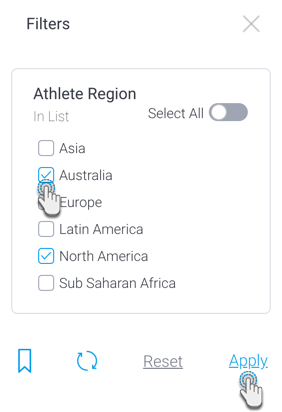
You may also reset the applied values to bring the Dashboard back to its original state.
Filtered Reports
You can apply filters to a published dashboard report, and navigate to the report page by clicking on the open report button (shown below). You will then see the filtered report.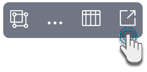
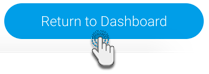
To return to your dashboard, click on the Return to Dashboard button in the bottom right corner of the screen.