Page History
Table of Contents maxLevel 4 class contents
Getting started in Code Mode
...
Once Code Mode has been enabled and you edit a dashboard, you will see this toggle in the dashboard toolbar:

Clicking on “Code” will take you to Code Mode.
...
The HTML tab shows the current canvas tab represented in HTML. Each item on a canvas has a corresponding HTML tag.
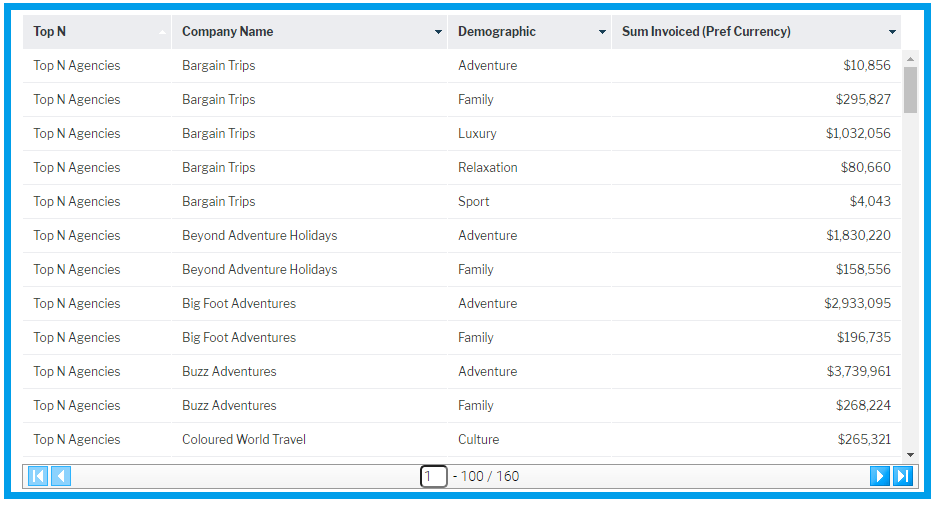
The following canvas has 2 two elements on it . A Report — a report and a Rectangle rectangle used as a border:
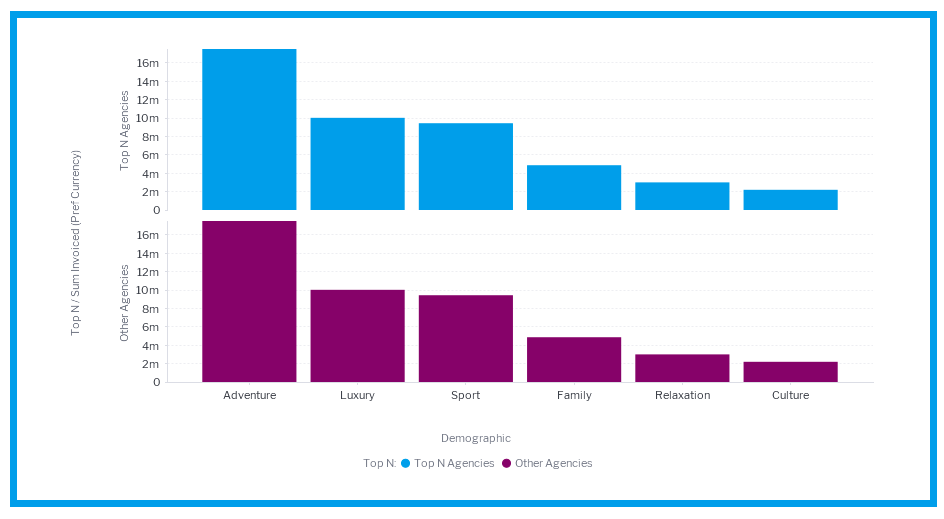
The HTML for this canvas is as follows:
<canvas-area xmlns="http://www.w3.org/1999/xhtml" canvas-uuid="aee7c574-3ad3-4ac0-a366-7810861d91eb"> |
publish-uuid="ffe09245-8739-416c-b039-05fff6427242" report-uuid="c83357db-8aef-4ec7-ab72-fce34de9ee77" height="475" top="46" left="54" name="Agency Benchmark" width="897" display-type="CHART" chart-uuid="a9aba052-51b5-47b1-b311-2c0cc3abd932" on-click="none" style="z-index: 3;"></report-output> |
publish-uuid="d0fafeb9-57a8-4a21-ab6c-844501ebf50b" width="927" height="496" top="35" left="36" rotation="0" name="Rectangle" stroke-color="#009eec" fill-color="#ffffff" on-click="none" style="z-index: 2" stroke-width="14" fill-opacity="100"></canvas-rectangle> |
Any changes that are made to the attributes of these tags in the HTML tab will be synchronized to the Canvas visual editor. If you remove the chart-uuid attribute and change display-type to “REPORT”, this will be updated in the visual editor.
Code
| Note |
|---|
From Yellowfin 9.5, publish-uuid replaces the older widget-uuid. This page has been updated to reflect the updated UUID. For Yellowfin users on older versions, we recommend you upgrade, or use the name attribute in place of publish-uuid in the interim. |
Code
<report-output publish-uuid="ffe09245-8739-416c-b039- |
05fff6427242" report-uuid="c83357db-8aef-4ec7-ab72-fce34de9ee77" height="475" top="46" left="54" name="Agency Benchmark" width="897" display-type="REPORT" on-click="none" style= |
"z-index: 3;"></report-output> |
| Note |
|---|
From Yellowfin 9.5, publish-uuid replaces the older widget-uuid. This page has been updated to reflect the updated UUID. For Yellowfin users on older versions, we recommend you upgrade, or use the name attribute in place of publish-uuid in the interim. |
Visual
Common Attributes
While many of the elements that can be added to a canvas will have different attributes, they will all share the following attributes.
width
Initial width of the widget in pixels.
height
Initial height of the widget in pixels.
left
Initial left position of the widget in pixels.
Top
Initial top position of the widget in pixels.
name
Name of the widget, this can be used as an identifier to easily select the widget from the DOM.
...
name
Name of the widget, this can be used as an identifier to easily select the widget from the DOM.
publishUUID (new since Yellowfin 9.5)
Unique ID for the widget. This can be used for selecting items from the canvas.
widgetUUID (deprecated from Yellowfin 9.5)
Unique ID for the widget. This should not be used for selecting items from the canvas. We recommend using the name attribute in place of widget-uuid if you’re using an earlier version of Yellowfin 9.
...
JS
The JS tab allows you to write JavaScript that will be executed when a user navigates to your tab. When you first navigate to this tab, it will contain the following code:
// Declare variables or insert code here |
Functions
onRender
Description
...
This can be added to the Code Mode object by using:
| this.onRender = function() { //Your logic here } |
onRemove
Description
This is called when the SubTab is removed from the page, this will happen when a user navigates to a different tab.
This method should be used for removing any event listeners or objects that you don’t wish to persist when moving to a new tab.
Example
let subTabAPI = this.apis.subtab; |
How to get APIs
The “this” object will contain an “apis” parameter. This object will contain the following objects:
These can then be retrieved like so:
this.apis.canvas; |
How to get Reports
One of the main advantages of using Code Mode is you can access the Reports APIs, however the ReportAPIs are not passed as part of the this.apis object as they are loaded dynamically as required. Once a report is going to be rendered the Dashboard will create its Report API.
...
In this example, we’ve given our report the name “report_1”. We can now use the canvasAPI select function to select that element, and then get the reportAPI from it.
let reportElement = this.apis.canvas.select('report_1'); |
The second approach is using a dashboard getAllReports() or getReportsForSubTab() combined with the dashboard.loadReport() function. This is outlined in the DashboardAPI.
Updating Element Attributes from JS
...
The CSS tab contains any styling that you wish to apply to your SubTab. Any CSS applied here will have no effect on the rest of the page. When a user navigates away from the SubTab, this CSS will be removed from the page.
...
Examples
Update reports visualisation
This example takes a report that is on the dashboard and toggles it’s its visualisation every 5 seconds.
HTML
<canvas-area xmlns="http://www.w3.org/1999/xhtml" canvas-uuid="aee7c574-3ad3-4ac0-a366-7810861d91eb"> |
|
publish-uuid="ffe09245-8739-416c-b039-05fff6427242" report-uuid="c83357db-8aef-4ec7-ab72-fce34de9ee77" height="475" top="46" left="54" name="report_1" width="897" display-type="CHART" chart-uuid="a9aba052-51b5-47b1-b311-2c0cc3abd932" on-click="none" style="z-index: 3;"></report-output> |
publish-uuid="d0fafeb9-57a8-4a21-ab6c-844501ebf50b" width="927" height="496" top="35" left="36" rotation="0" name="Rectangle" stroke-width="14" stroke-color="#009eec" fill-opacity="100" fill-color="#ffffff" on-click="none" style= |
</canvas-area>
"z-index: 2;"></canvas-rectangle> |
| Note |
|---|
From Yellowfin 9.5, publish-uuid replaces the older widget-uuid. This page has been updated to reflect the updated UUID. For Yellowfin users on older versions, we recommend you upgrade, or use the name attribute in place of publish-uuid in the interim. |
JS
this.onRender = function () { |
currentDisplay = "CHART"; |
Using the report API Dataset to build a Custom Table
HTML
<canvas-area xmlns="http://www.w3.org/1999/xhtml" canvas-uuid="a4c909fb-70d1-44f1-a95a-17a0eada6bf6"> |
publish-uuid="eff0b9bd-4009-4d83-ade8-46c40587ed97" width="880" height="450" top="130" left="10" rotation="0" name="custom_table" on-click="none" style="z-index: 2;"></custom-html> |
publish-uuid="90a601cc-a148-40d8-a460-15daab8a238b" report-uuid="3e842fae-02f7-4ad3-a632-ca267e0078da" height="125" top="4" left="8" name="Campaign Summary" width="880" display-type="CANVAS" on-click="none" style= |
</canvas-area>
"z-index: 1;"></report-output> |
| Note |
|---|
From Yellowfin 9.5, publish-uuid replaces the older widget-uuid. This page has been updated to reflect the updated UUID. For Yellowfin users on older versions, we recommend you upgrade, or use the name attribute in place of publish-uuid in the interim. |
JS
this.outputTypes = []; //Create an array of outputKeys and what report API they came from for easy removal |
campaignSummary.onReportLoad.then(() => { |
tableElement.appendChild(tHead); |
|
tableElement.appendChild(tbody); |
tbody.appendChild(tr); |
}); |
//tab |
this.outputTypes.forEach(outputObject => { |
}); |
CSS
table.codeModeExampleTable { |
border-top:none; |