Page History
| Anchor | ||||
|---|---|---|---|---|
|
| Table of Contents | ||
|---|---|---|
|
Overview
| Styleclass | ||
|---|---|---|
| ||
...
To add a Multi-Chart Canvas to a dashboard or storyboard, use the same steps you would with any normal single chart report.
| HTML |
|---|
<iframe width="700" height="394" src="https://www.youtube.com/embed/z7FvlSHZtcE?color=white" frameborder="0" allowfullscreen></iframe> |
...
Canvas Components
| Styleclass | ||
|---|---|---|
| ||
| HTML |
|---|
<iframe width="700" height="394" src="https://www.youtube.com/embed/F7CuXse8iAk?color=white" frameborder="0" allowfullscreen></iframe> |
...
Charts
Any chart created during the Charts step of the report builder can be added to a Multi-Chart canvas. To add a chart to the canvas:
...
Images can be added to the canvas to add context to the data shown.
| HTML |
|---|
<iframe width="700" height="394" src="https://www.youtube.com/embed/kWwFAGOrEvw?color=white" frameborder="0" allowfullscreen></iframe> |
...
To add an image to the canvas:
...
Note: icons will not appear in exports or emailed versions of the multi-chart canvas.
Component Actions
| Styleclass | ||
|---|---|---|
| ||
Resize
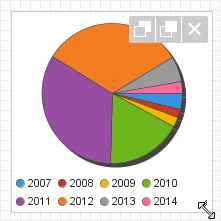
In order to resize a chart or widget added to the Multi-Chart Canvas, simply drag the bottom-right corner of the component to the desired size.
...
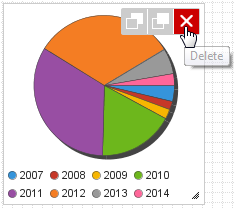
Once added to the canvas, charts and widgets can be deleted if they are no longer required. Click on the Delete icon to remove an item from the canvas.
Canvas Actions
| Styleclass | ||
|---|---|---|
| ||
Shrink to Fit
Once all the required content has been added to, and positioned on the canvas you have the option to shrink the canvas size to fit the components. This removes any empty space around the edges of the canvas.

...
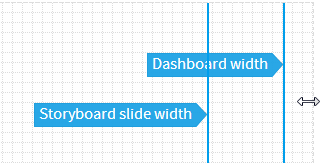
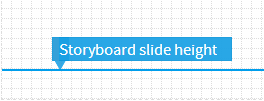
When the canvas is being resized by the user guides are displayed to show the standard dashboard and storyboard boundaries. This gives the user an idea of the sizing in relation to where the canvas will be finally displayed.
| horizontalrule |
|---|
| Styleclass | ||
|---|---|---|
| ||