Page History
| Table of Contents | ||
|---|---|---|
|
| Anchor | ||||
|---|---|---|---|---|
|
You can read and interact with reports directly on the Yellowfin mobile app.
Accessing Reports
Reports can be accessed in two ways:
- By tapping on the burger bun
 in the top-left corner, and then tapping ‘Reports’ to access the Reports list.
 - By tapping on a tile in your Timeline that contains a report.
| Anchor | ||||
|---|---|---|---|---|
|
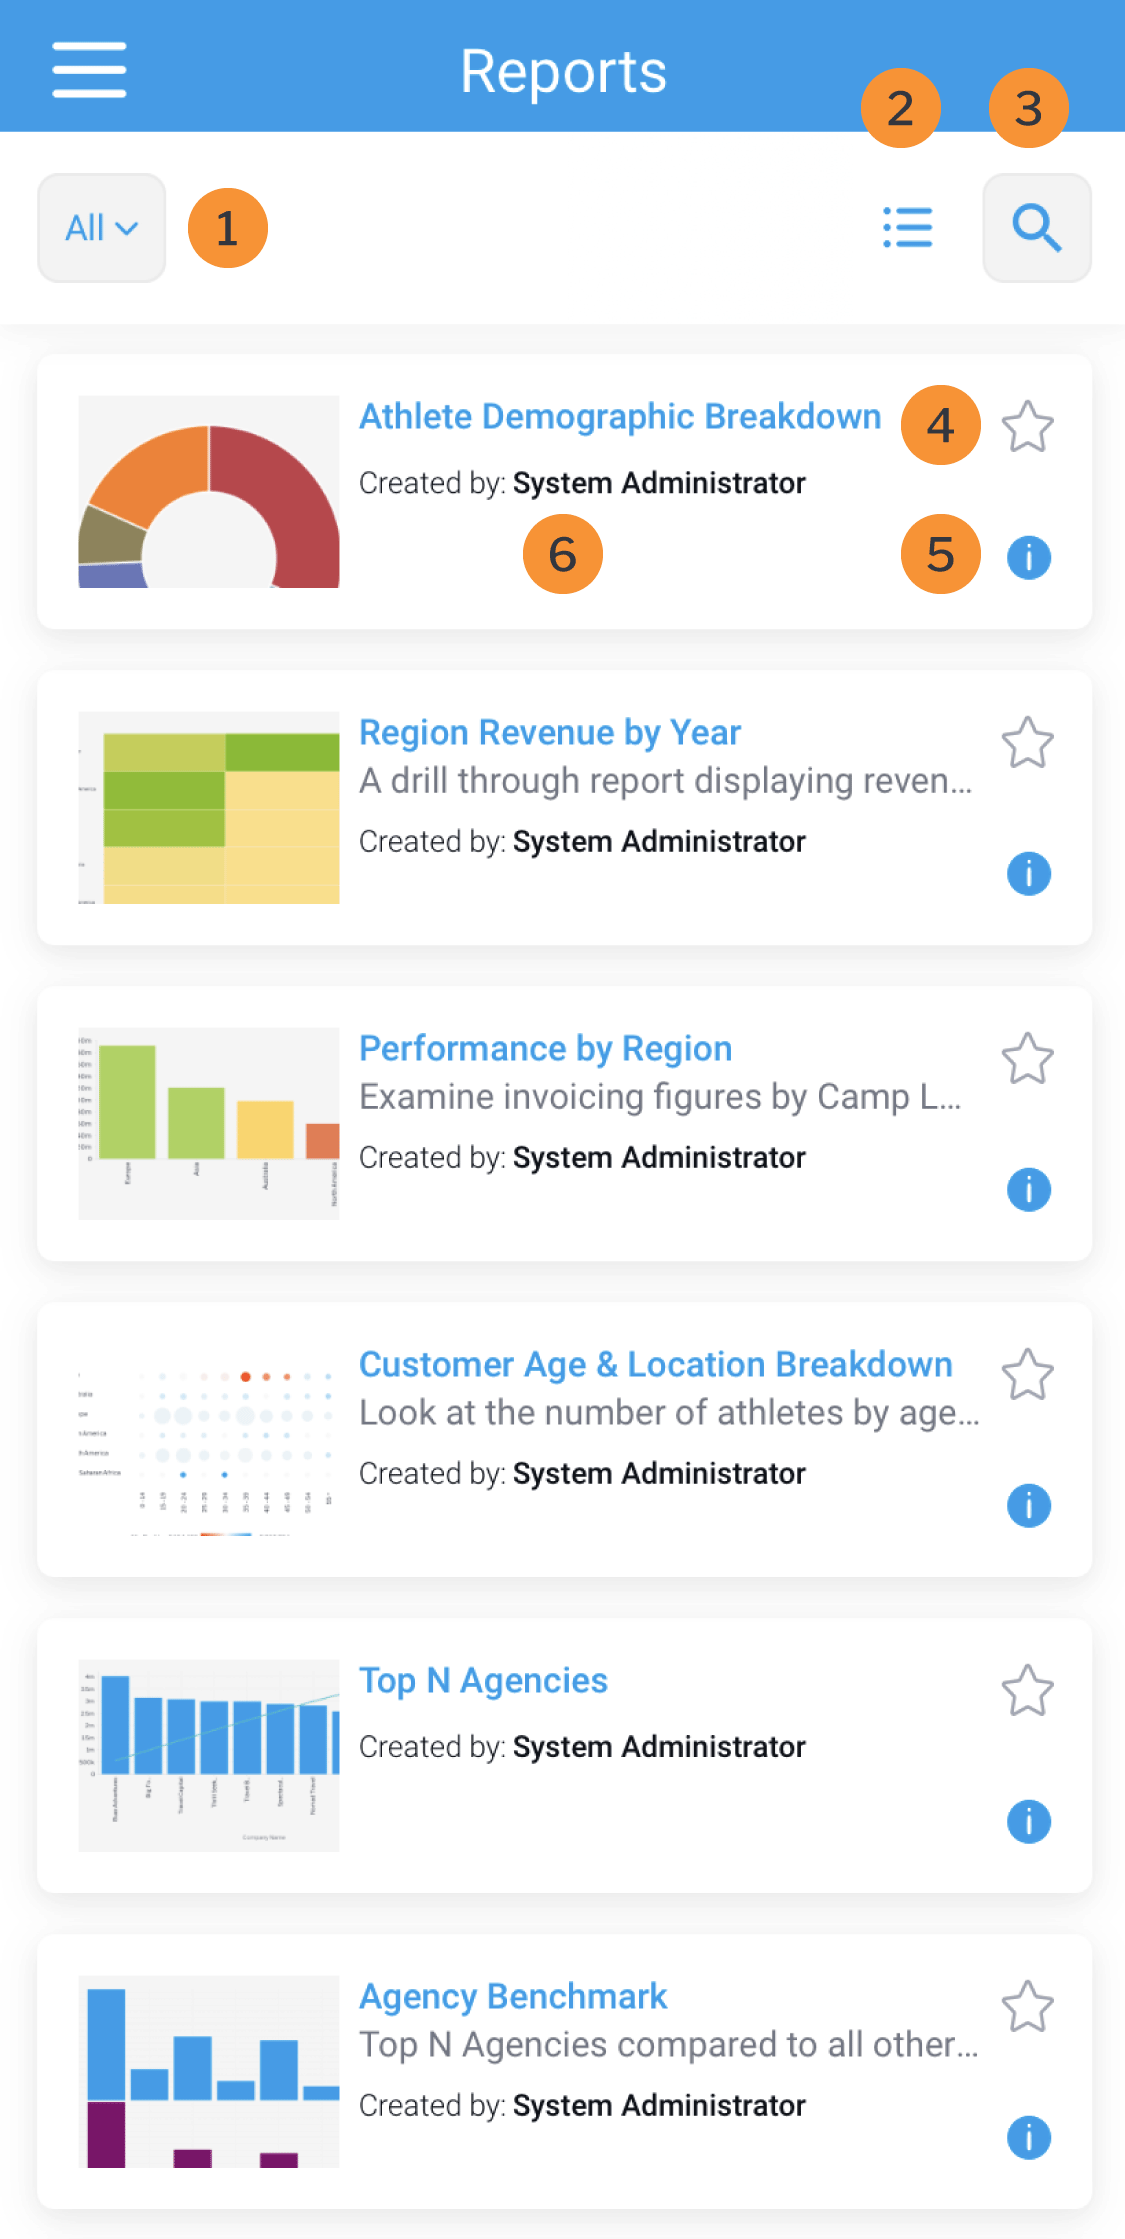
The Reports list provides access to all available reports, with options for filtering, searching and accessing report information.
| Number | Feature | Description |
|---|---|---|
| 1 | Filter | Tap the filter to change which reports to view in the list:
|
| 2 | List | Tap the list button |
| 3 | Search | Tap the search button |
| 4 | Favorite | Tap the favorite button |
| 5 | Report Information | Tap the information button |
| 6 | Report tile | Tap on the report tile to view the report. |
| Anchor | ||||
|---|---|---|---|---|
|
| Note |
|---|
Reports with larger datasets may take longer to run. A loader will be displayed on the screen. |
Tap the burger bun
in the top-left corner to access the main menu, then tap on Reports to access the Reports list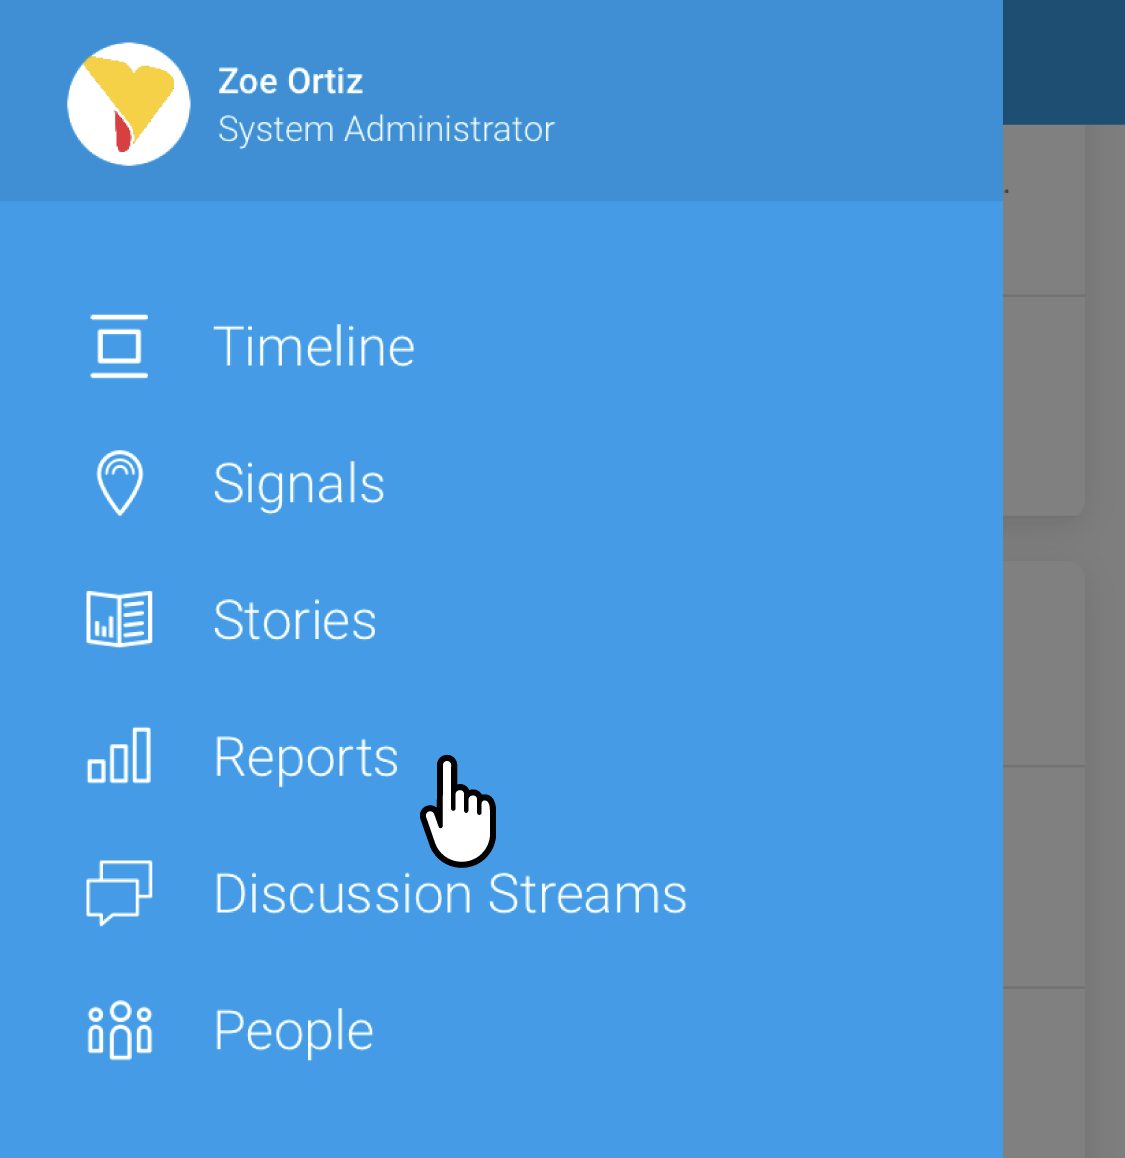
The Reports list will be displayed, and may be empty due to the Recently Viewed filter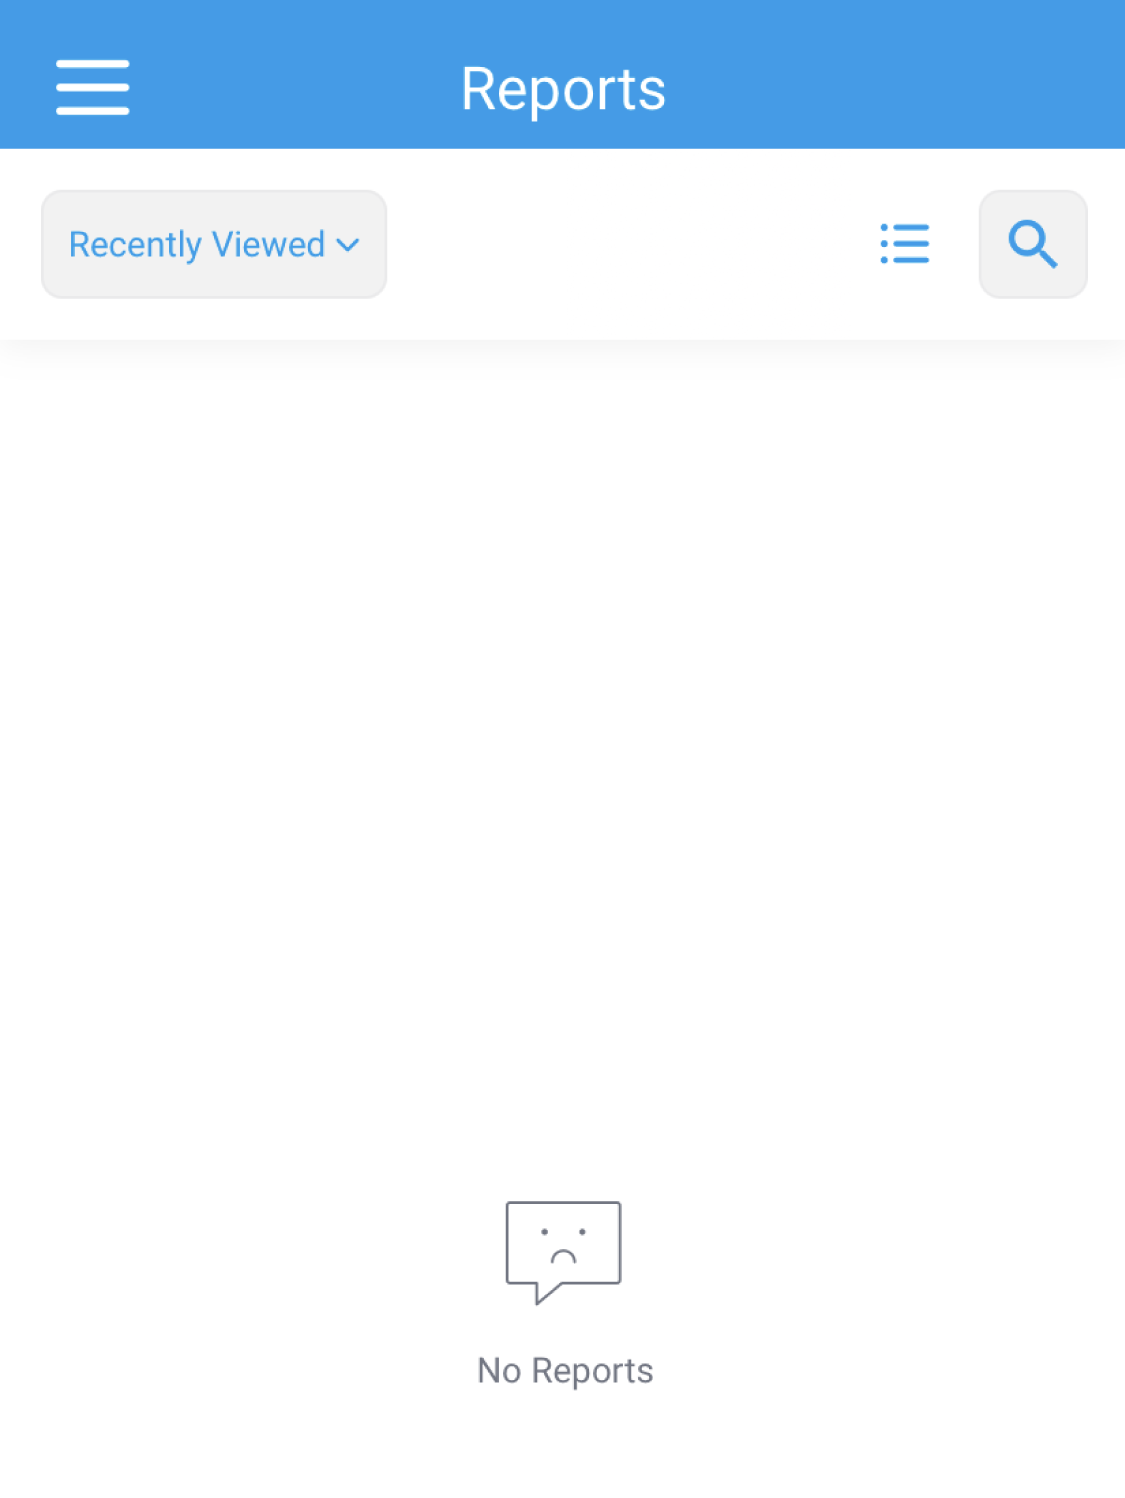
Tap on the dropdown that displays Recently Viewed
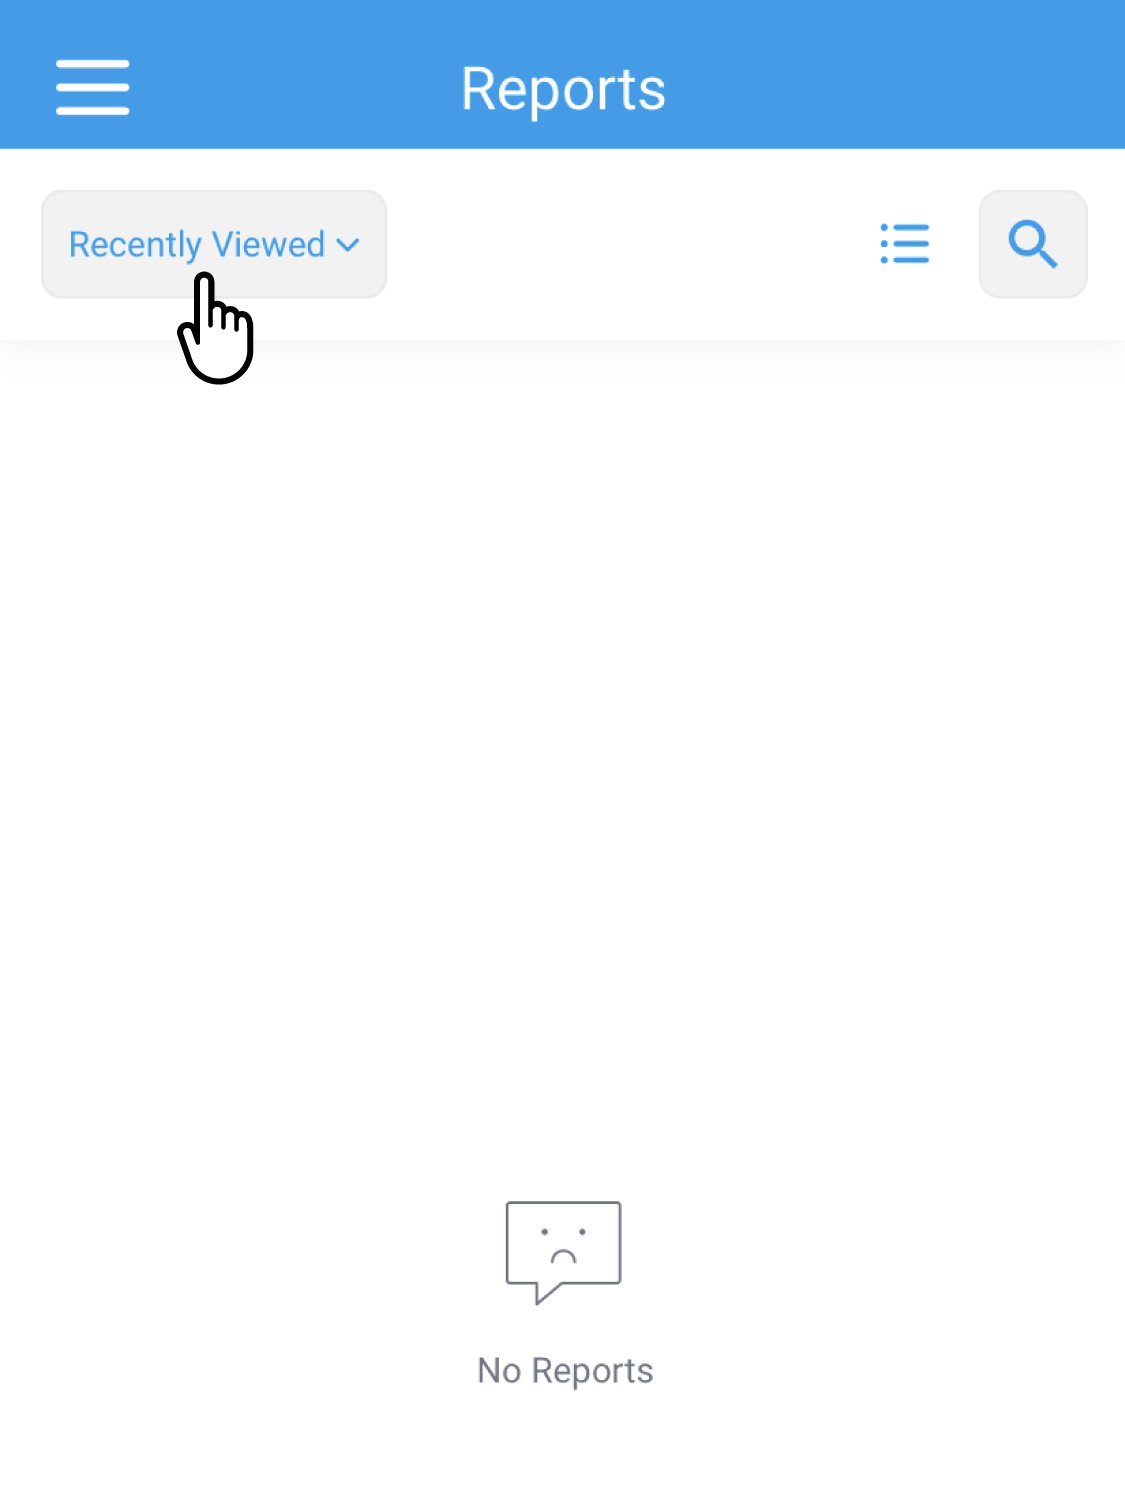
A popup will appear at the bottom of the screenTap All to display all available reports
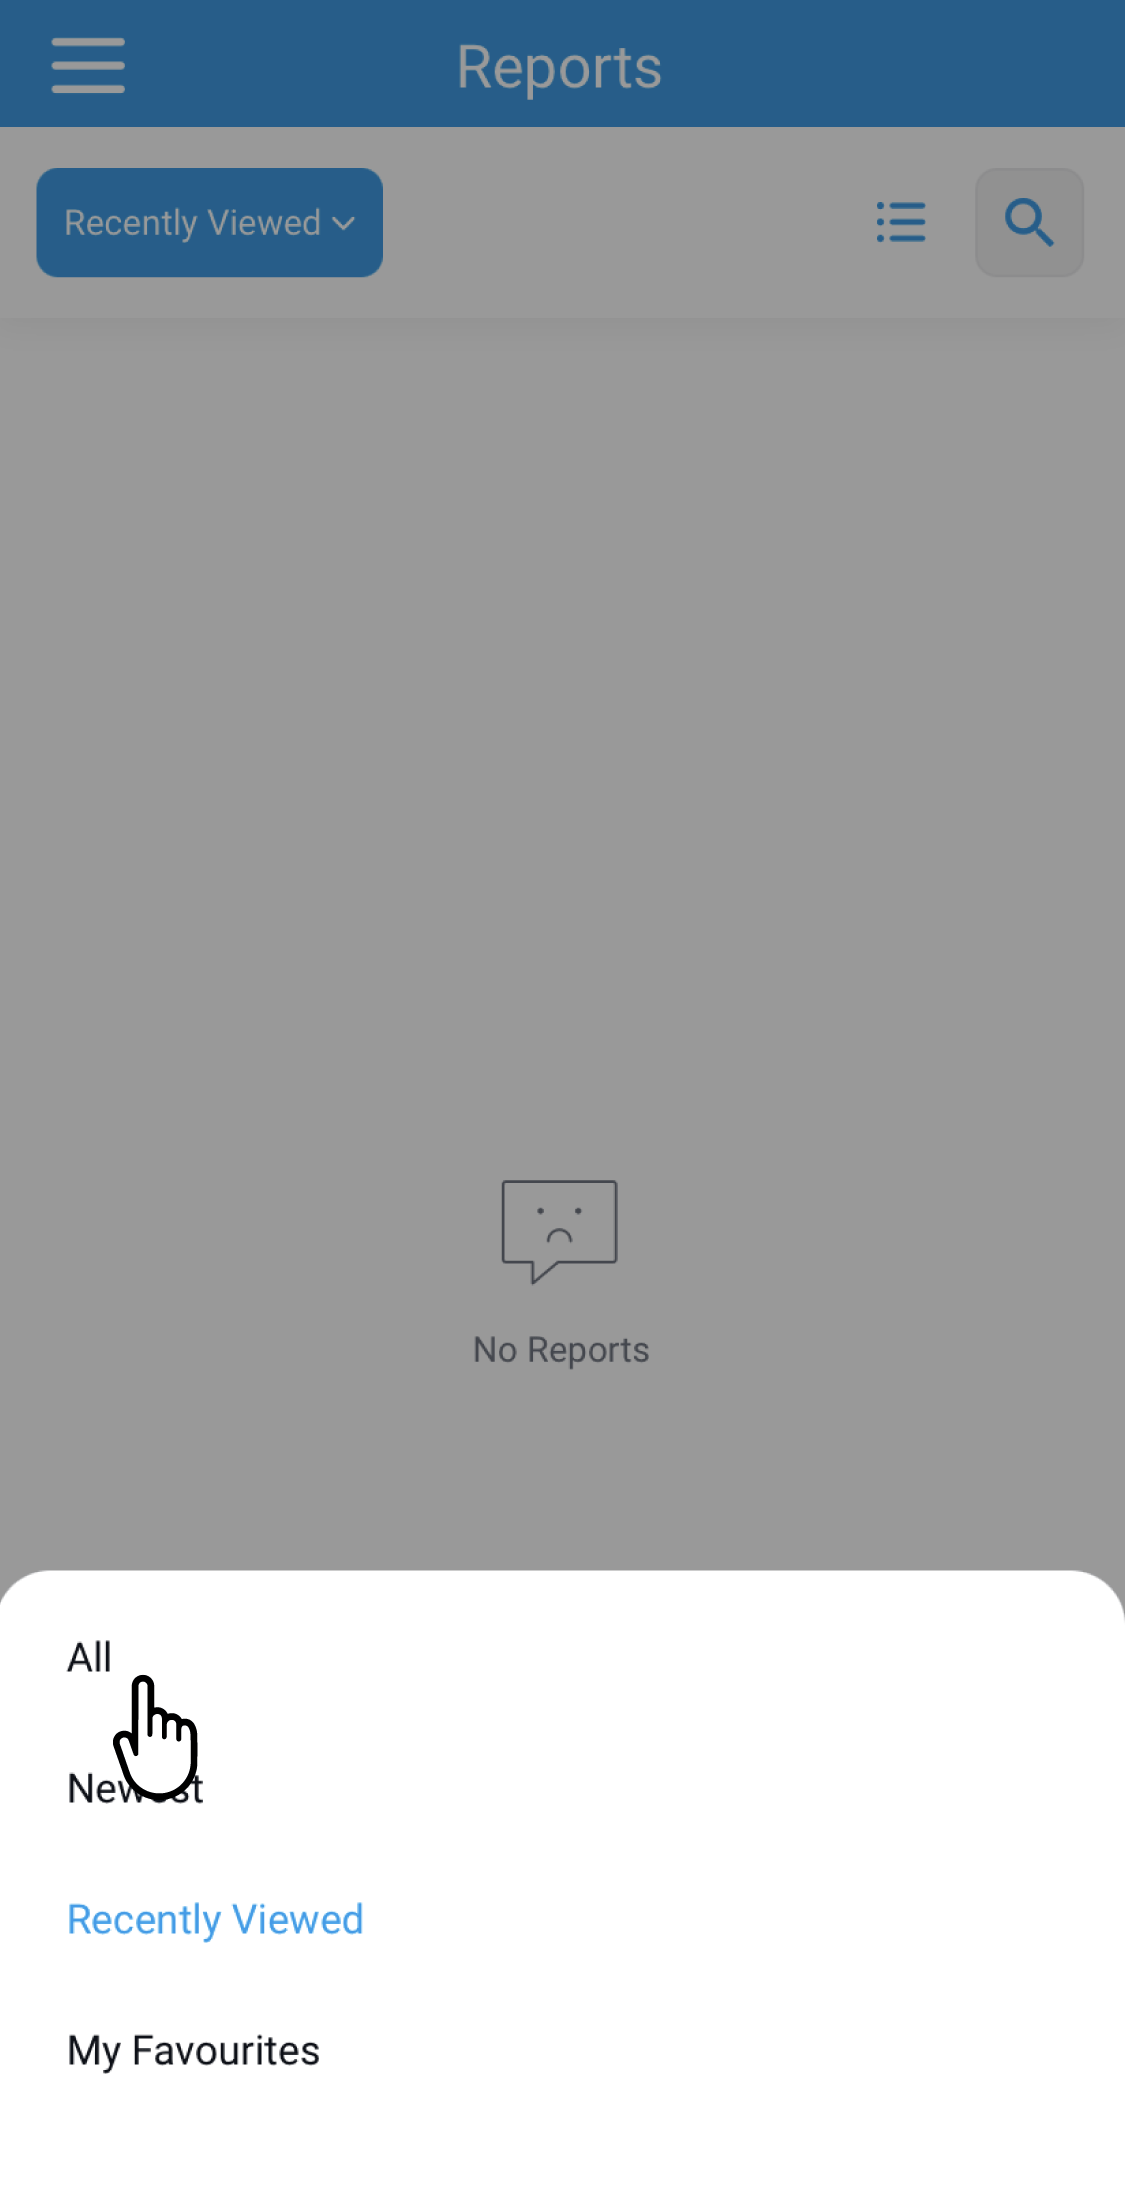
The Reports list will refresh and display all available reports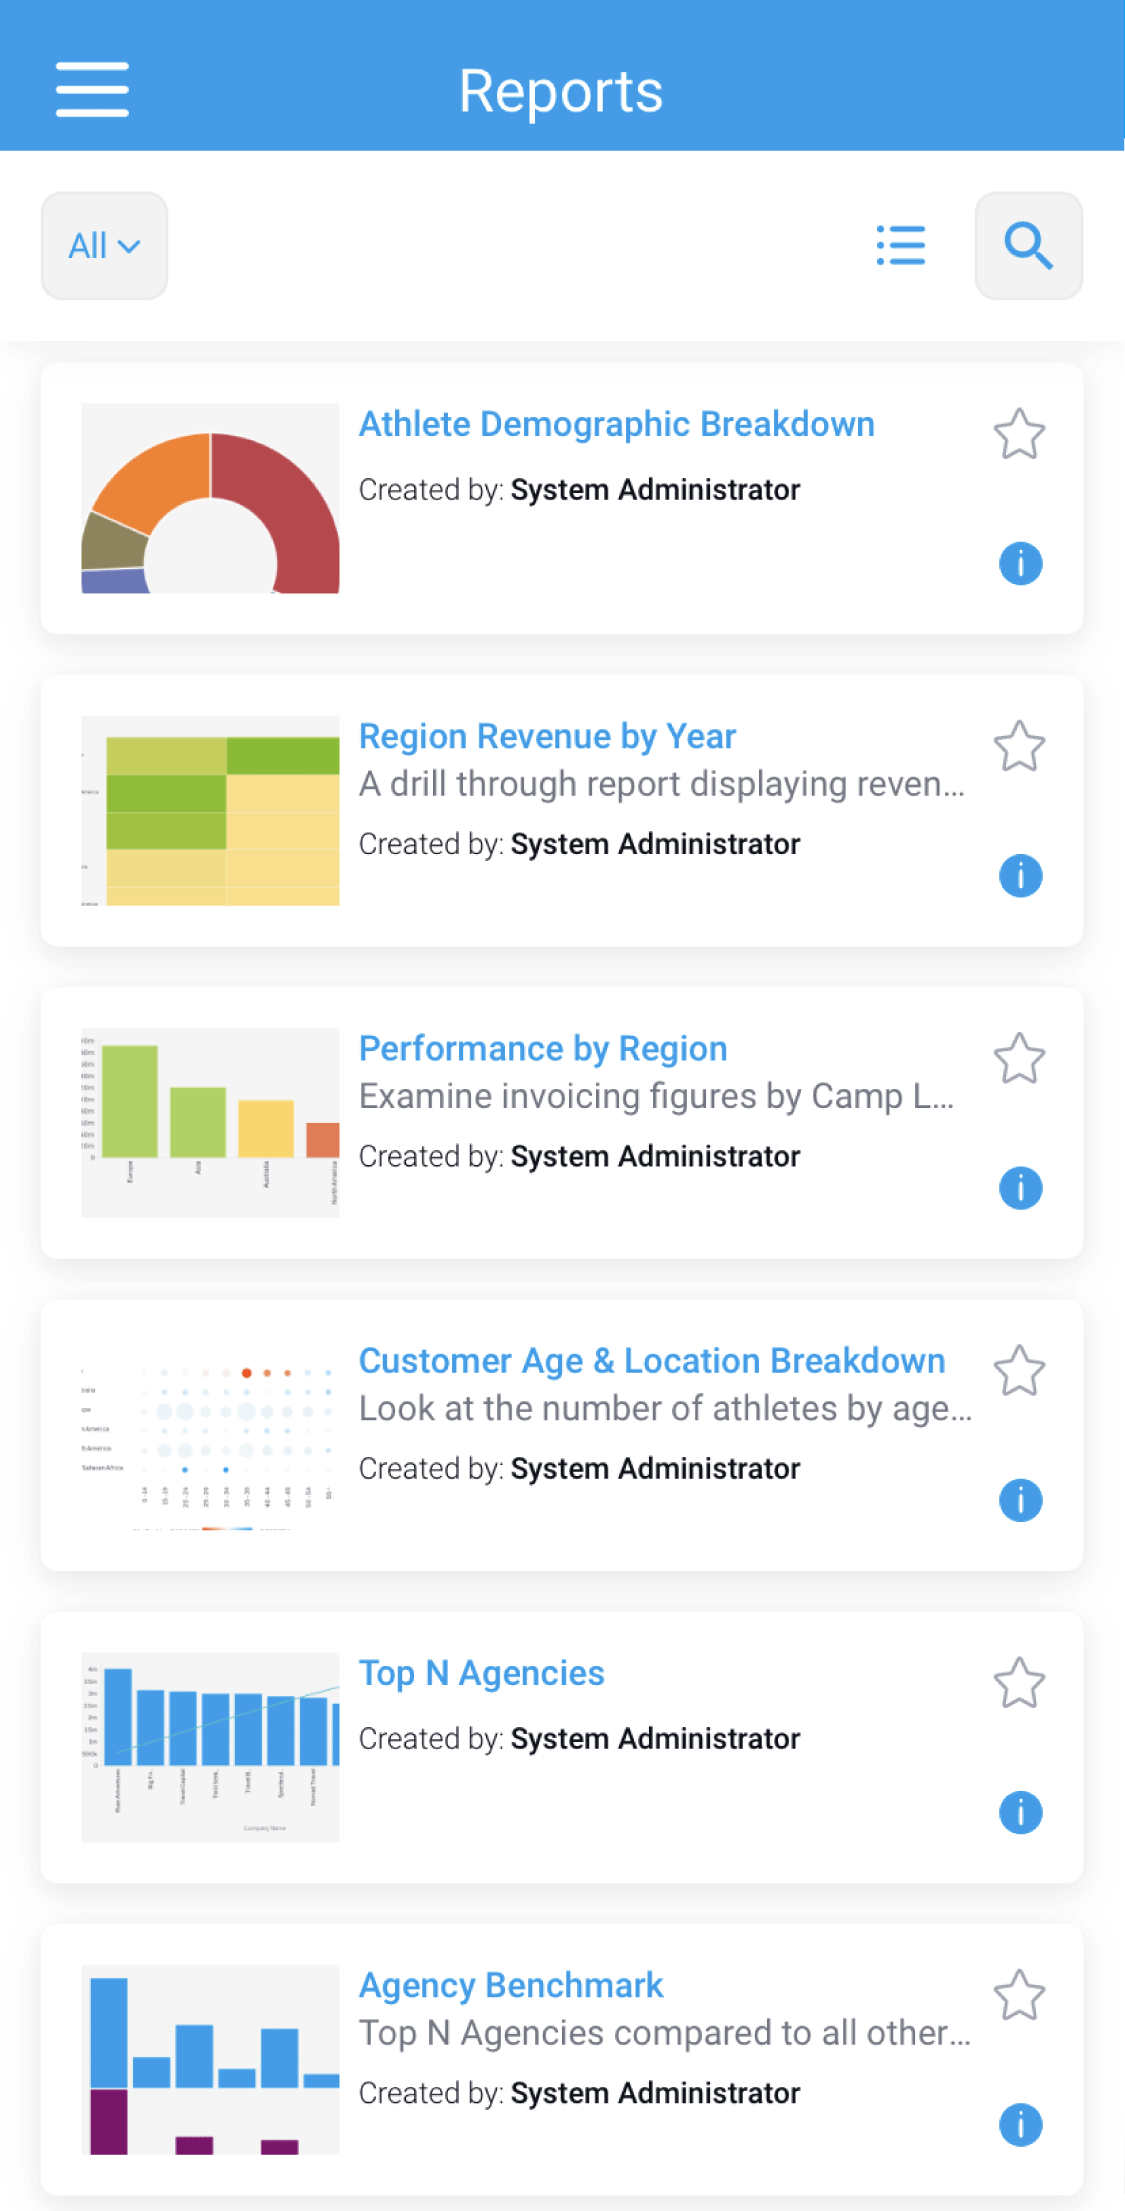
- Tap on a Report tile to view the report
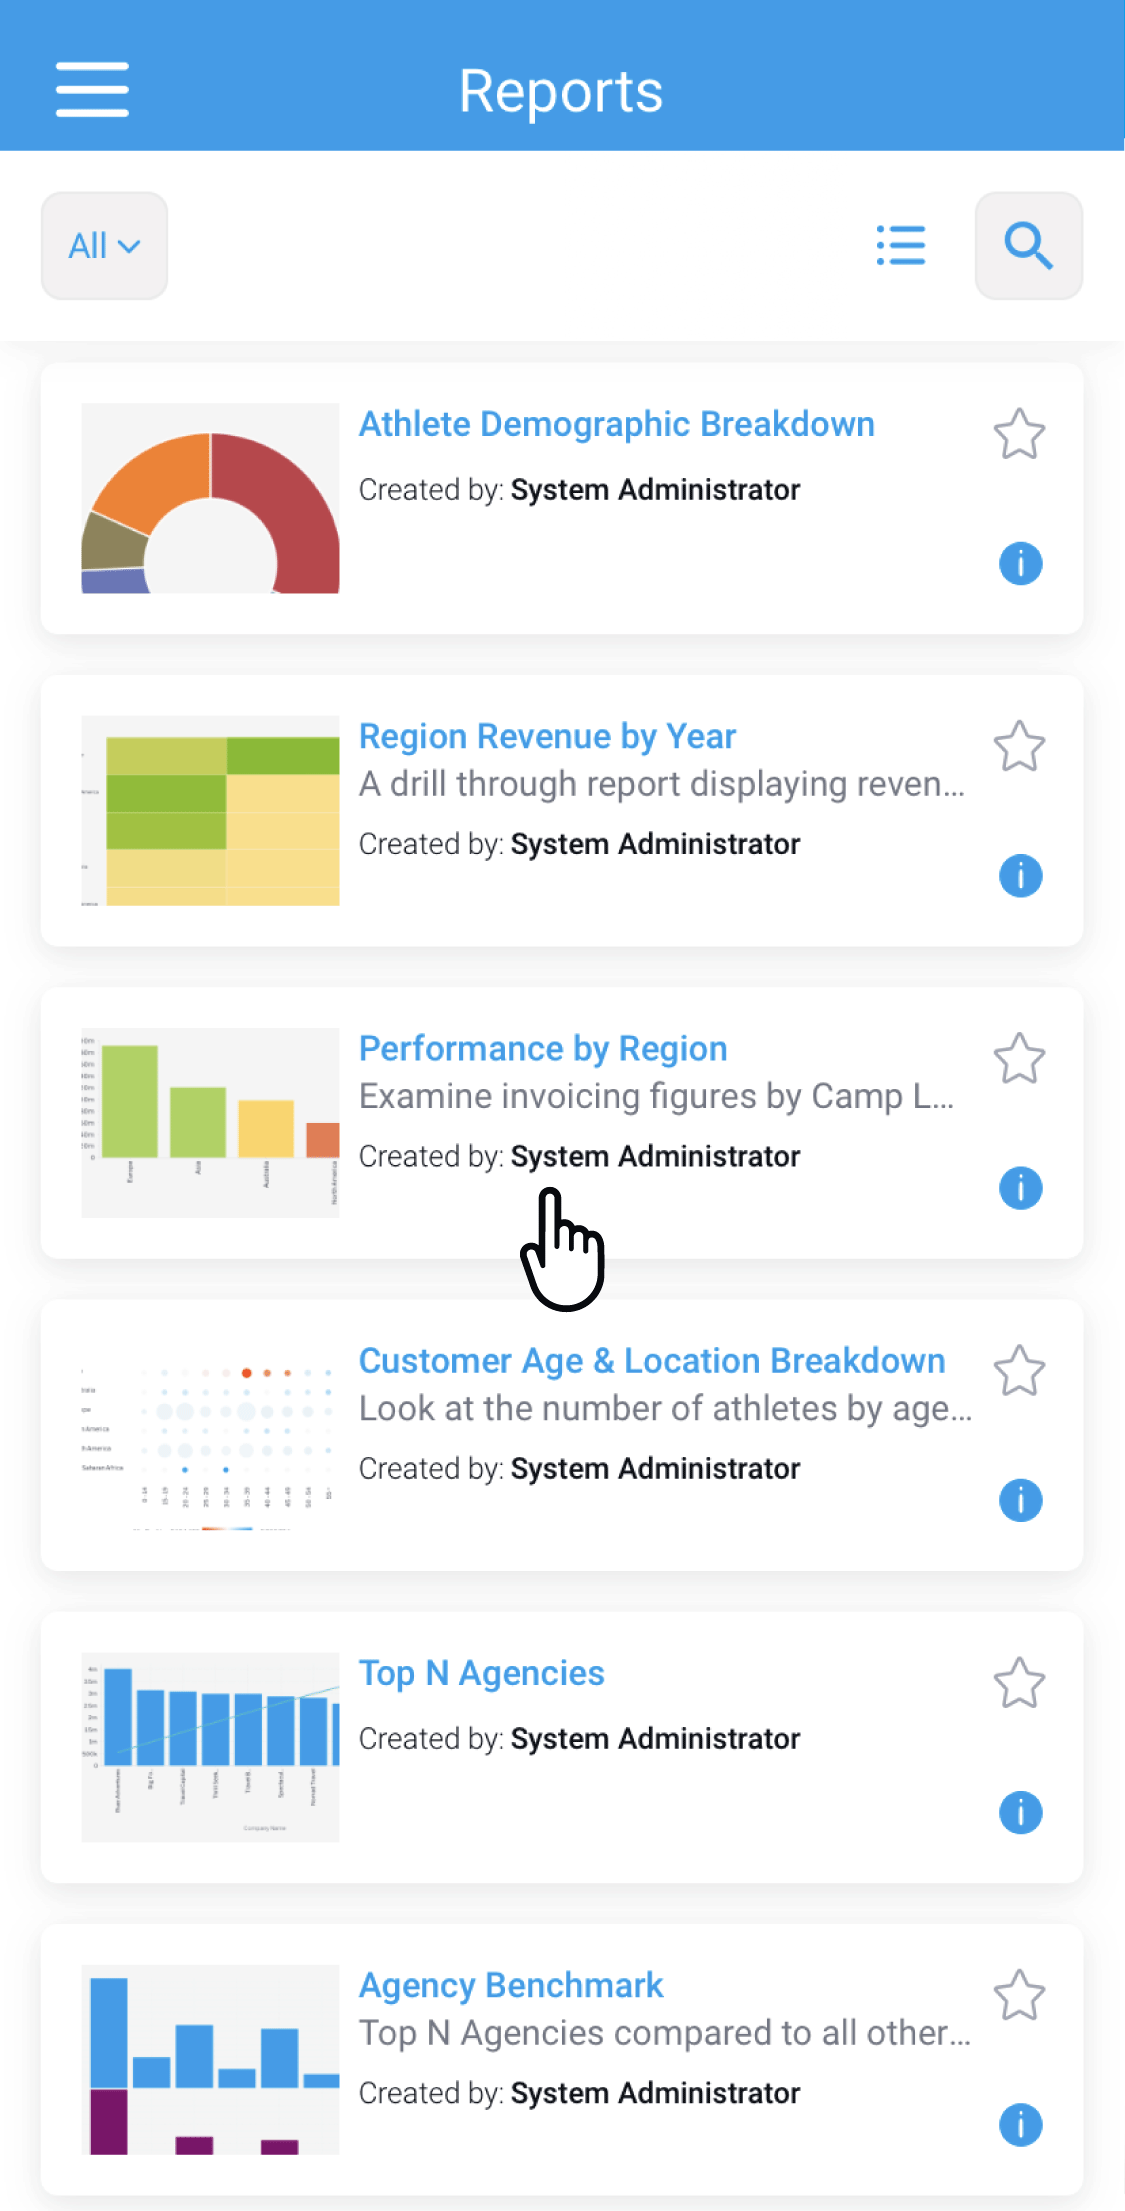
The report will run and the output will be displayed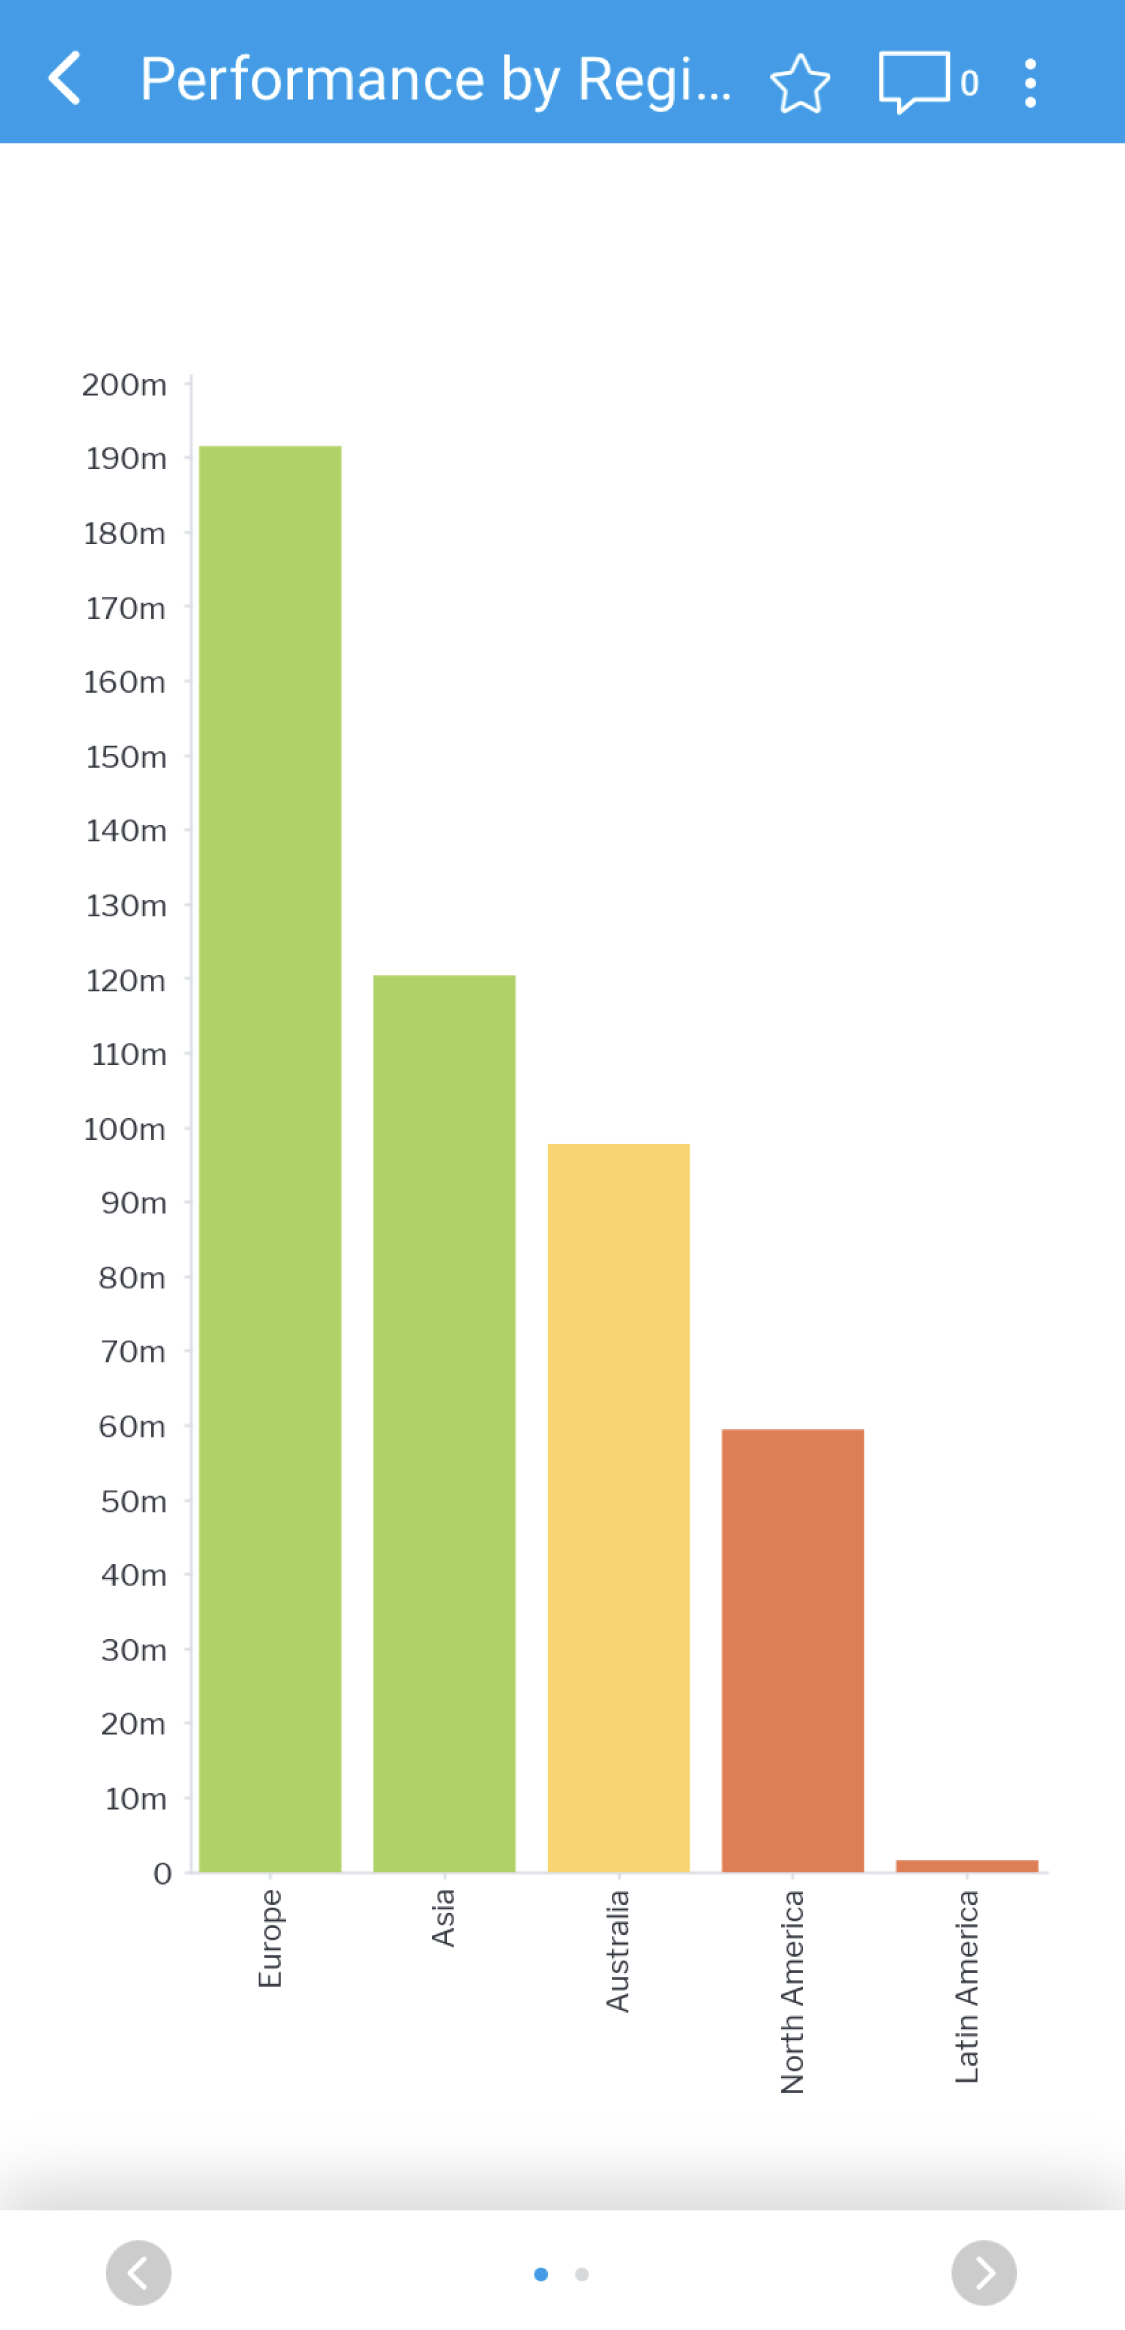
The report page allows you to interact with the report - Tap an element of the report (such as a bar in a bar chart) to view the information for that element
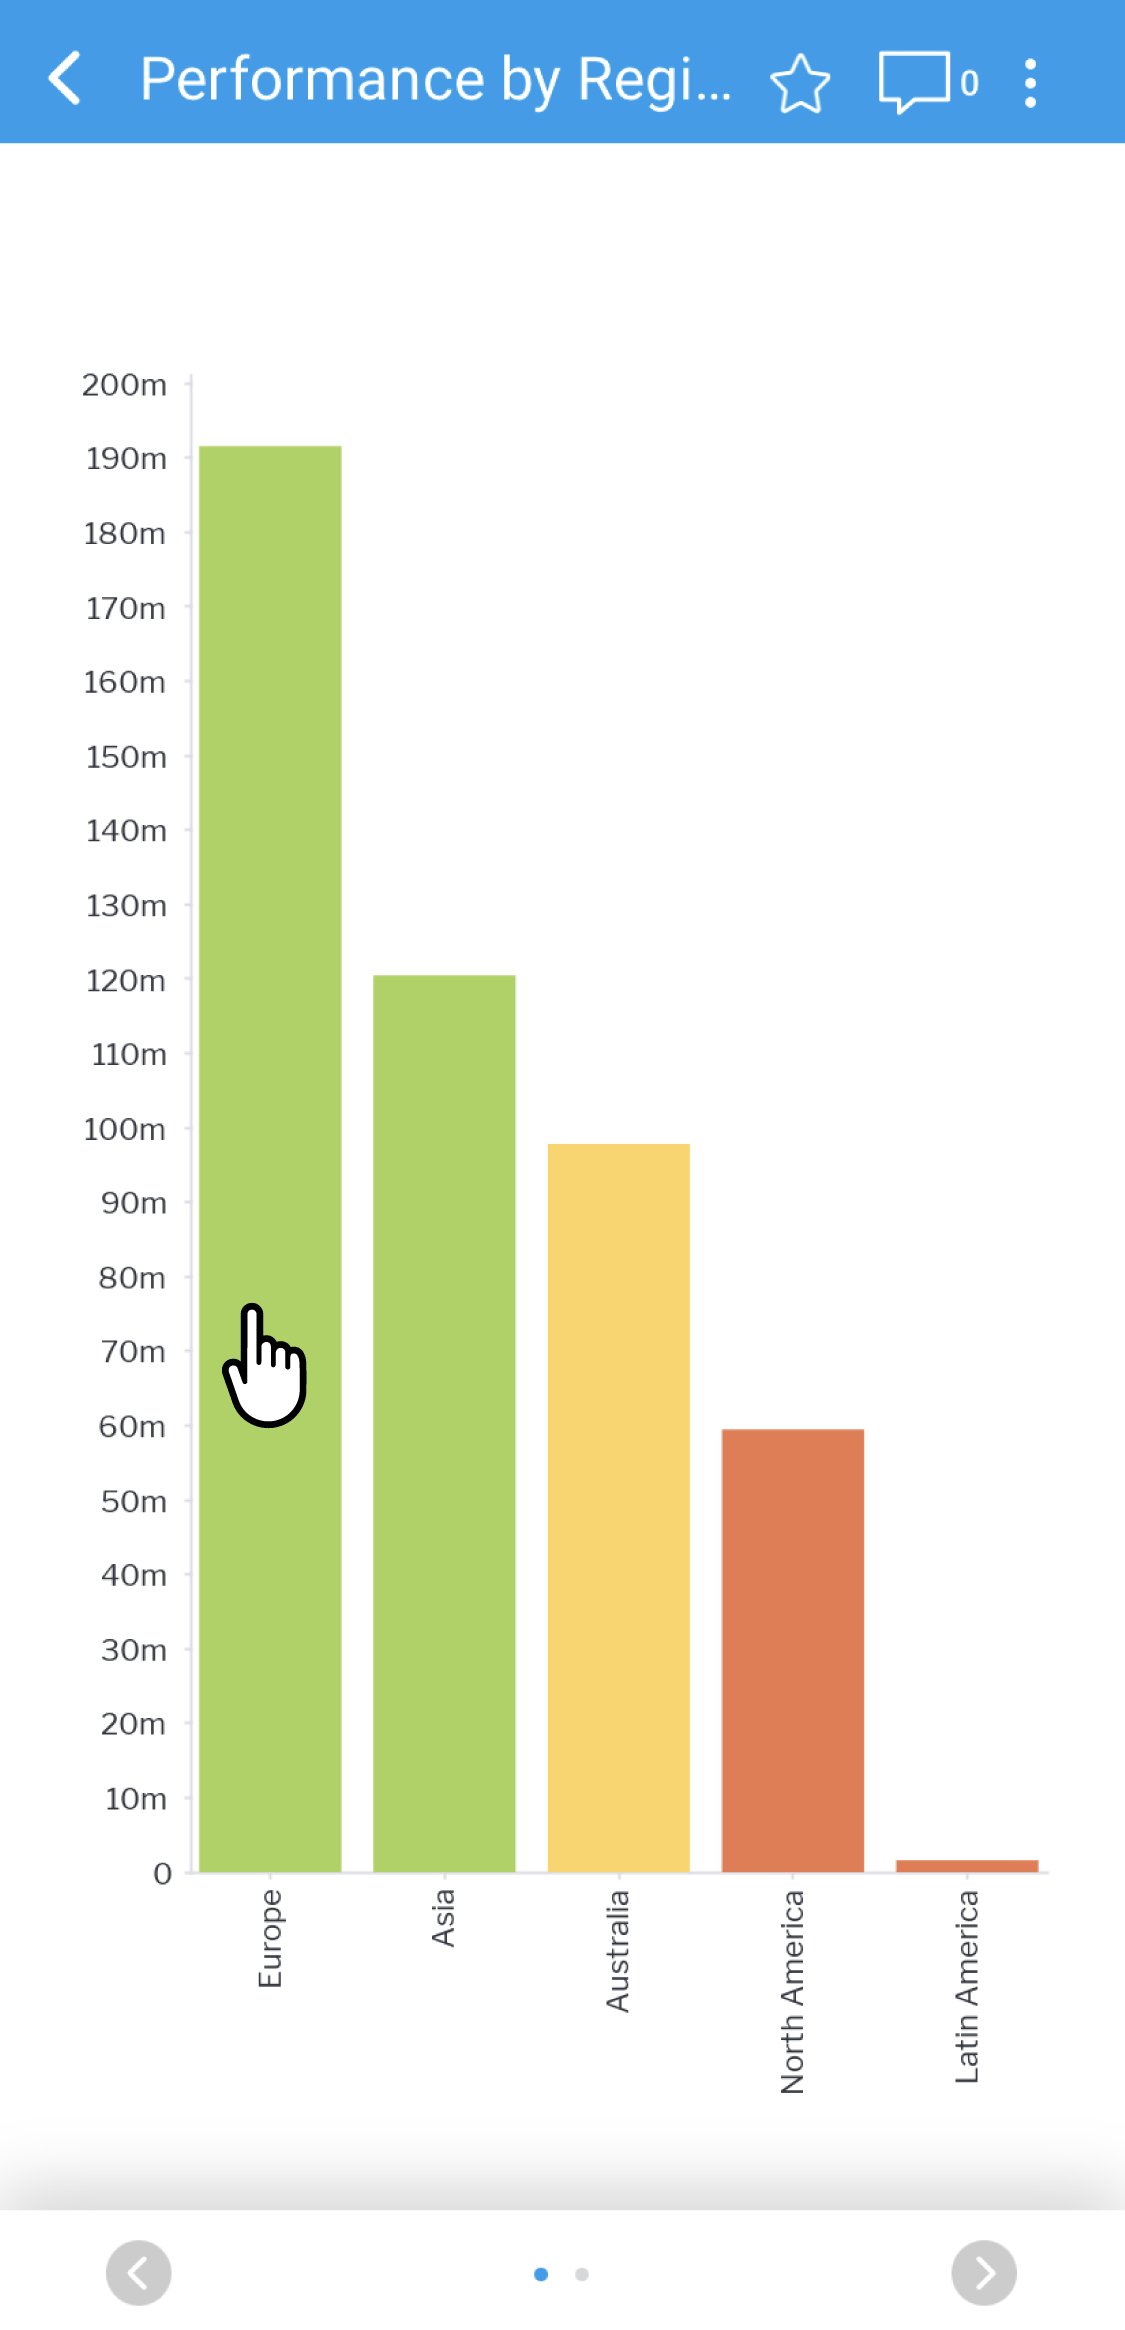
A tooltip will appear with the details of the report element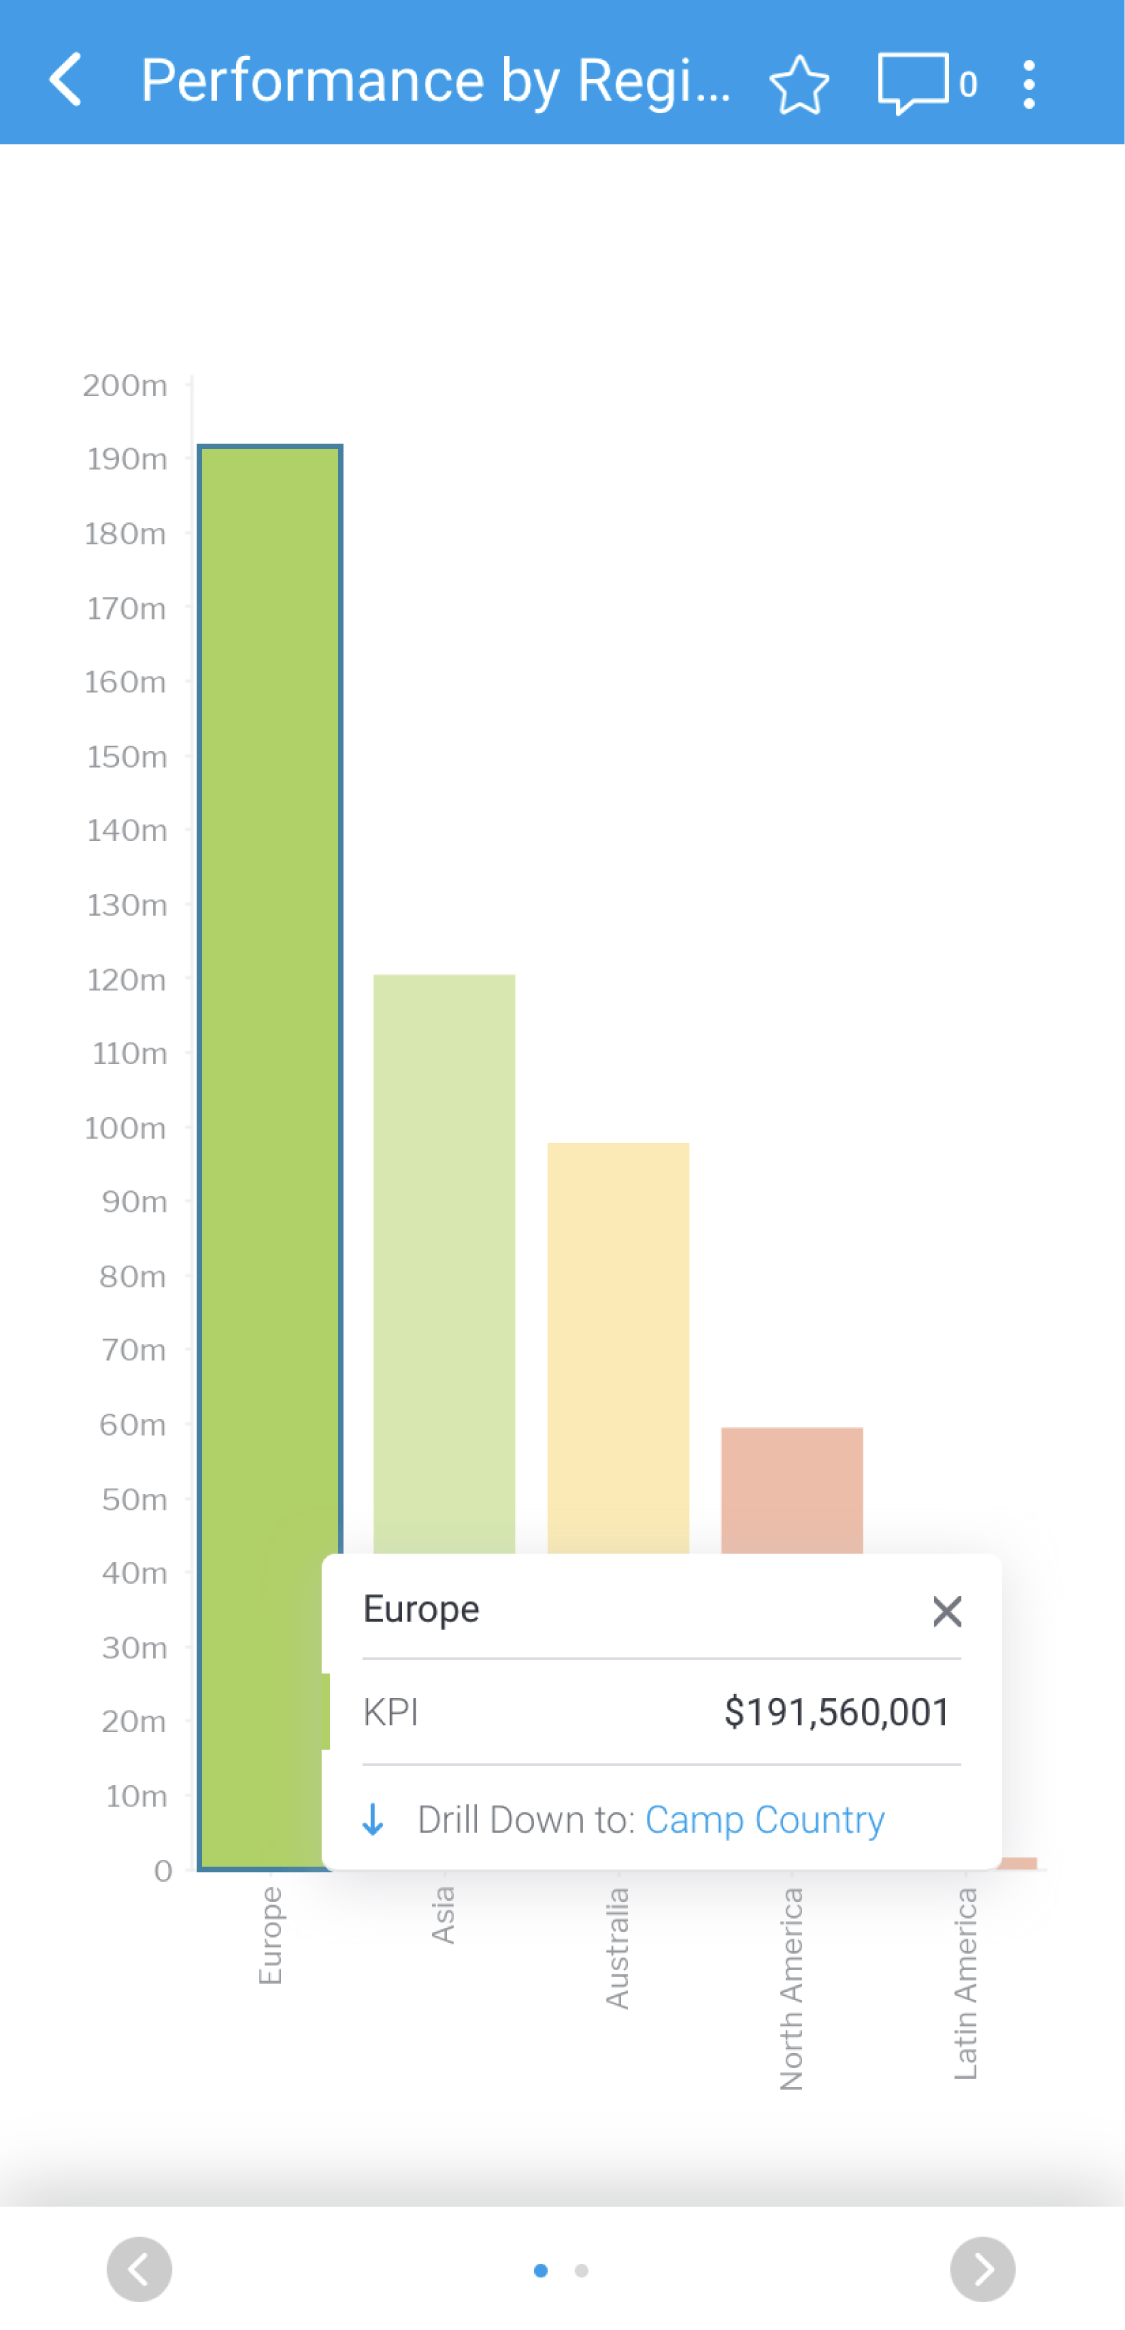
- Tap on multiple report elements to view the cumulative value for the selected elements
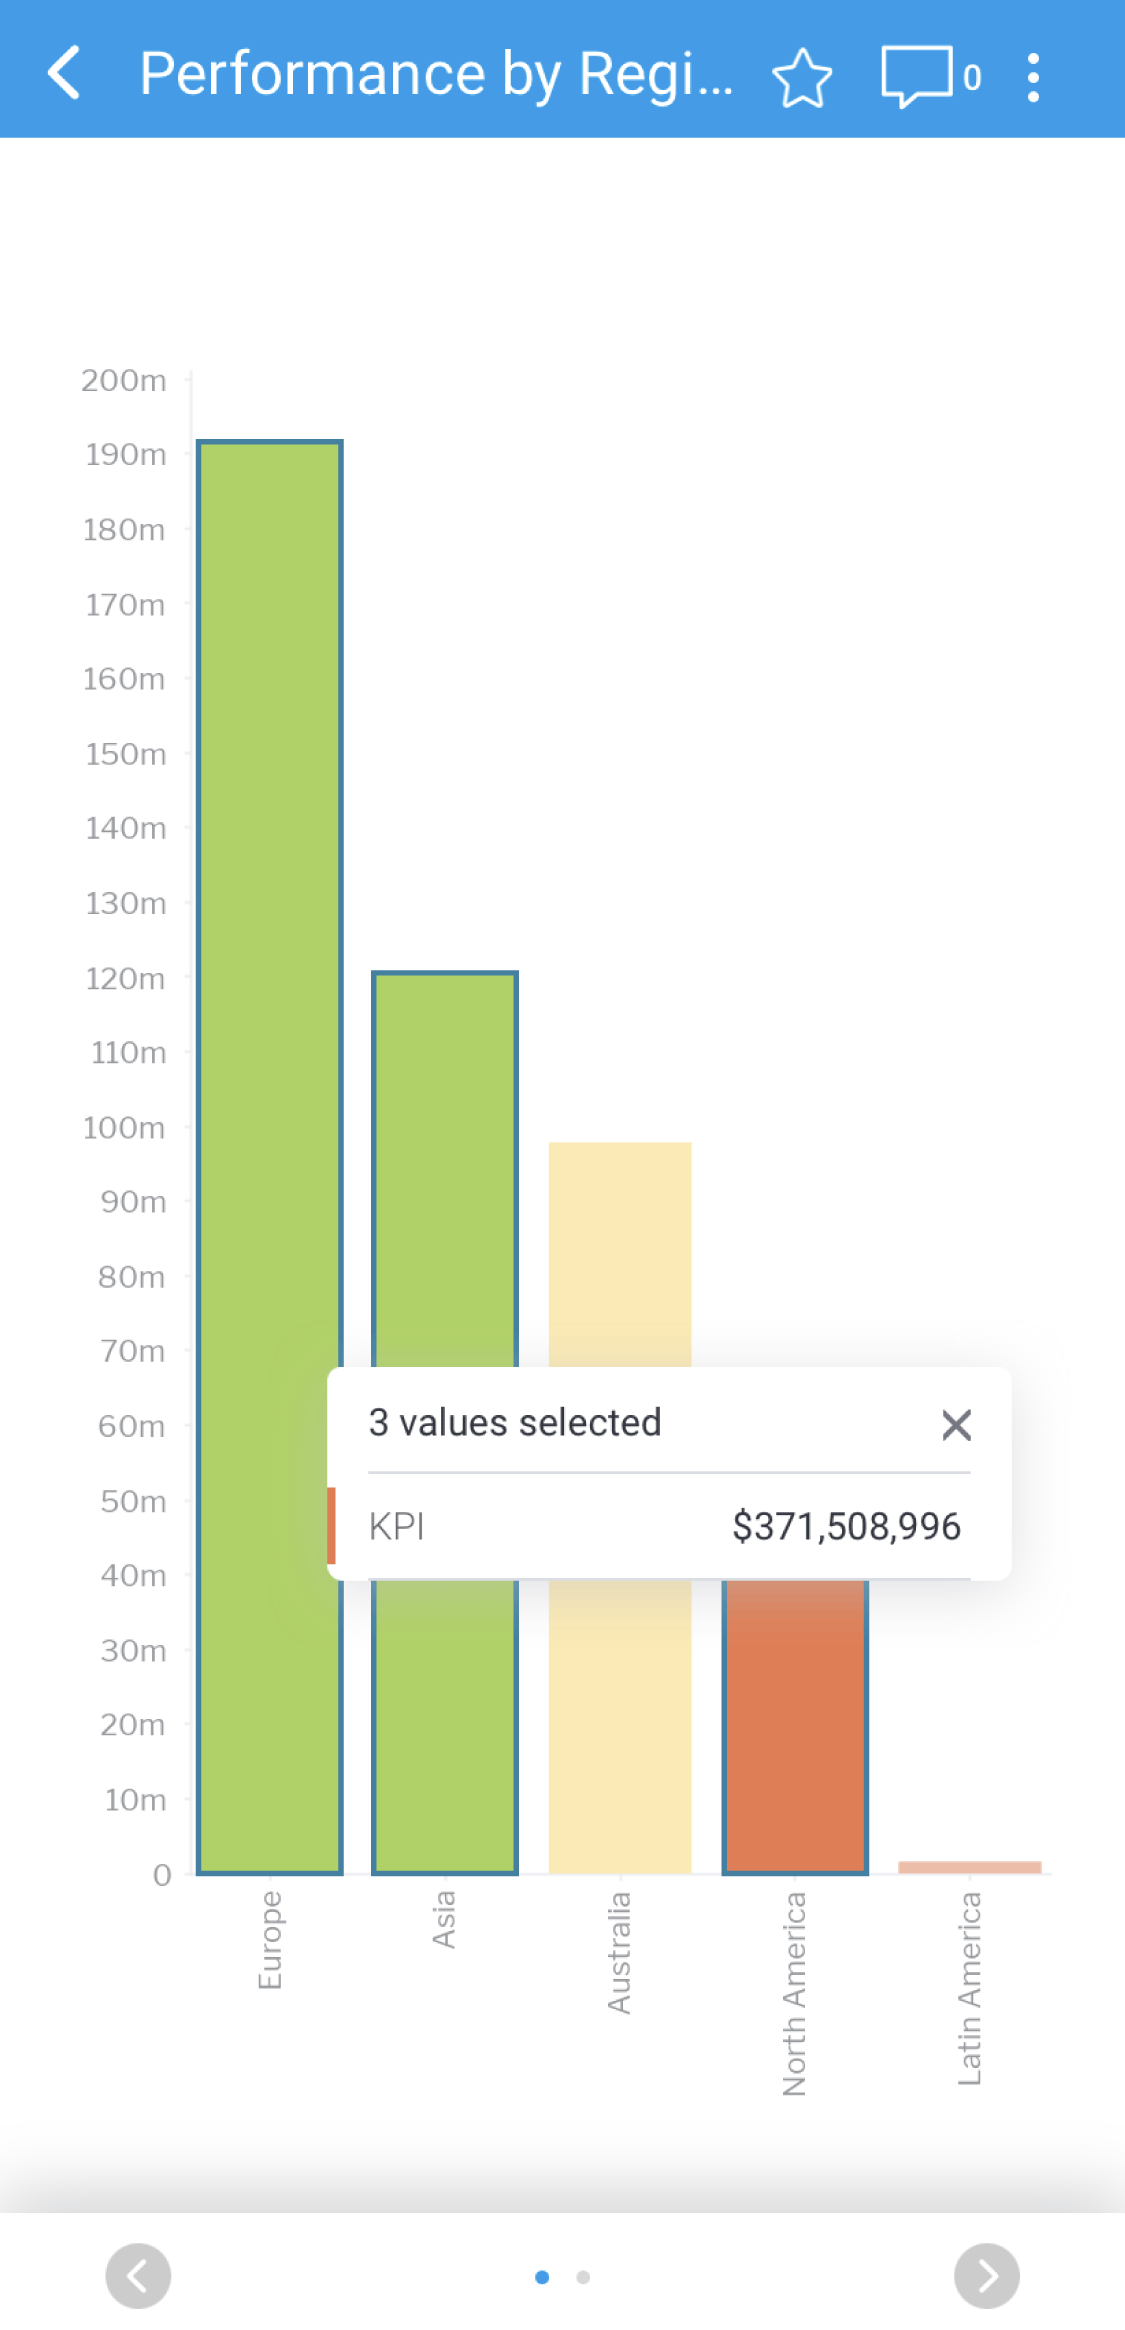
- Tap on the elements to deselect them
| Anchor | ||||
|---|---|---|---|---|
|
Reports are accessible from the Timeline if they have been previously viewed, shared by another user, broadcast to you, or triggered via other events such as receiving a notification of a new report published by a user you follow.
To view a report from your Timeline, follow the steps below:
- Tap the report tile
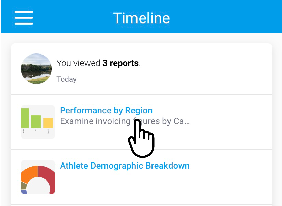
The report will be displayed
| Styleclass | ||
|---|---|---|
| ||
| Anchor | ||||
|---|---|---|---|---|
|
You can interact with reports in many ways to help you assess and interpret the data comprehensively. The Yellowfin mobile app allows you to:
- Switch visualizations.
- Filter data.
- Drill data.
- Access additional report features such as report information, comments, sharing and favorites.
Understanding the report page
The report page shows the details of the report. All interactive report features are accessible from this page.
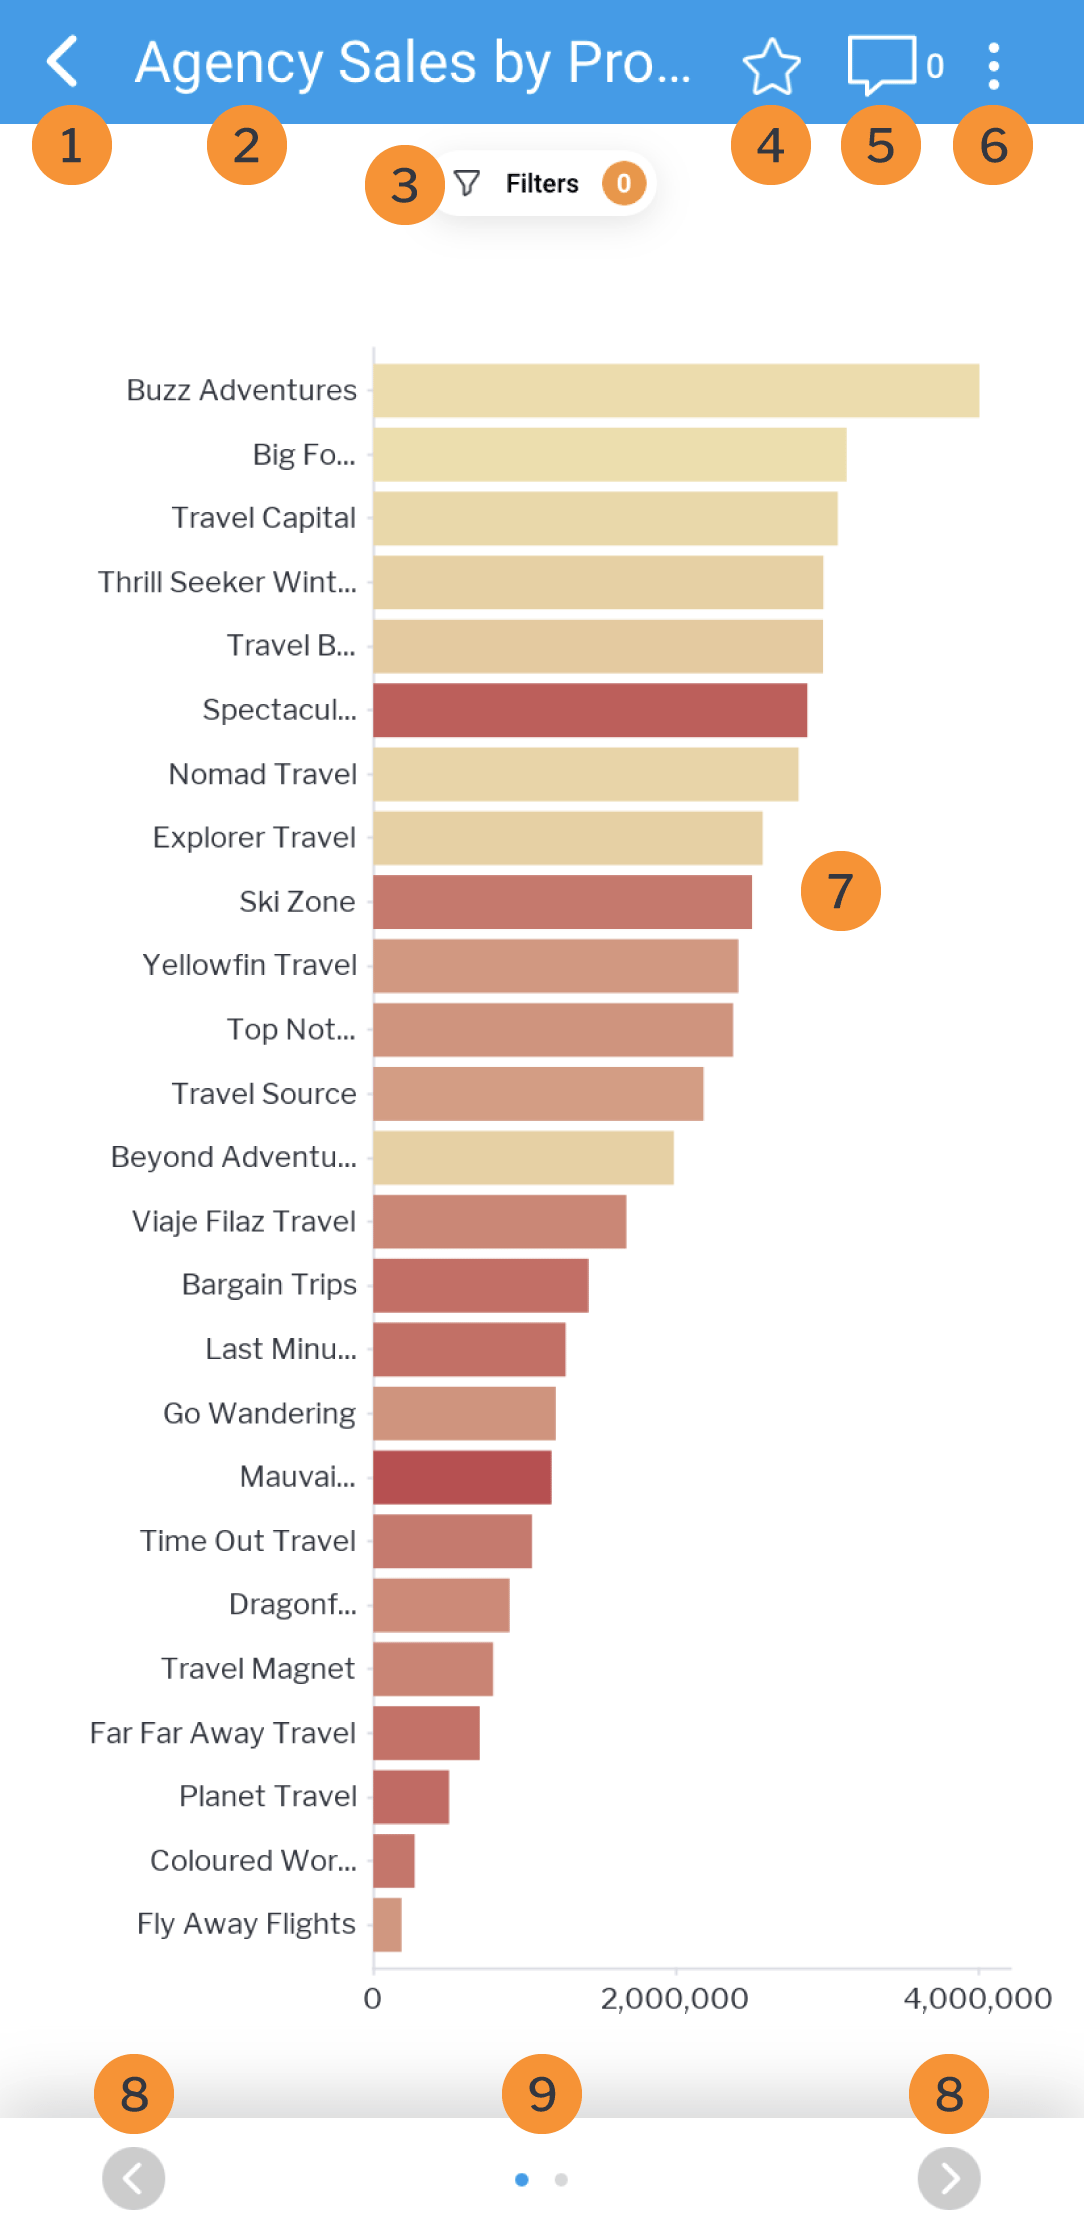
| Number | Feature | Description |
|---|---|---|
| 1 | Back button | Tap the back button |
| 2 | Report title | Displays the title of the report. |
| 3 | Filters button | Tap the filters button |
| 4 | Favorite | Tap on the favorite button |
| 5 | Comments | Tap on the speech bubble button |
| 6 | Report information | Tap the more options button
|
| 7 | Report | Tap the report visualization to highlight one or more elements, or drill for more information. |
| 8 | Report visualization buttons | Tap the arrow buttons |
| 9 | Carousel indicator | Displays the number of available report visualizations. |
| Anchor | ||||
|---|---|---|---|---|
|
Yellowfin reports may contain many different visualizations, ranging from tabular data and/or charts. Depending on the report, you can toggle between all available visualizations on the mobile app.
To switch visualizations, follow the steps below:
- Open a report by tapping on a report tile
You can access reports from the Reports list, or from your Timeline - Tap on the report visualization arrow button at the bottom right of the report page
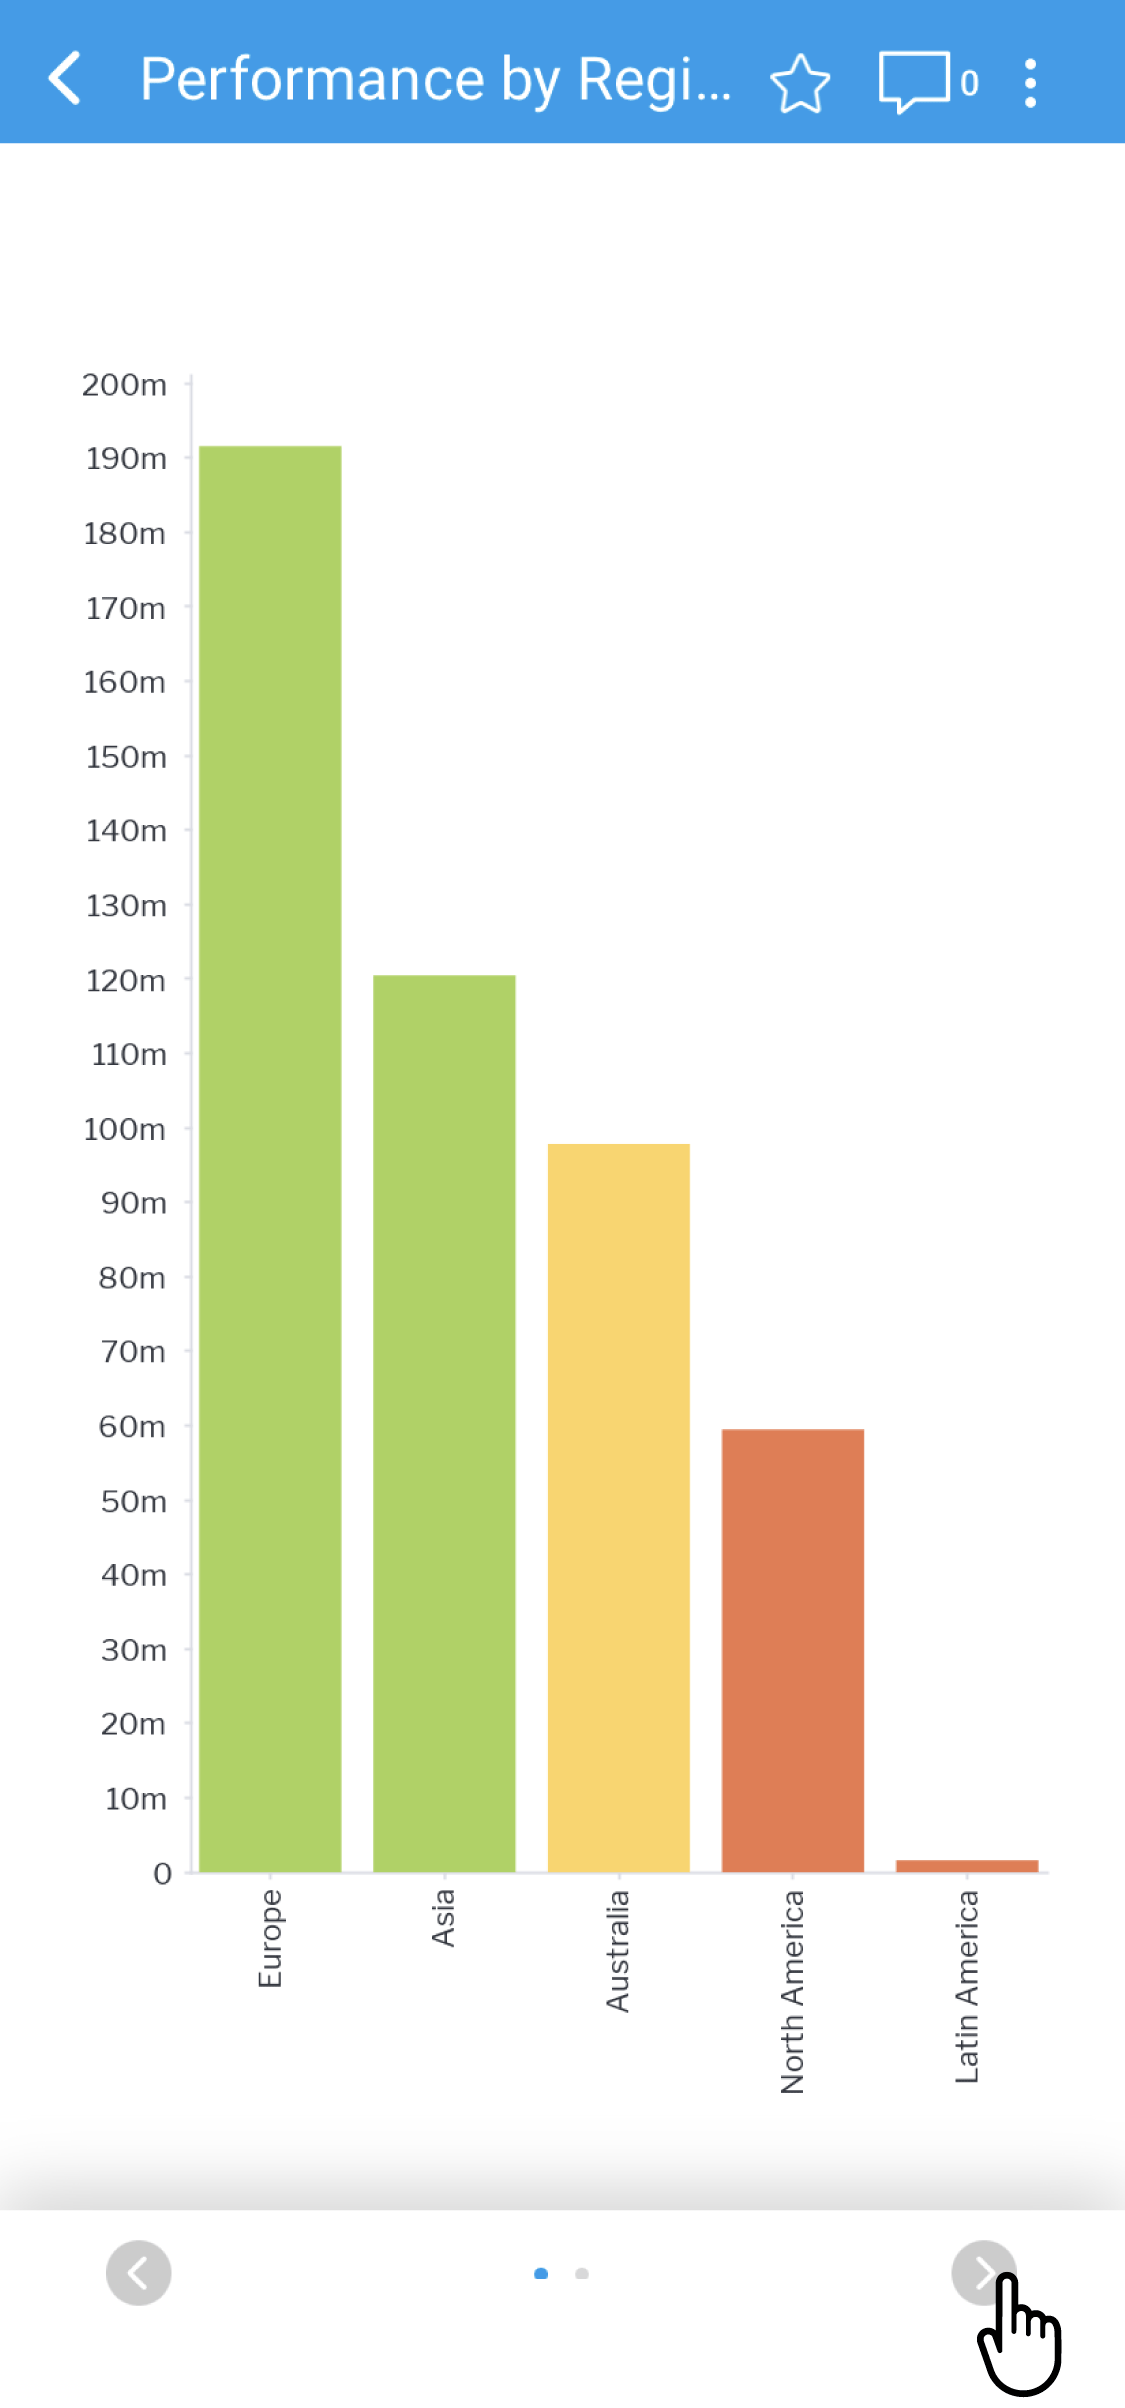
An alternate report visualization will be displayed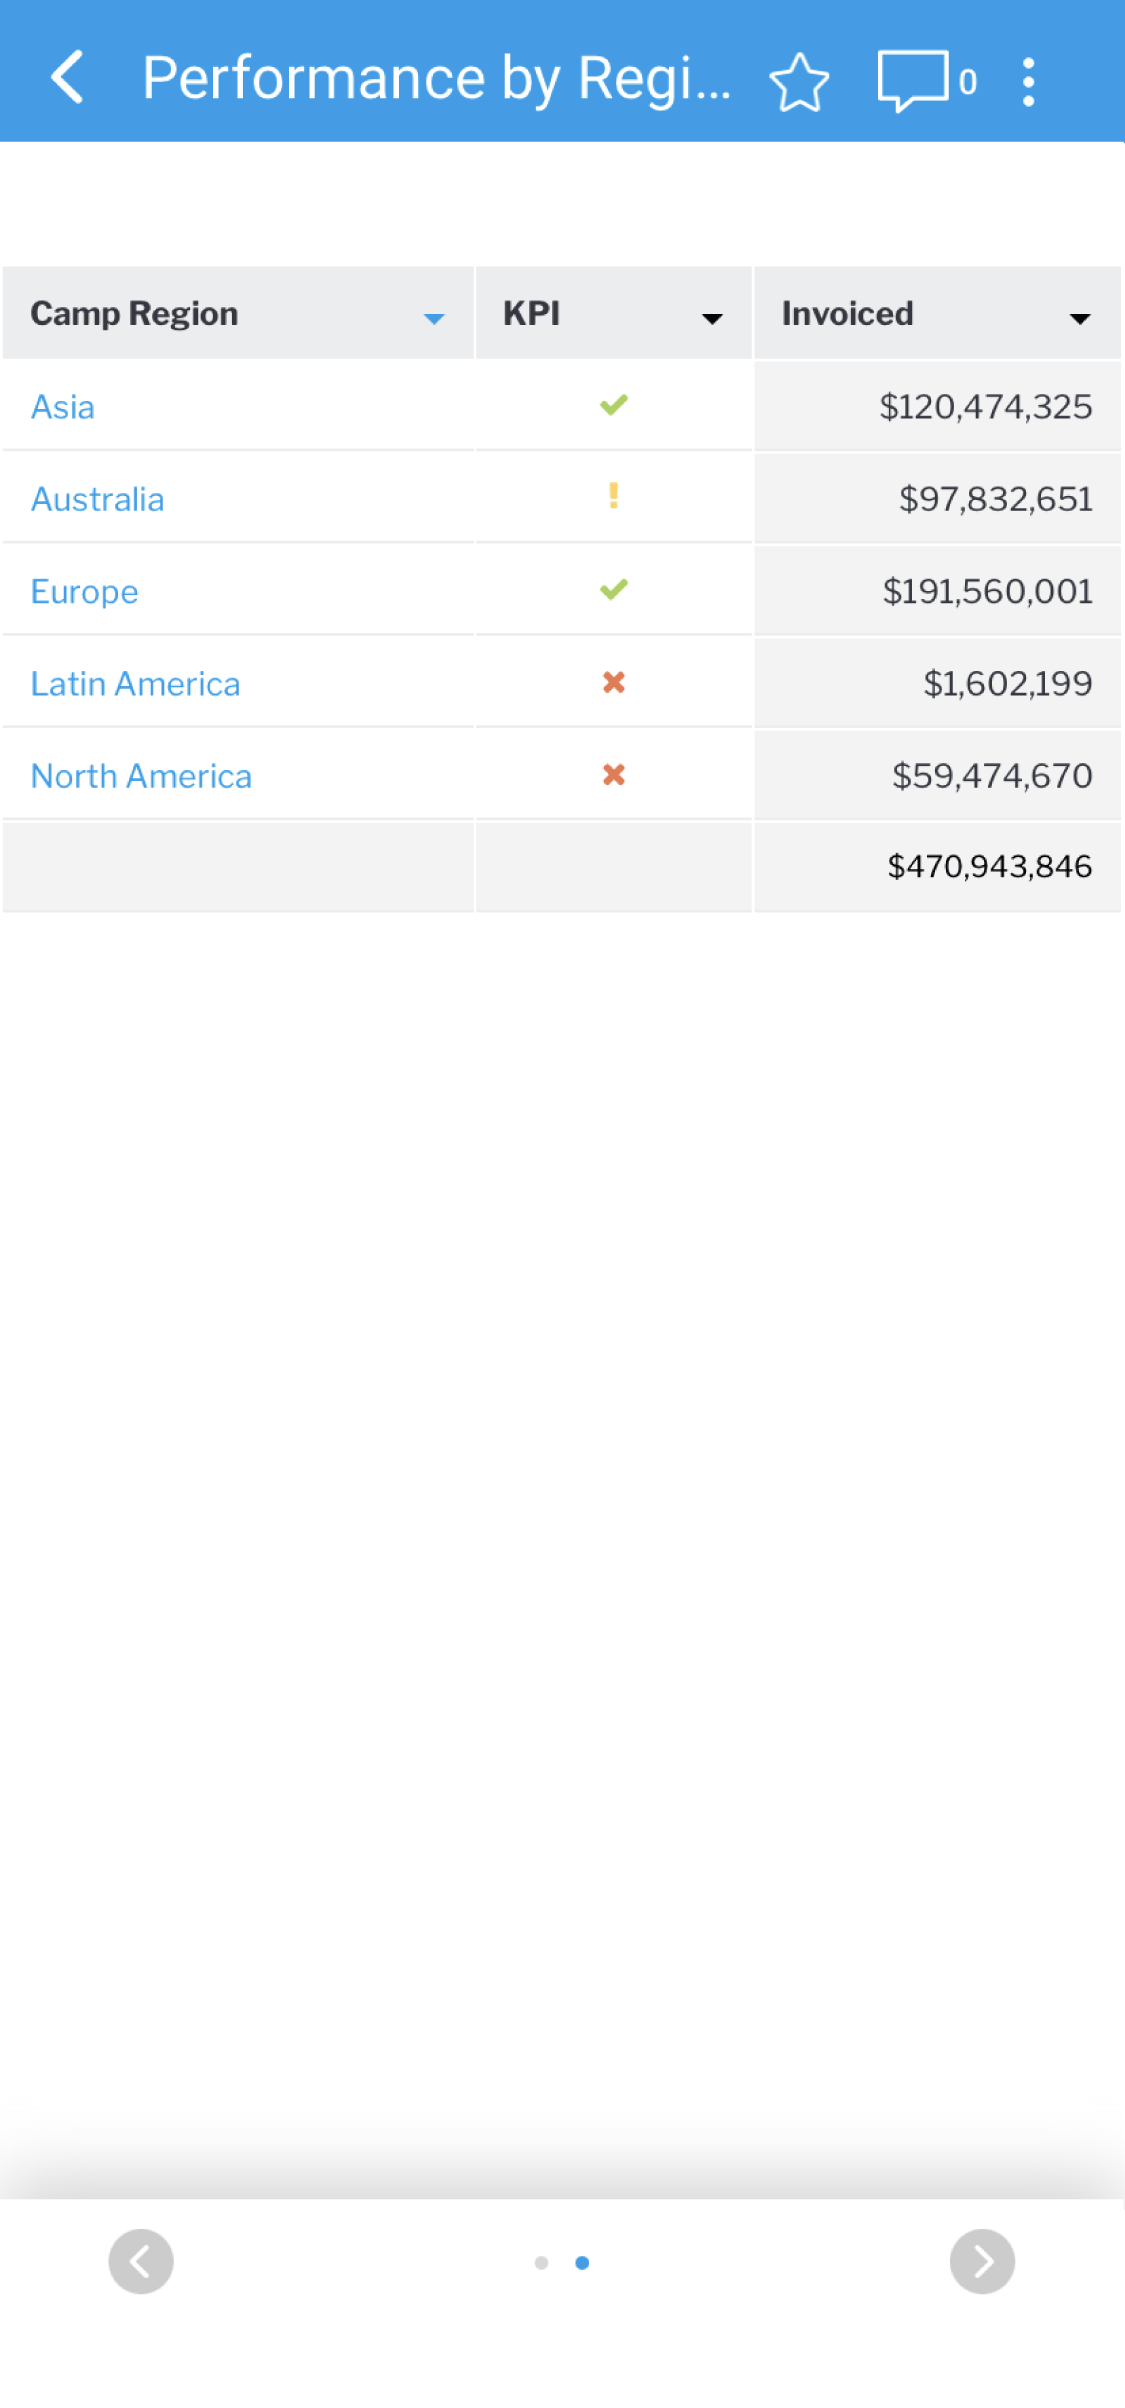
- Take note of the number of dots between the two arrows at the bottom of the screen: this indicates the number of report visualizations that are available
| Styleclass | ||
|---|---|---|
| ||
Anchor filteringreports filteringreports
Filtering data
| filteringreports | |
| filteringreports |
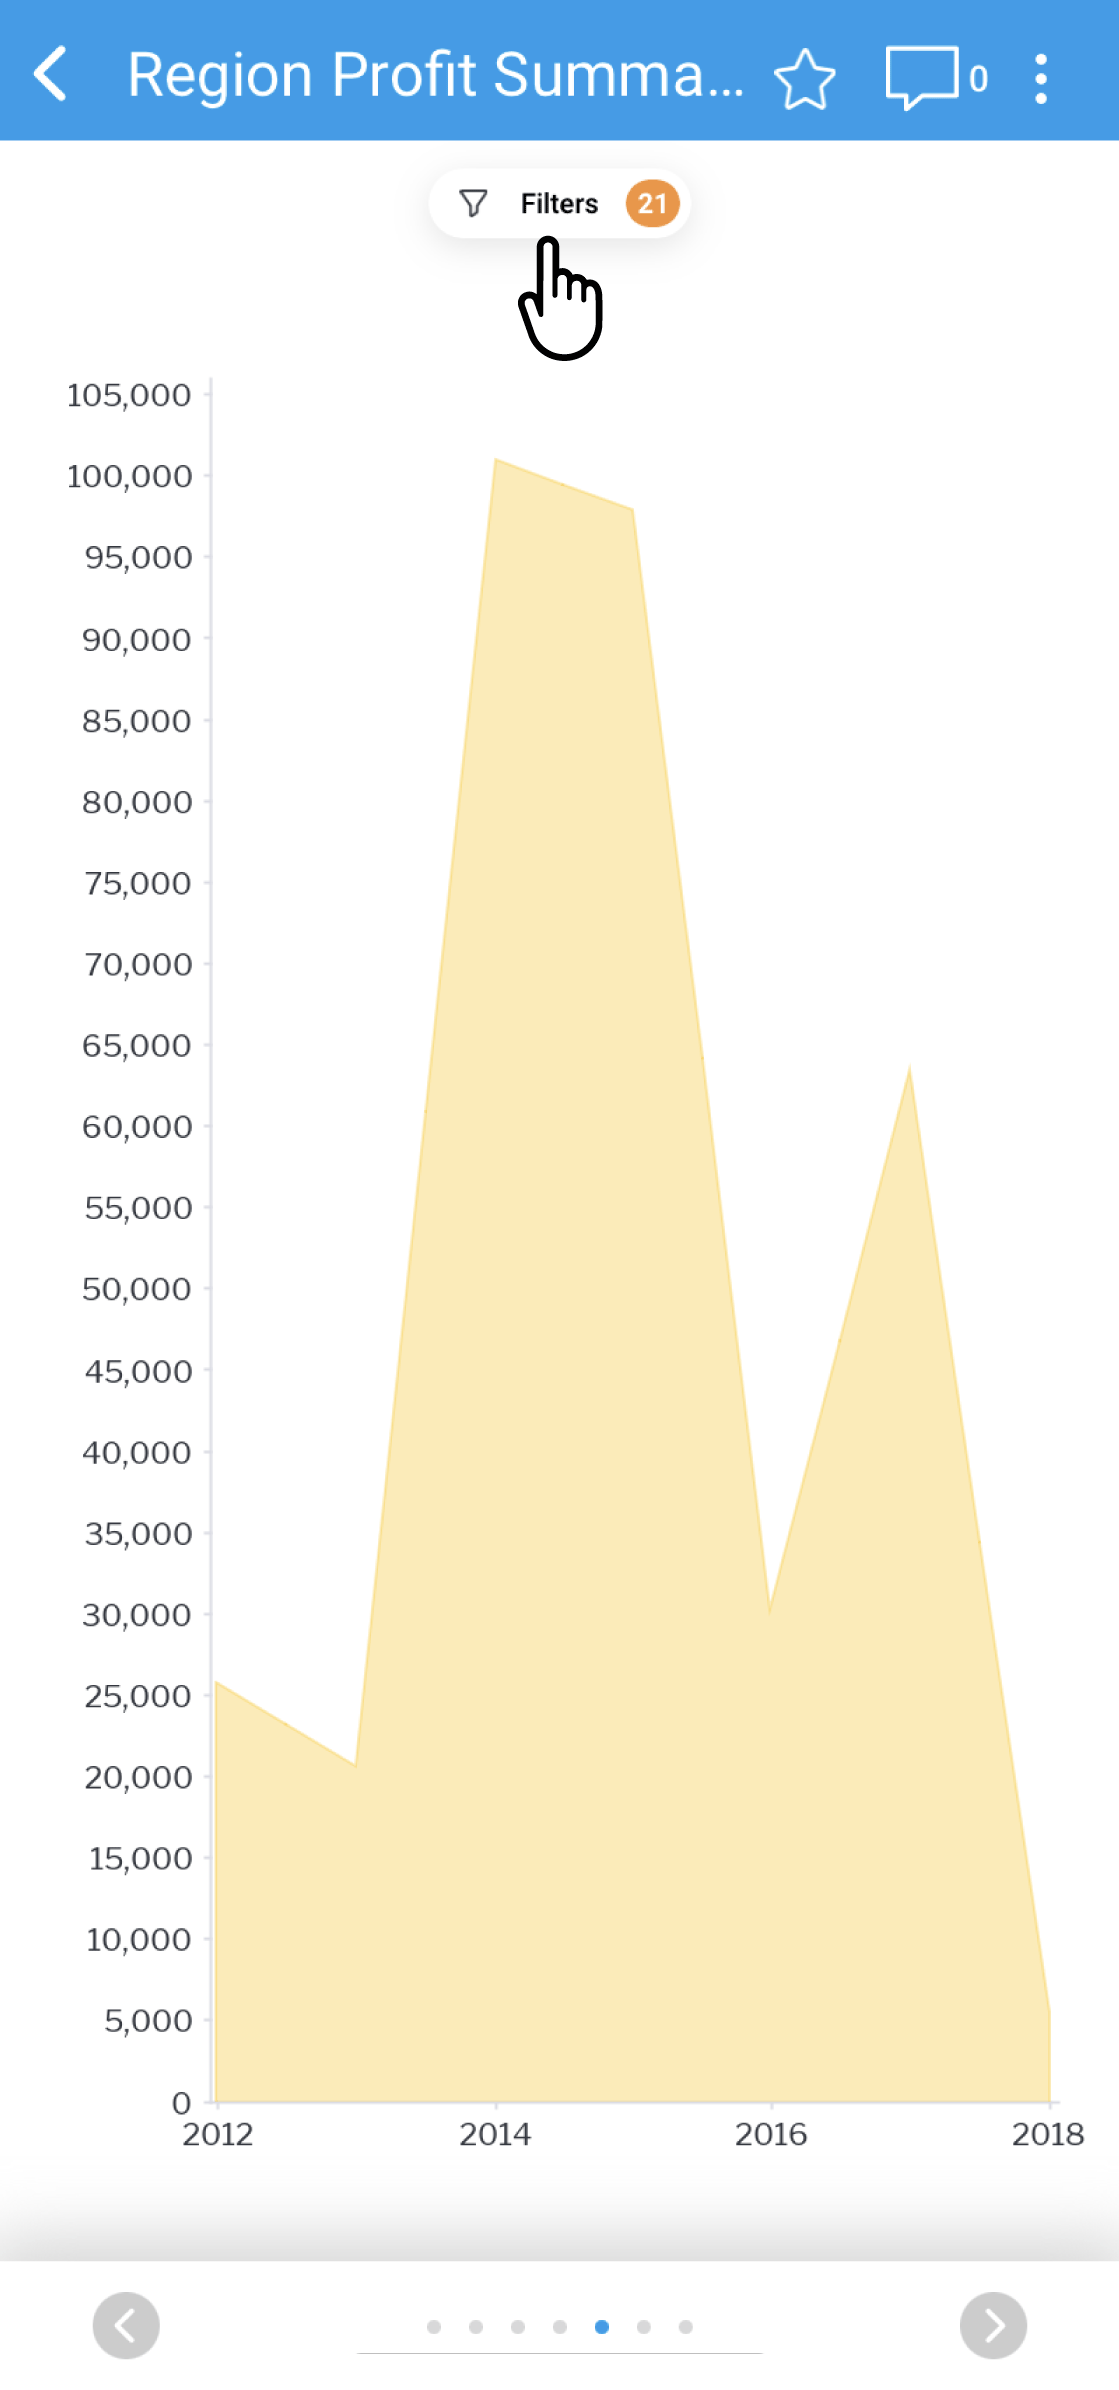
Filters allow you to refine the results displayed in a report based on the values selected for the filter.
The Filters button incorporates a number which indicates the number of filters applied to the report. Upon opening a report for the first time, this number will reflect the amount of default filters applied. In this case, the number reads ‘0’, as no filters are applied. When you apply one or more filters, the number will change to the respective number of applied filters.
| Note |
|---|
Reports with larger datasets may take longer to run. A loader will be displayed on the screen. |
| Tip |
|---|
Filters may not be available on all reports. Look for the Filters button at the top of the report page. |
To filter data, follow the steps below:
- Open a report by tapping on a report tile
You can access reports from the Reports page, or from your Timeline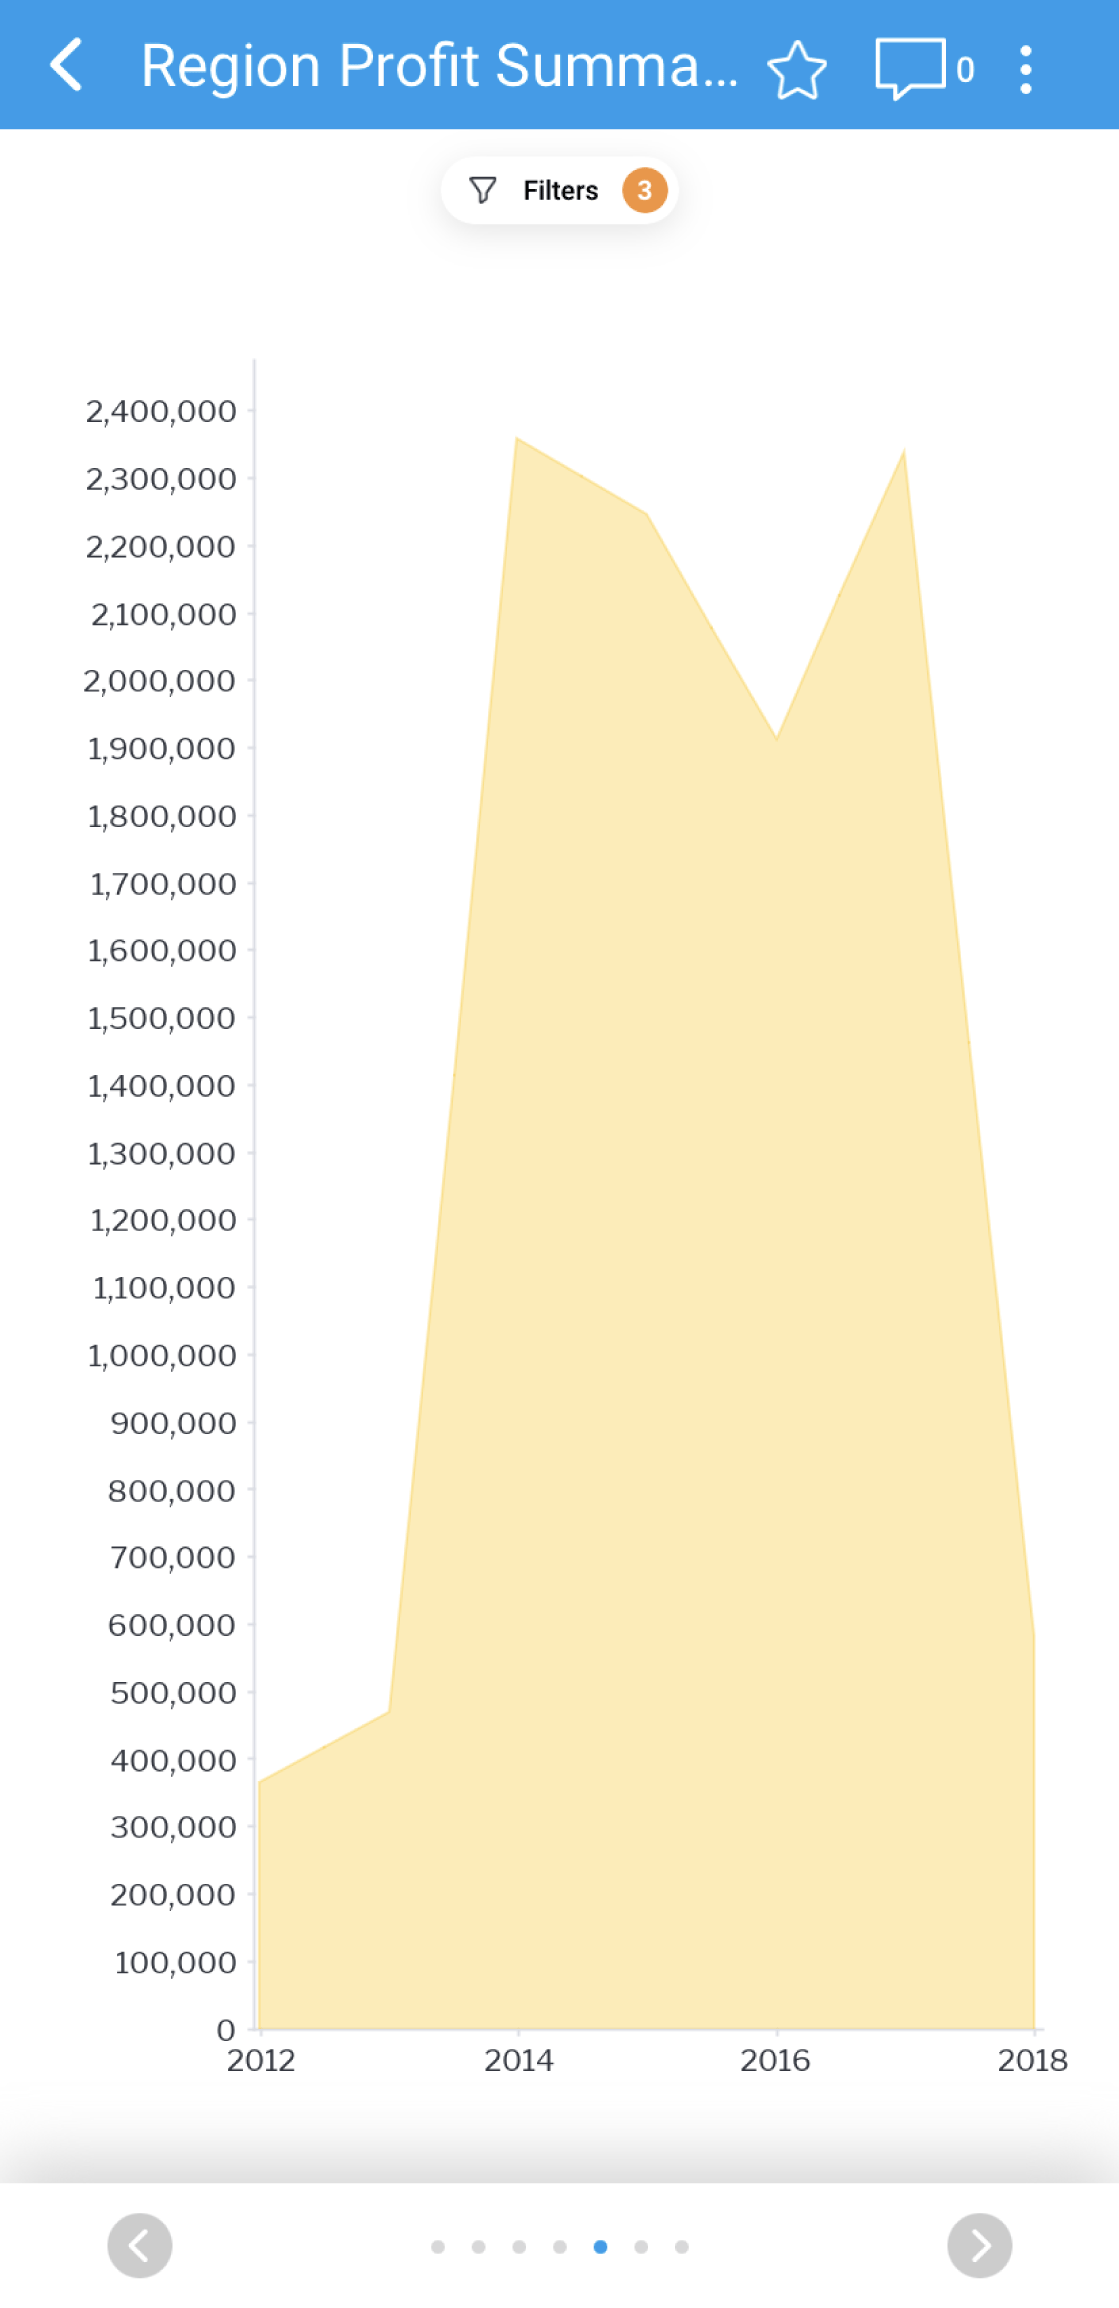
- Tap on the Filters button
For this report, the Filters button number currently reads ‘3’, which means there are 3 filters applied by default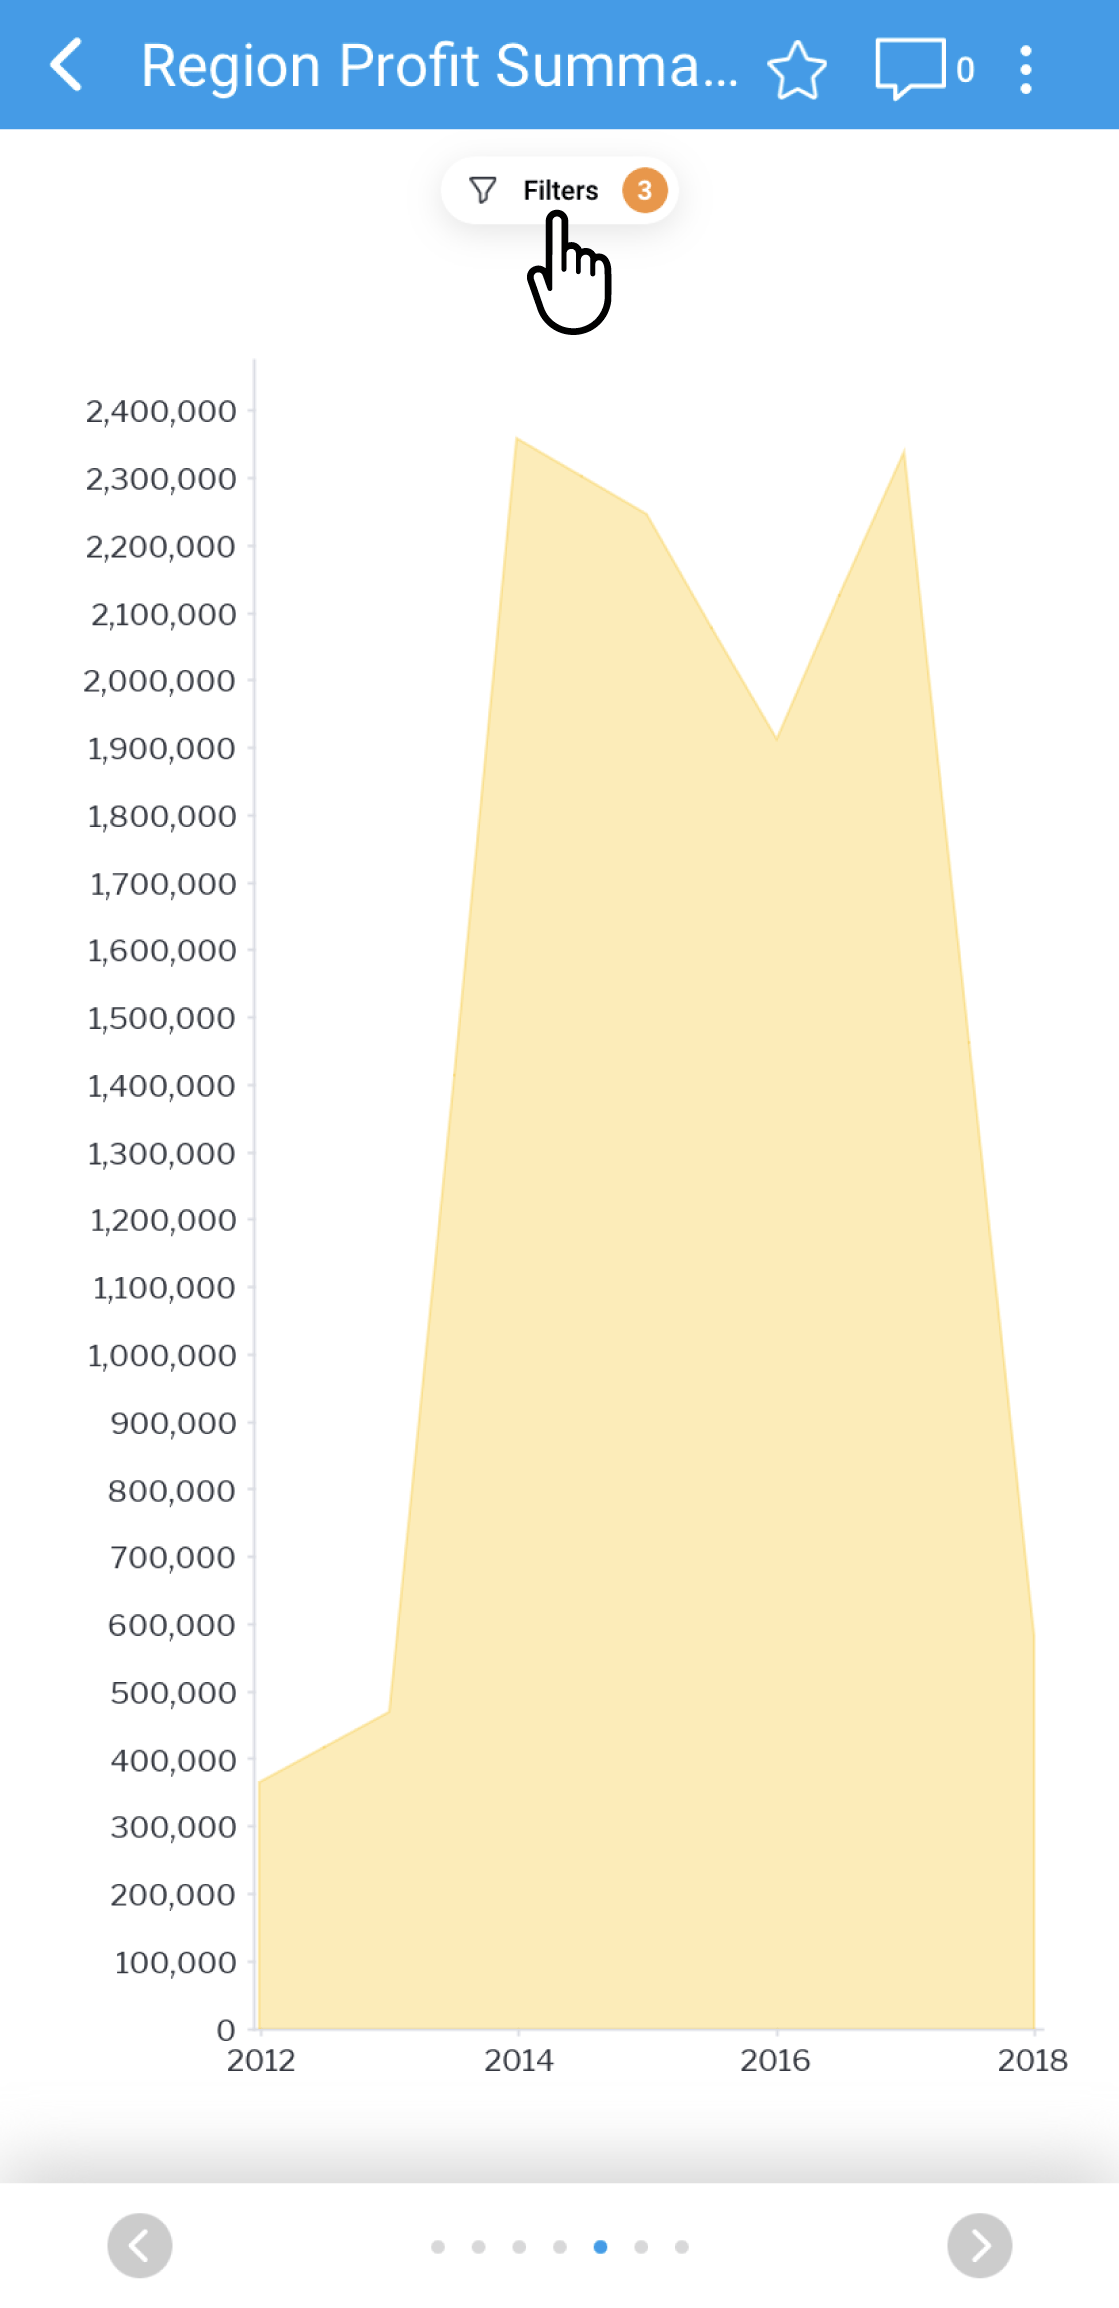
The filters panel will appear on the screen, showing all available filters for this report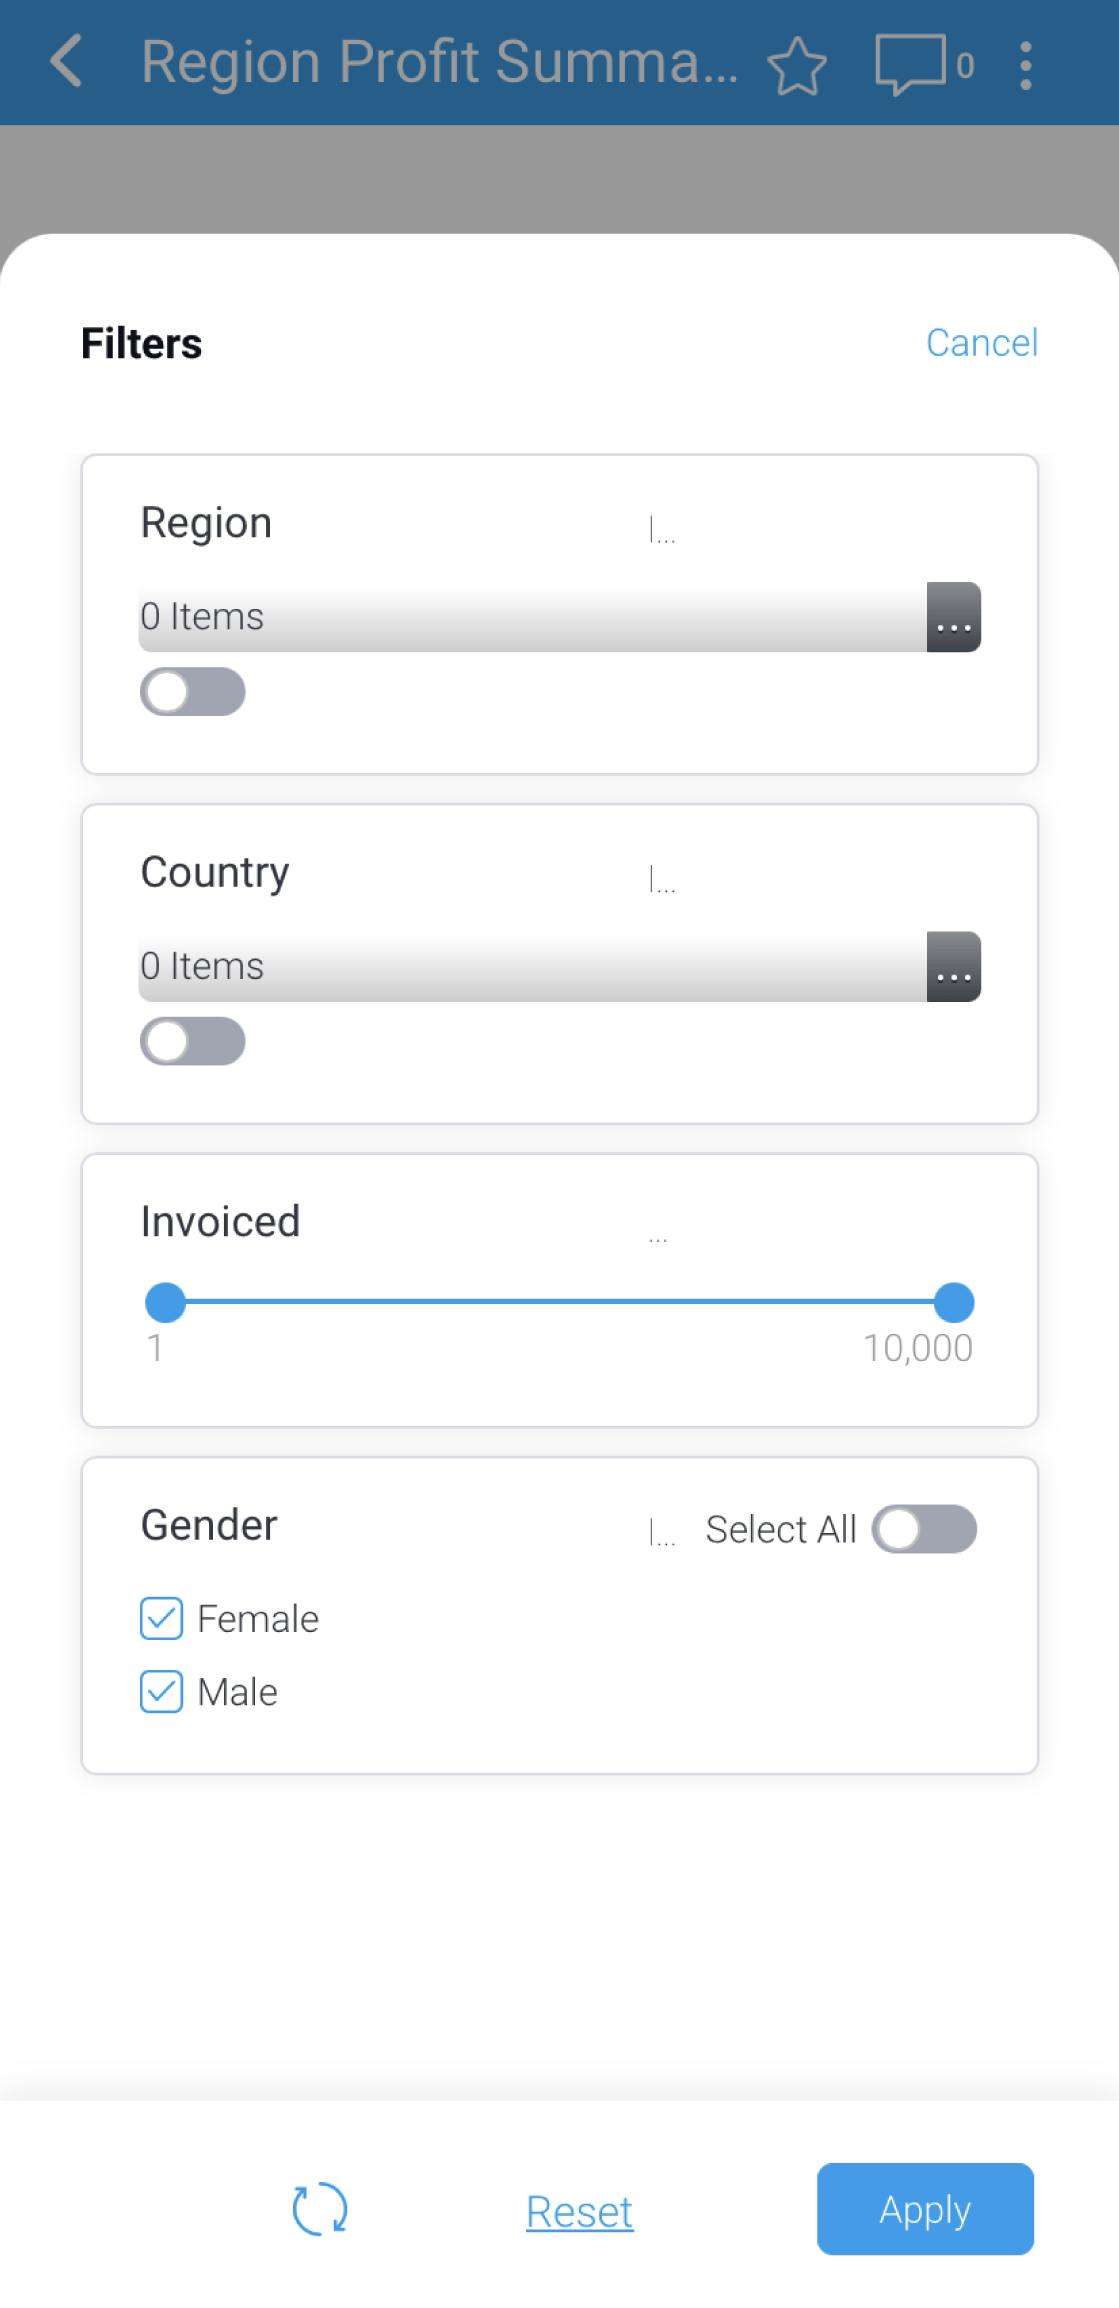
- To abandon filter settings at any time, tap Cancel at the top-right of the screen
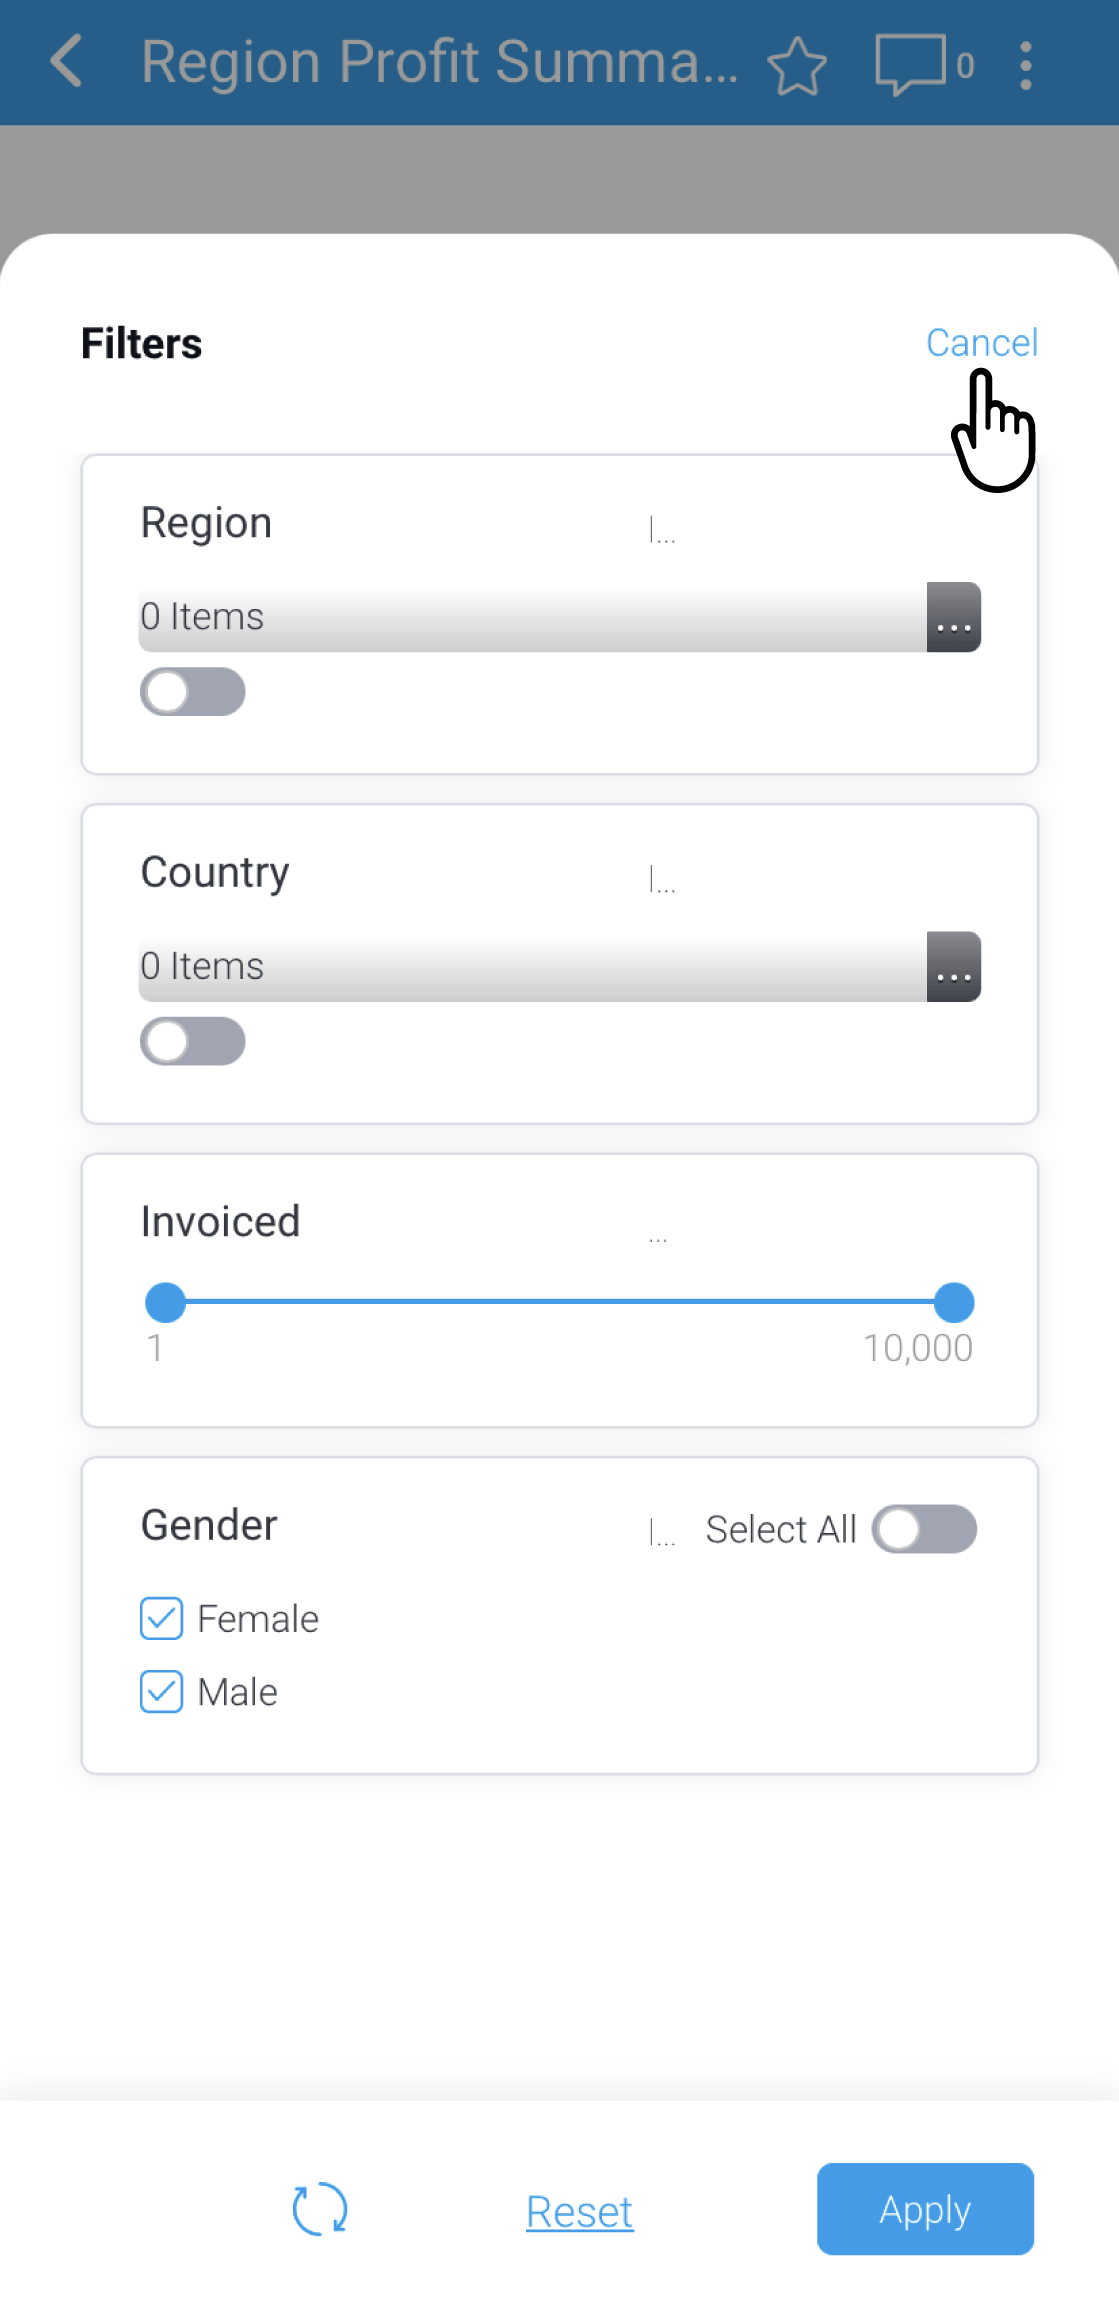
The report will be displayed - Tap the Filters button again to apply one or more filters
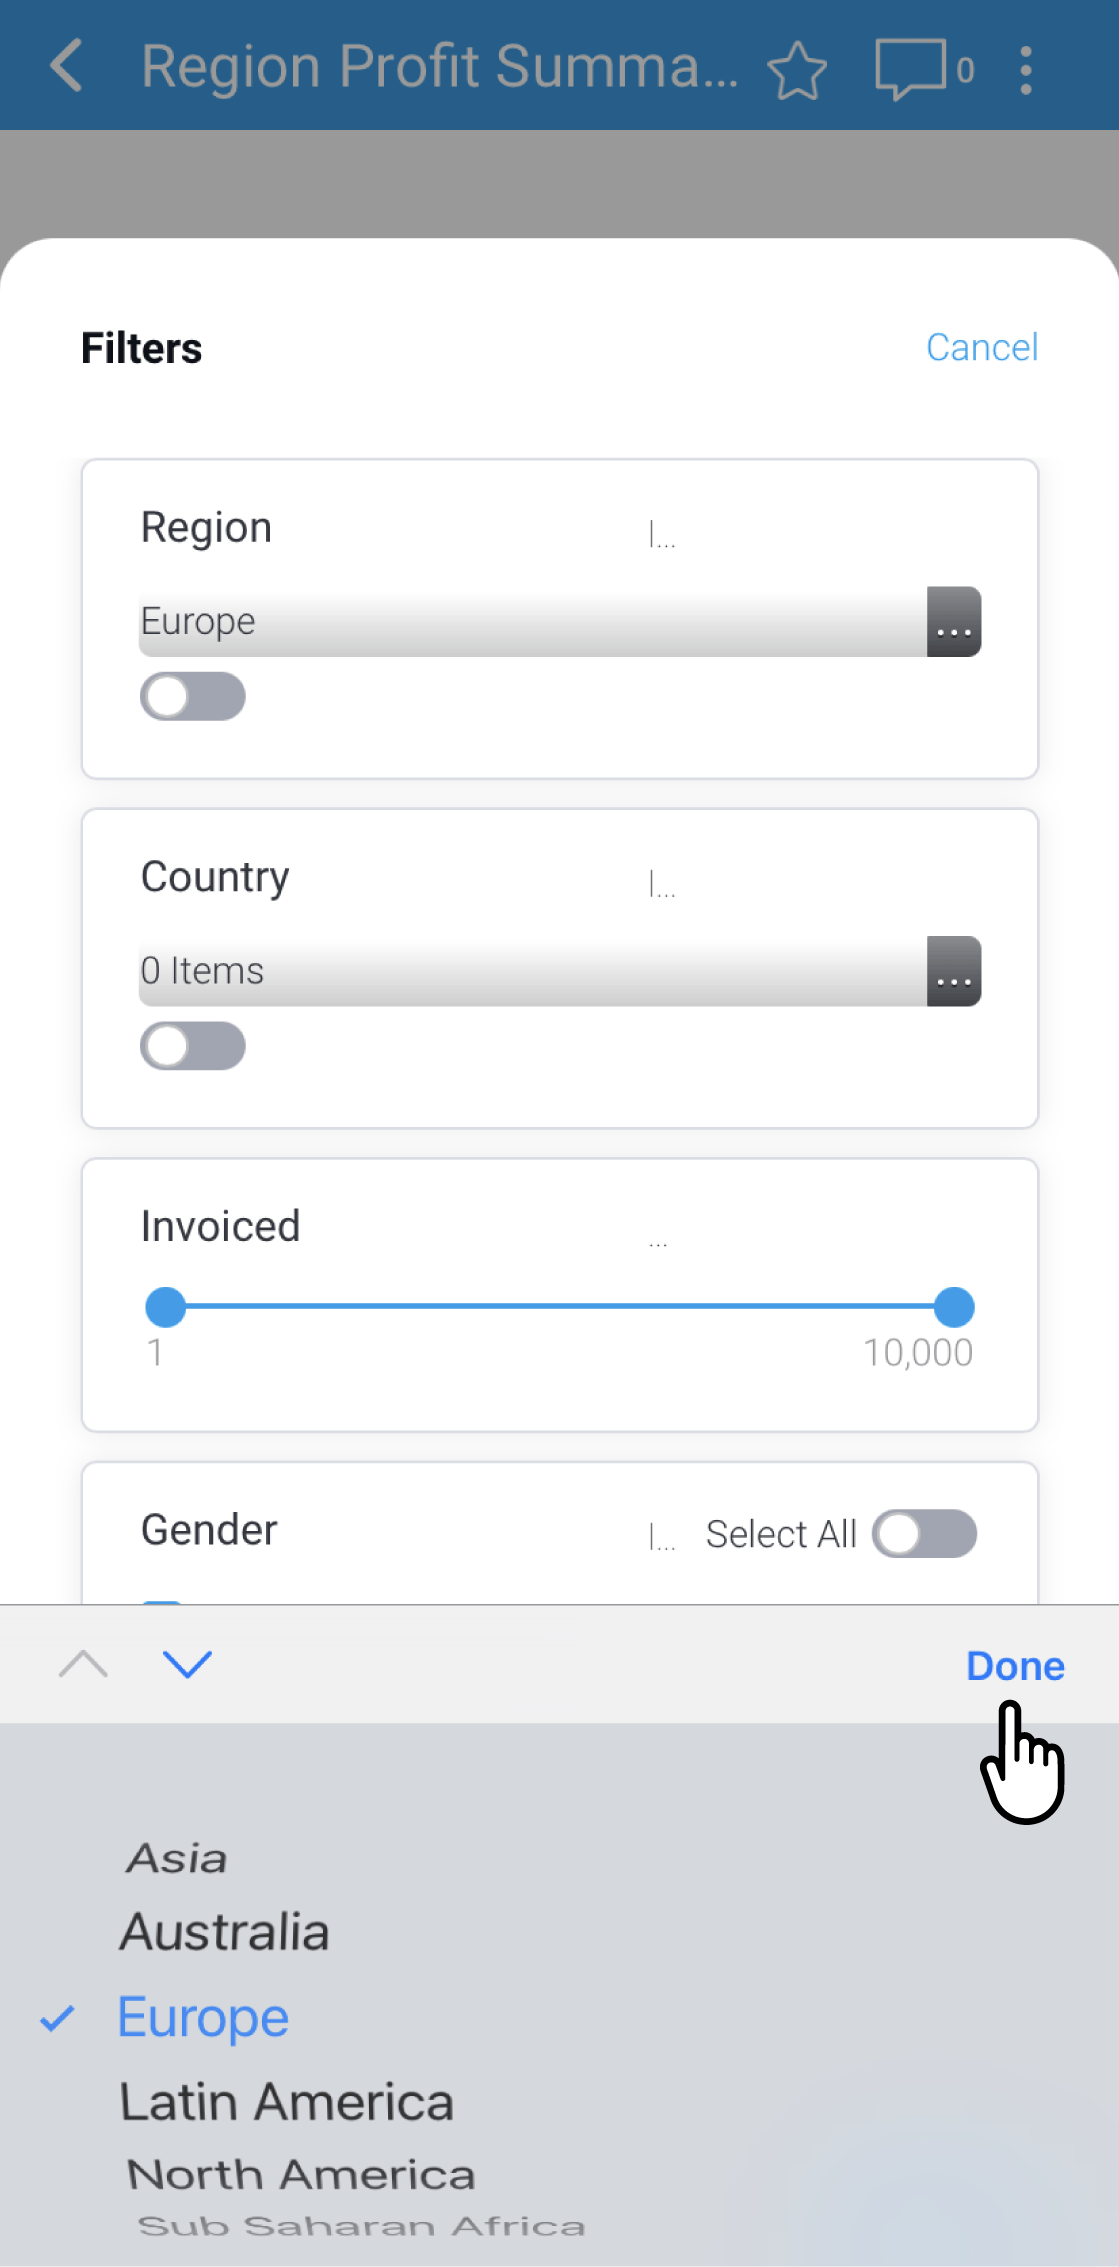
- Tap on the Region filter dropdown
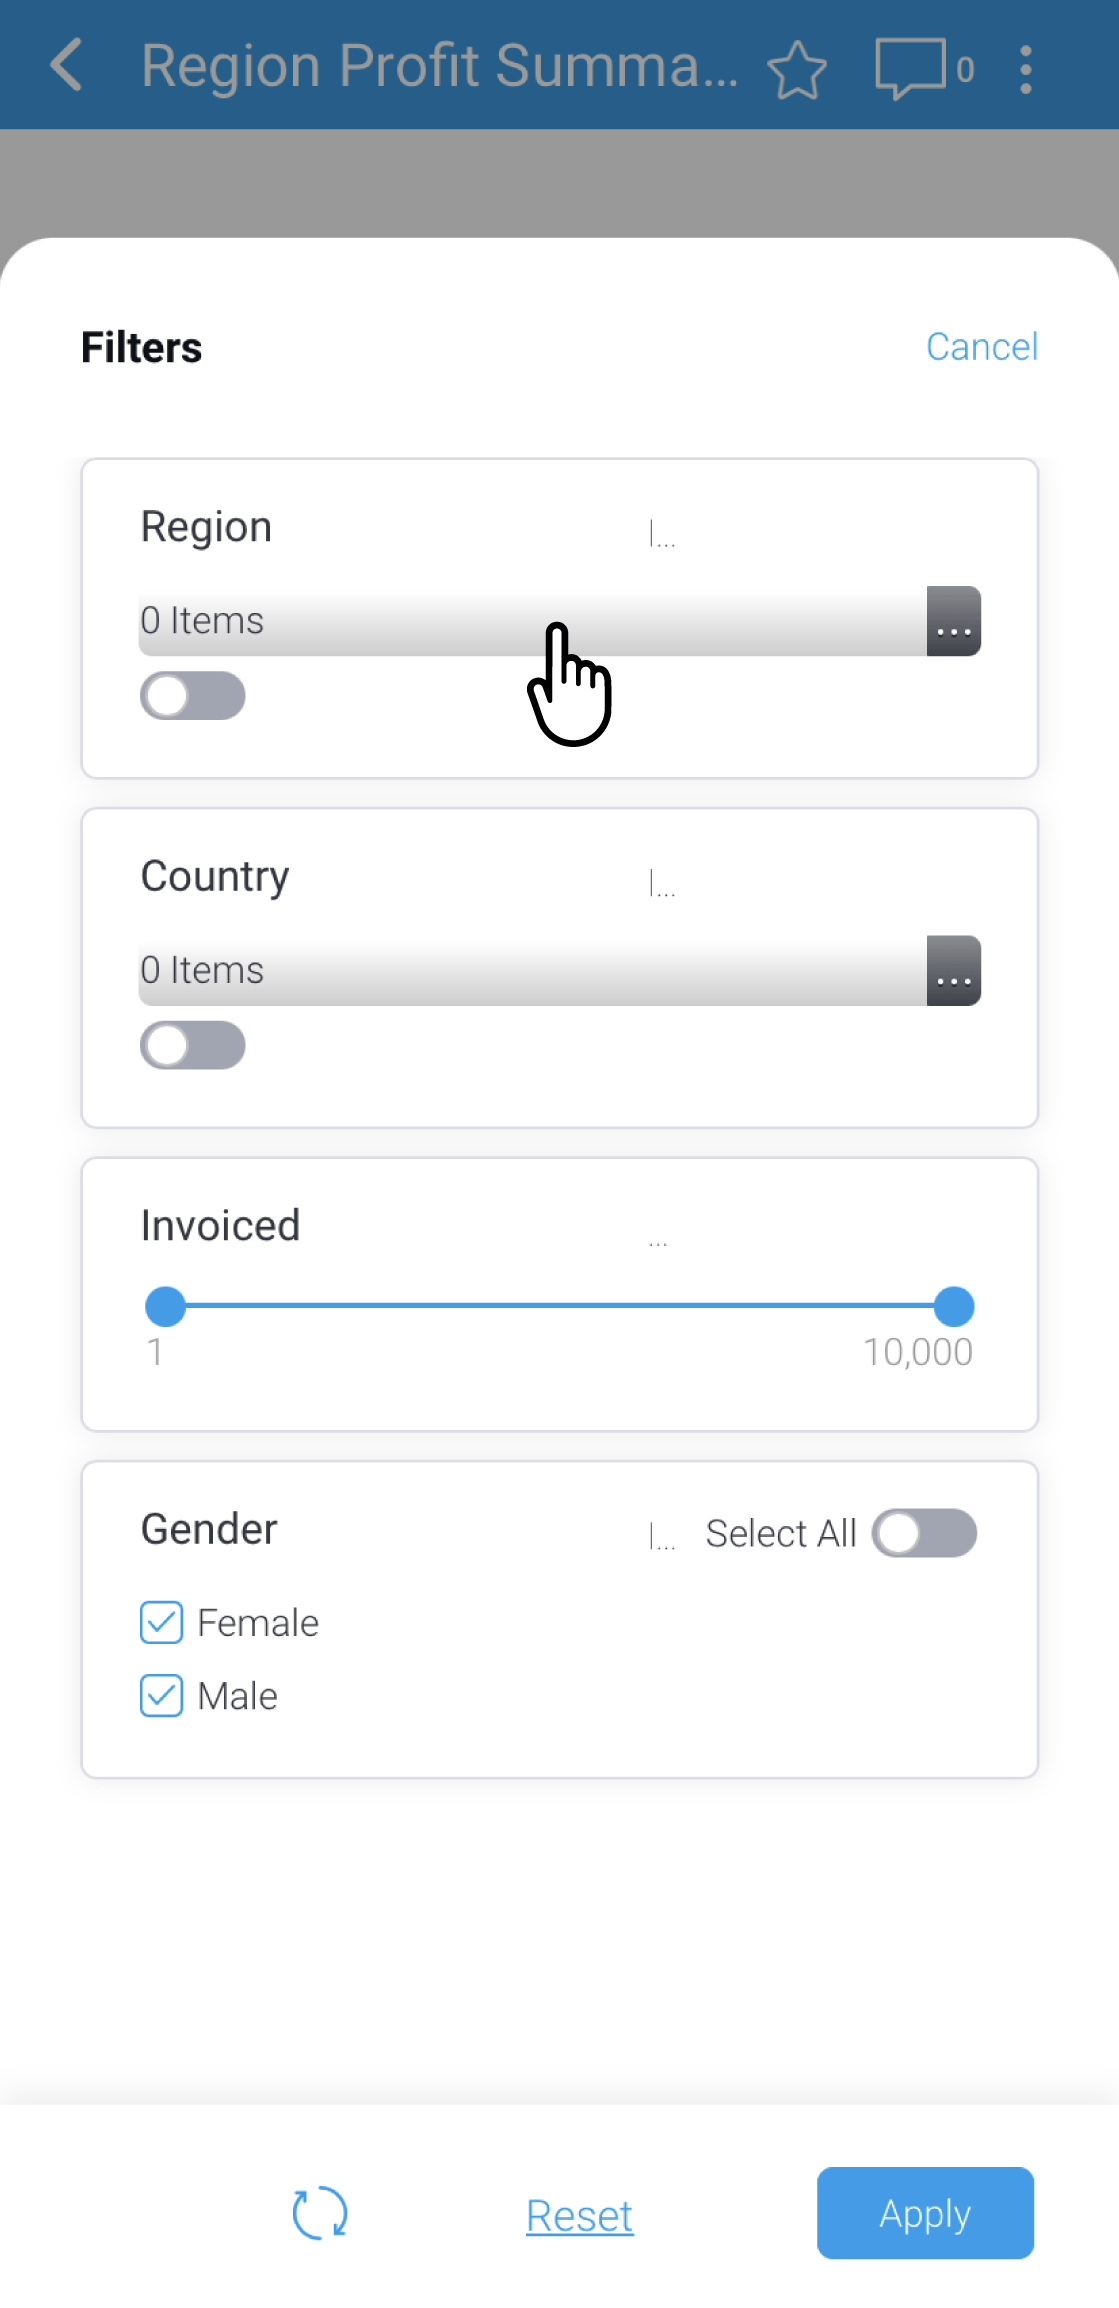
- Select one or more regions, then tap Done to apply the region filter
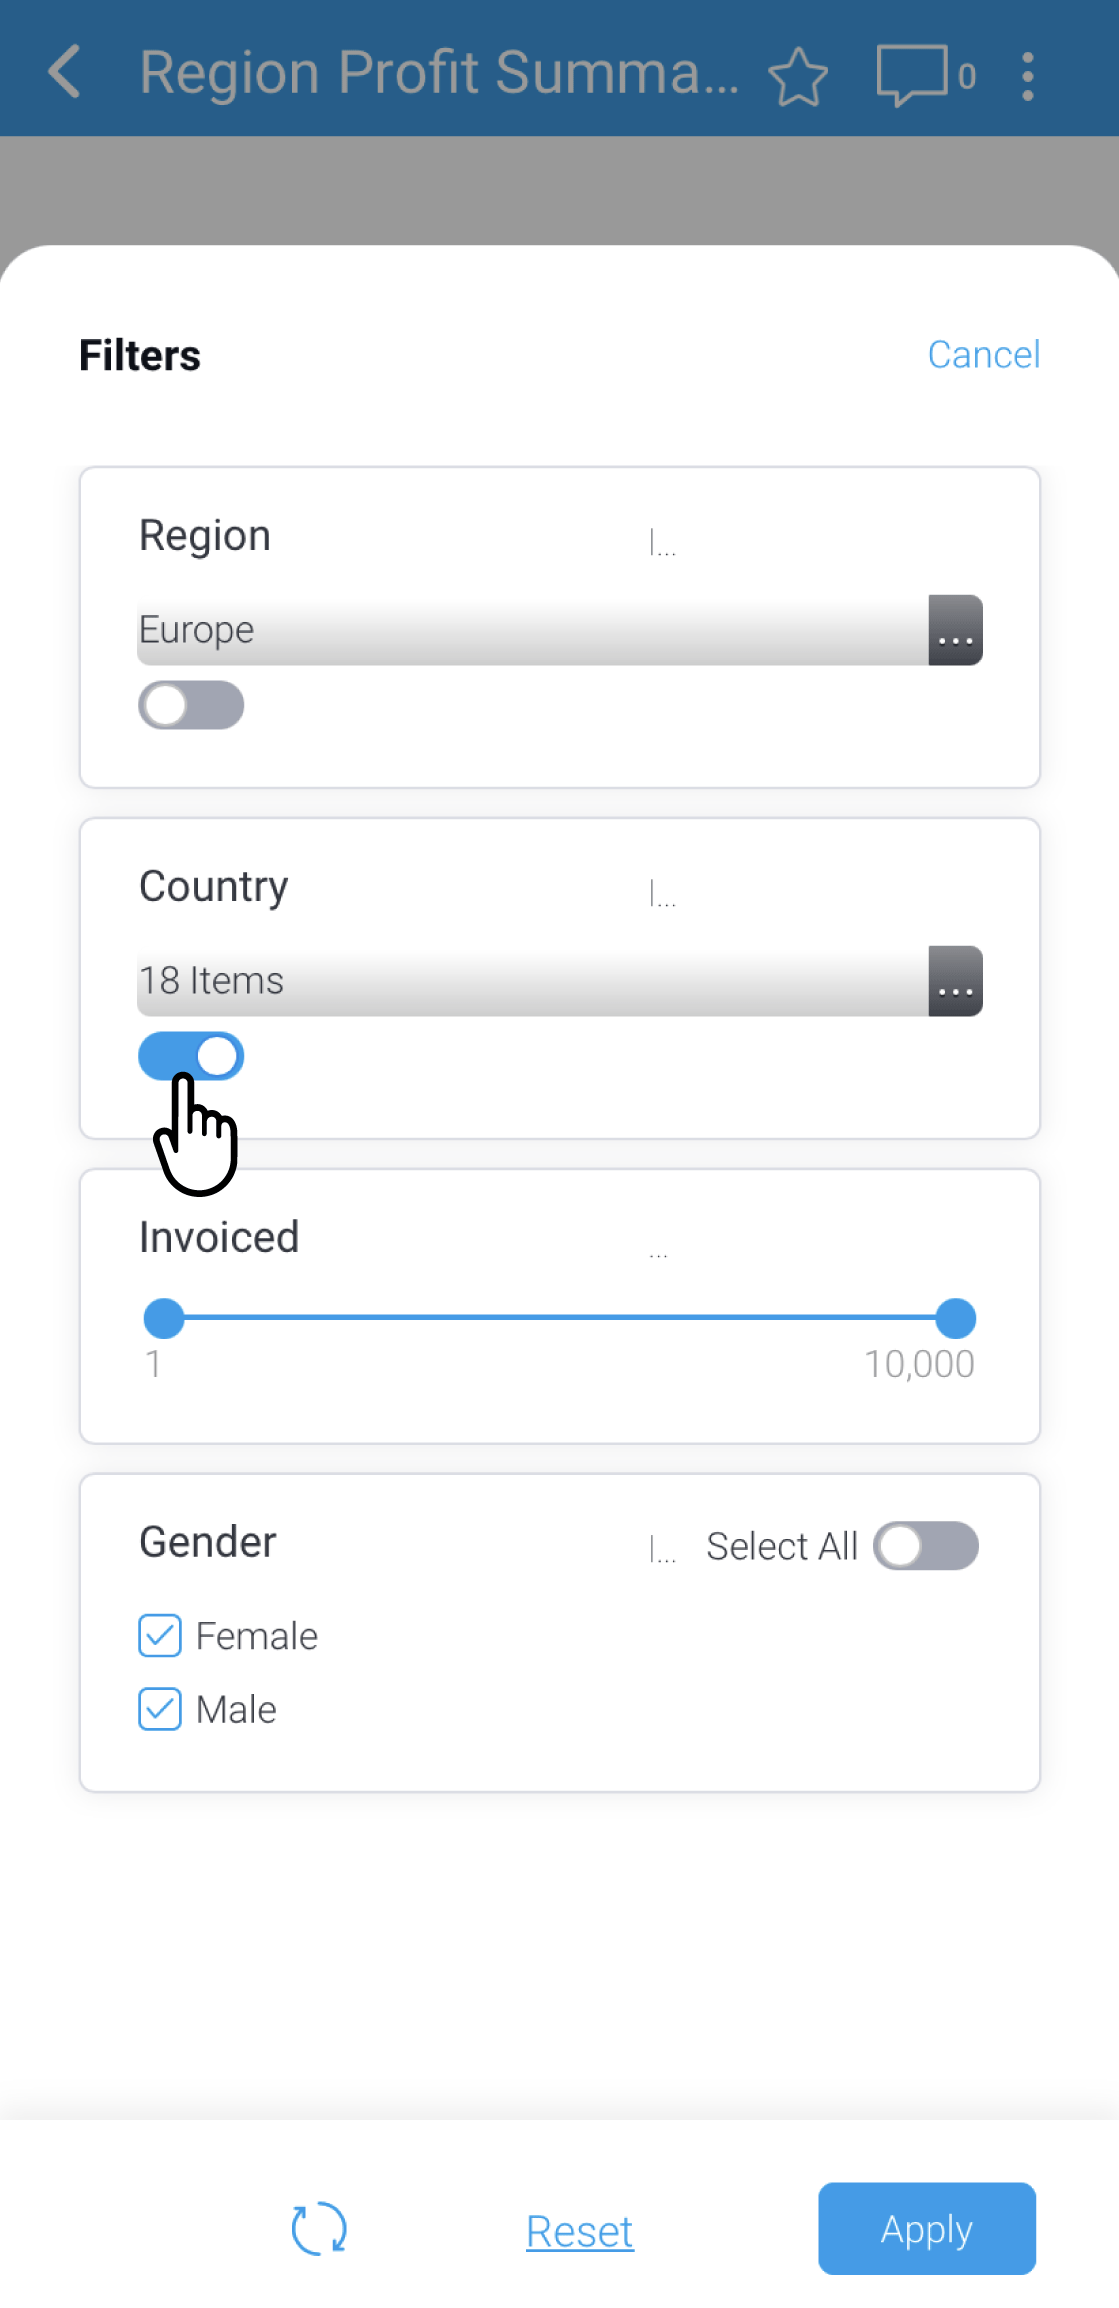
- Tap the toggle on the Country filter to select all values within that filter
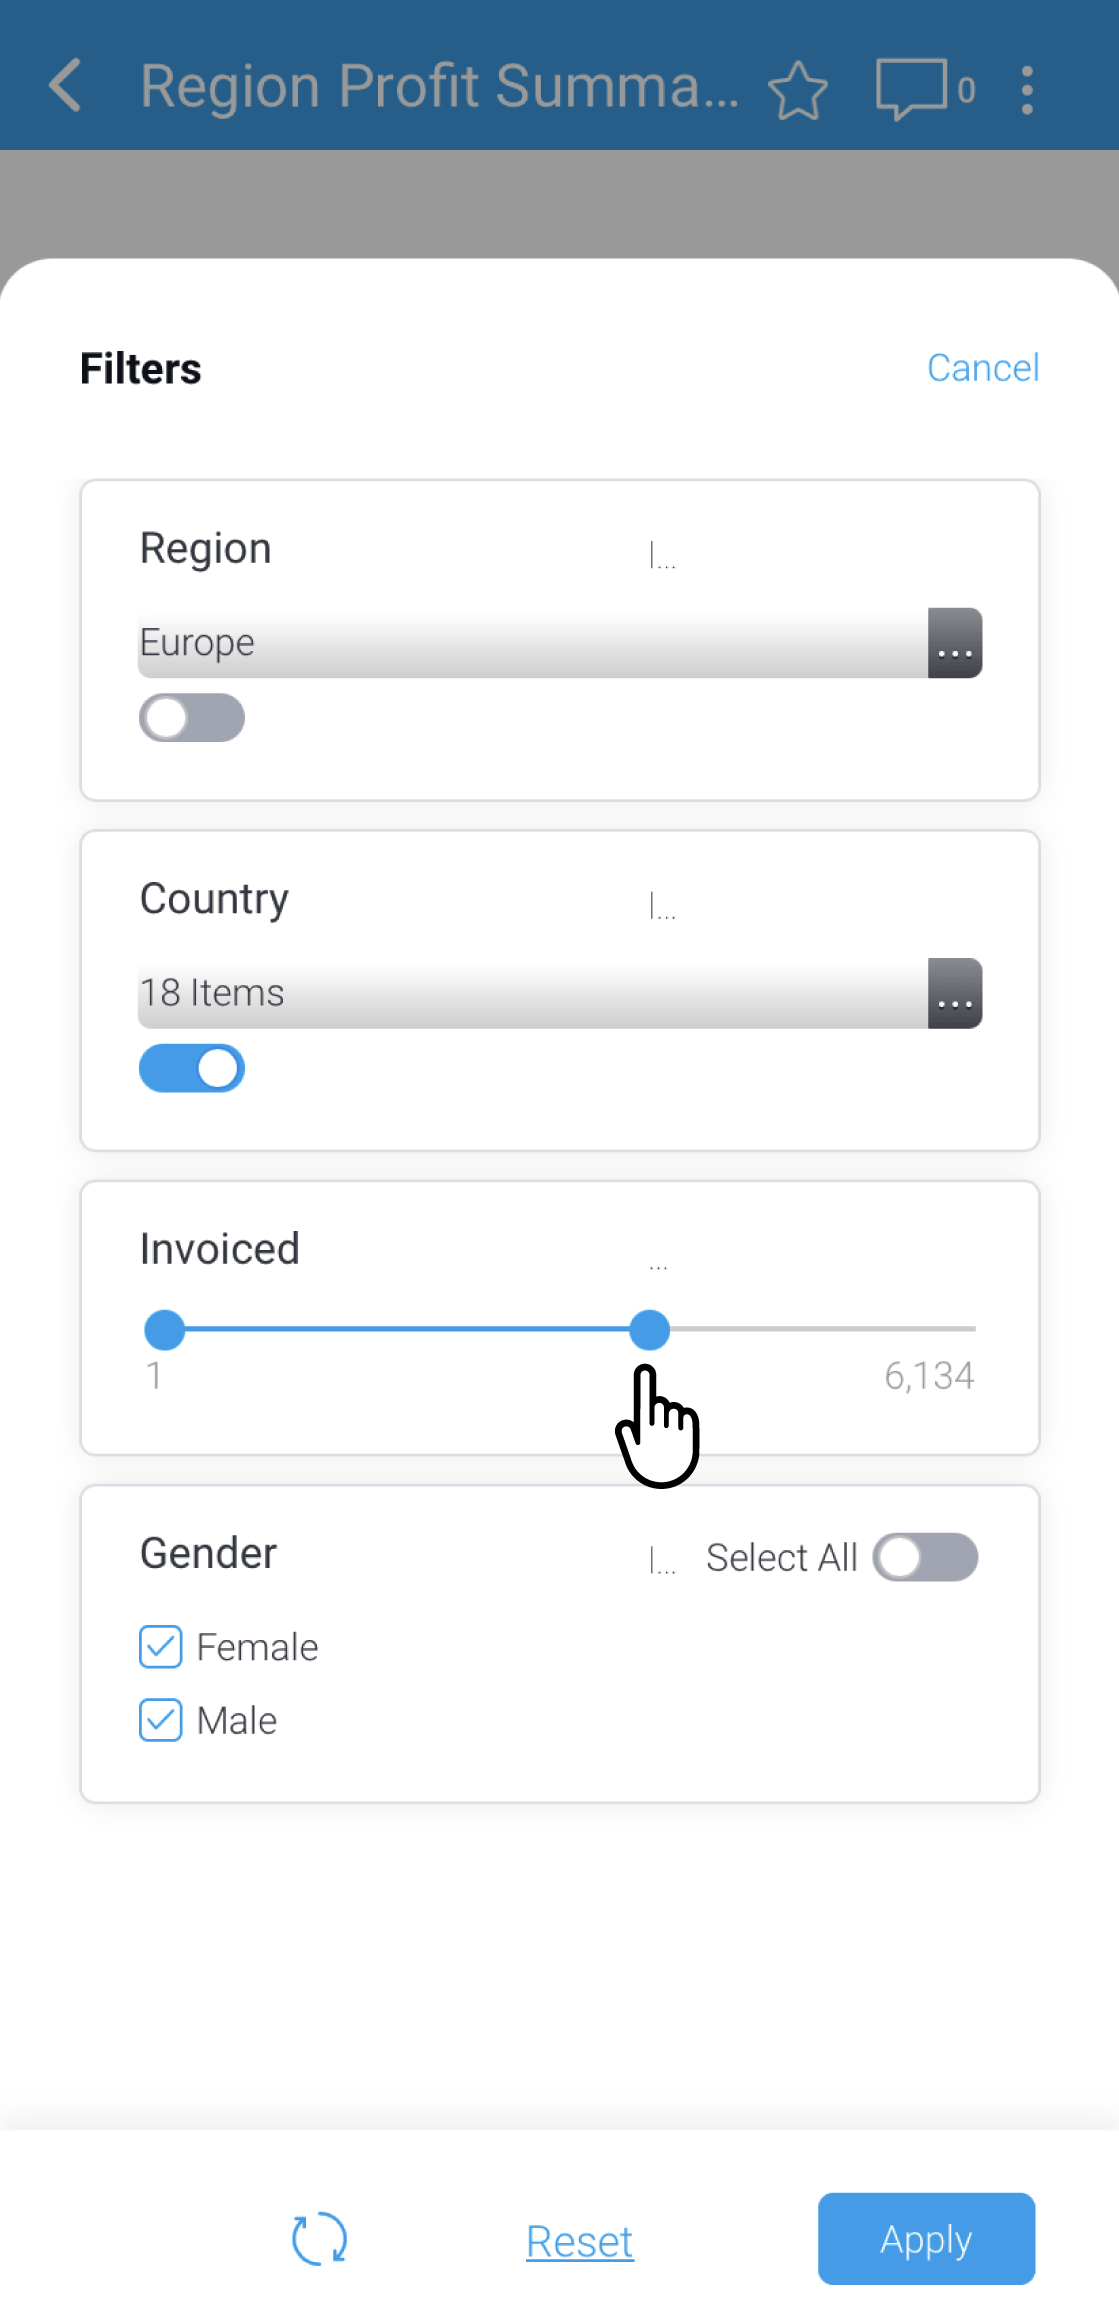
- Tap and drag the slider on the Invoiced filter to refine the number of values shown
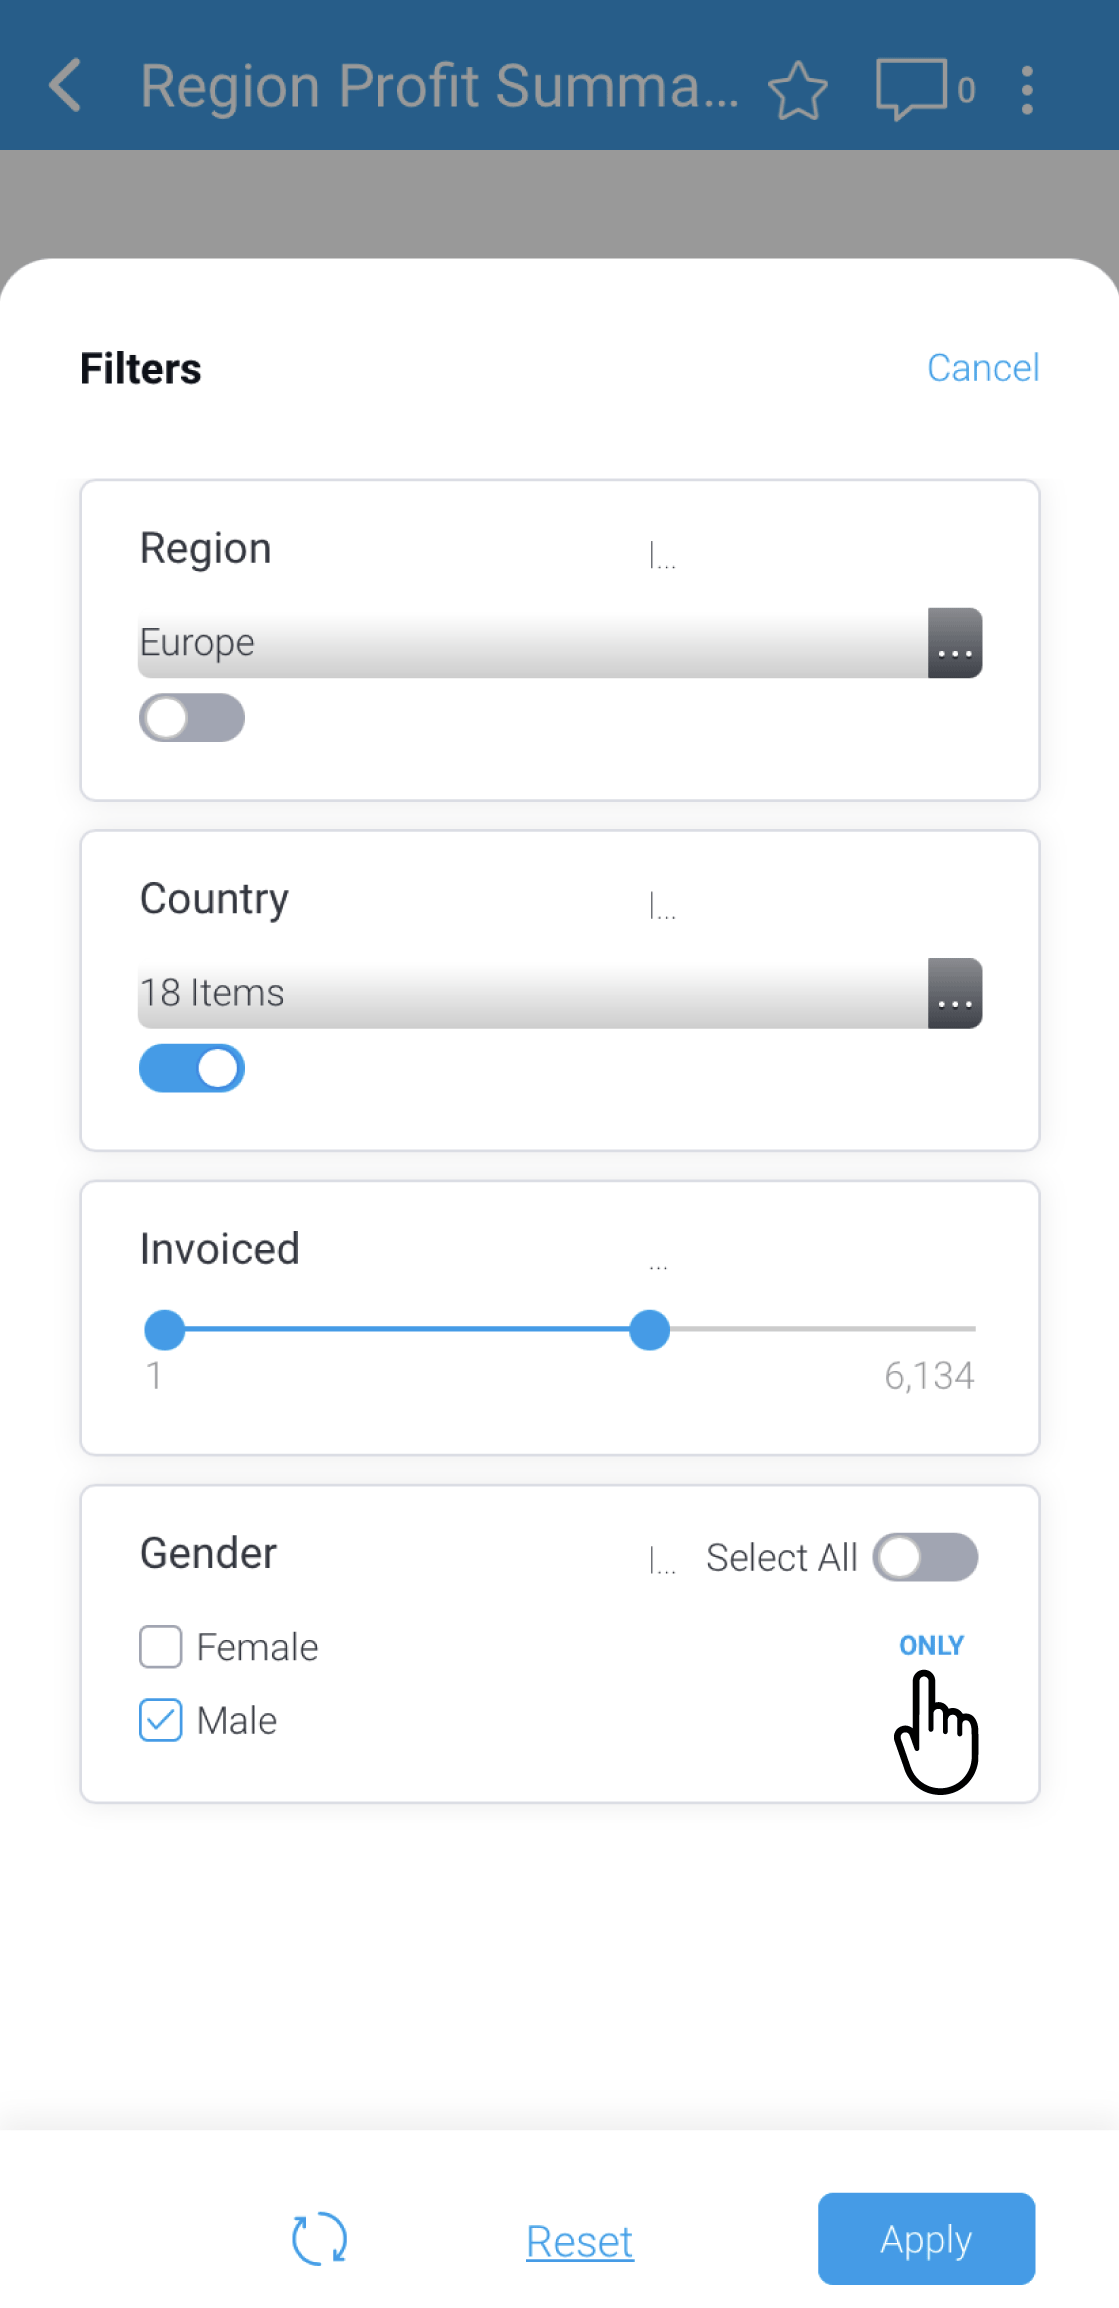
- Tap the checkbox in the Gender filter to remove that value
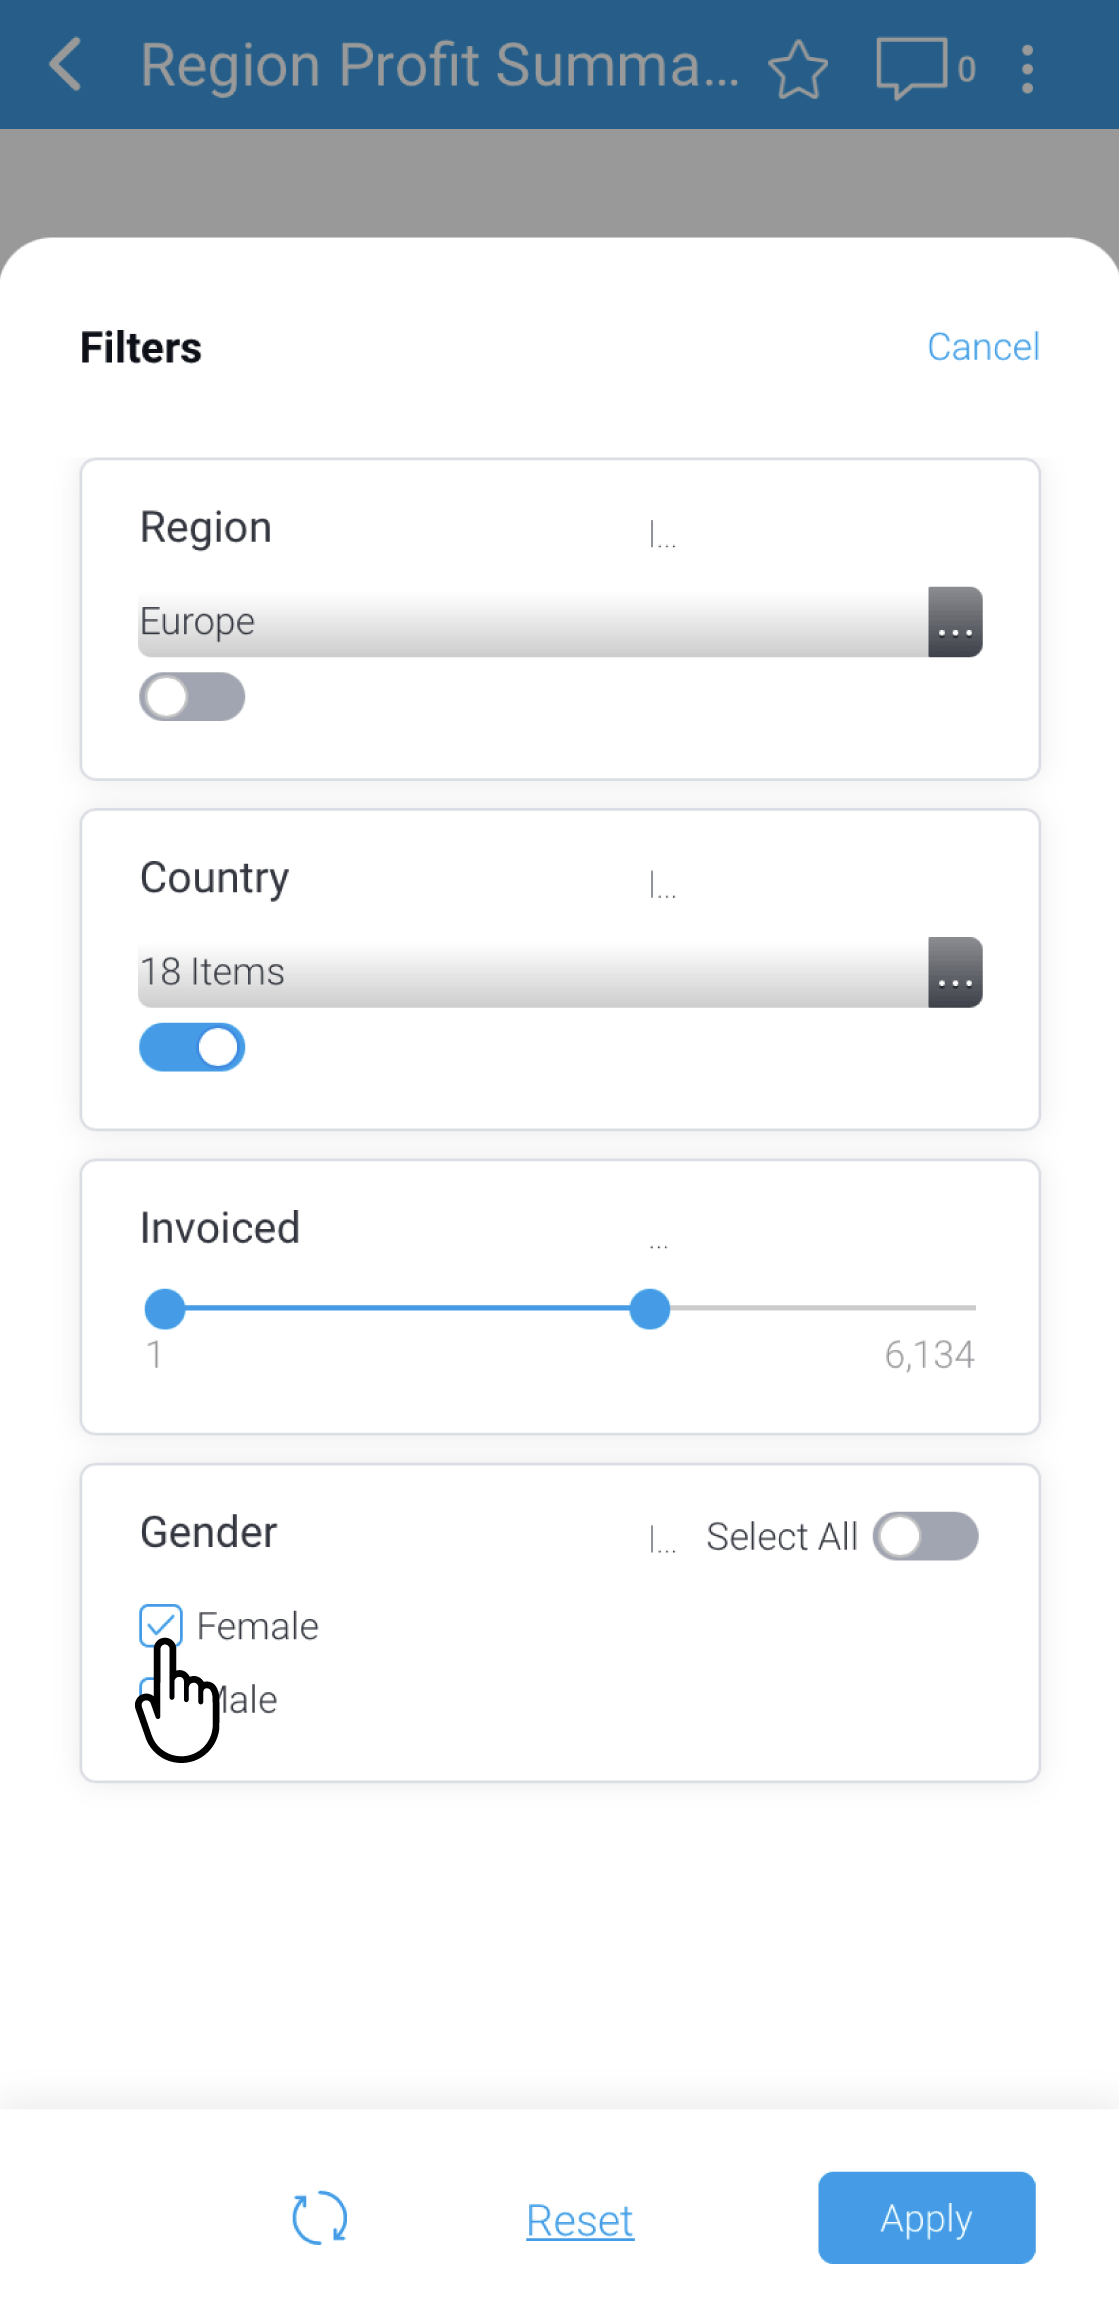
The value will be unchecked and ONLY will appear next to that value - Tap ONLY to select that value and remove all others within the Gender filter
The other value is removed from the filter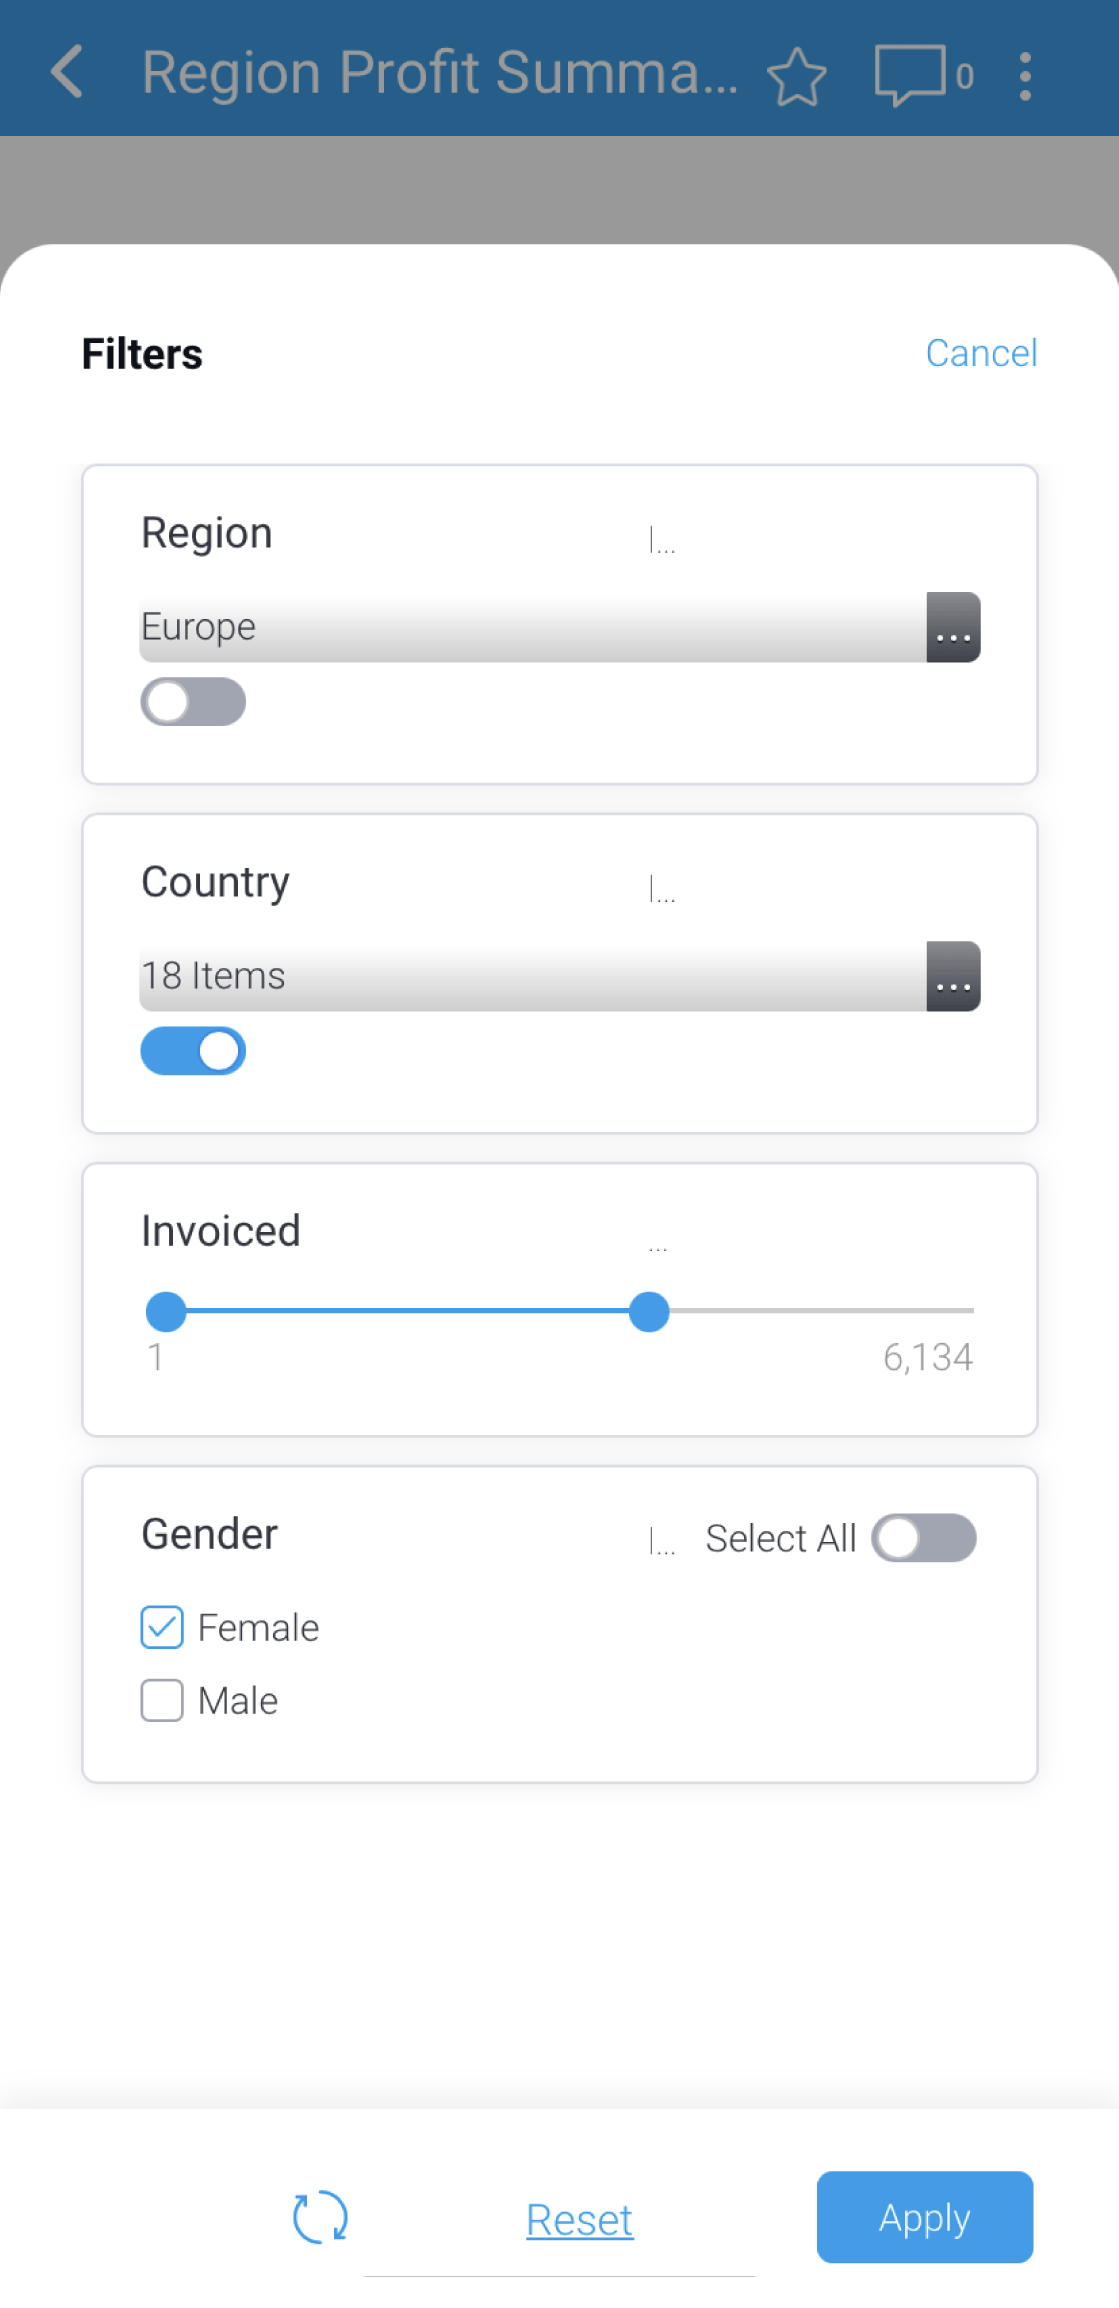
- Tap the Apply button to apply your selected filters to the report
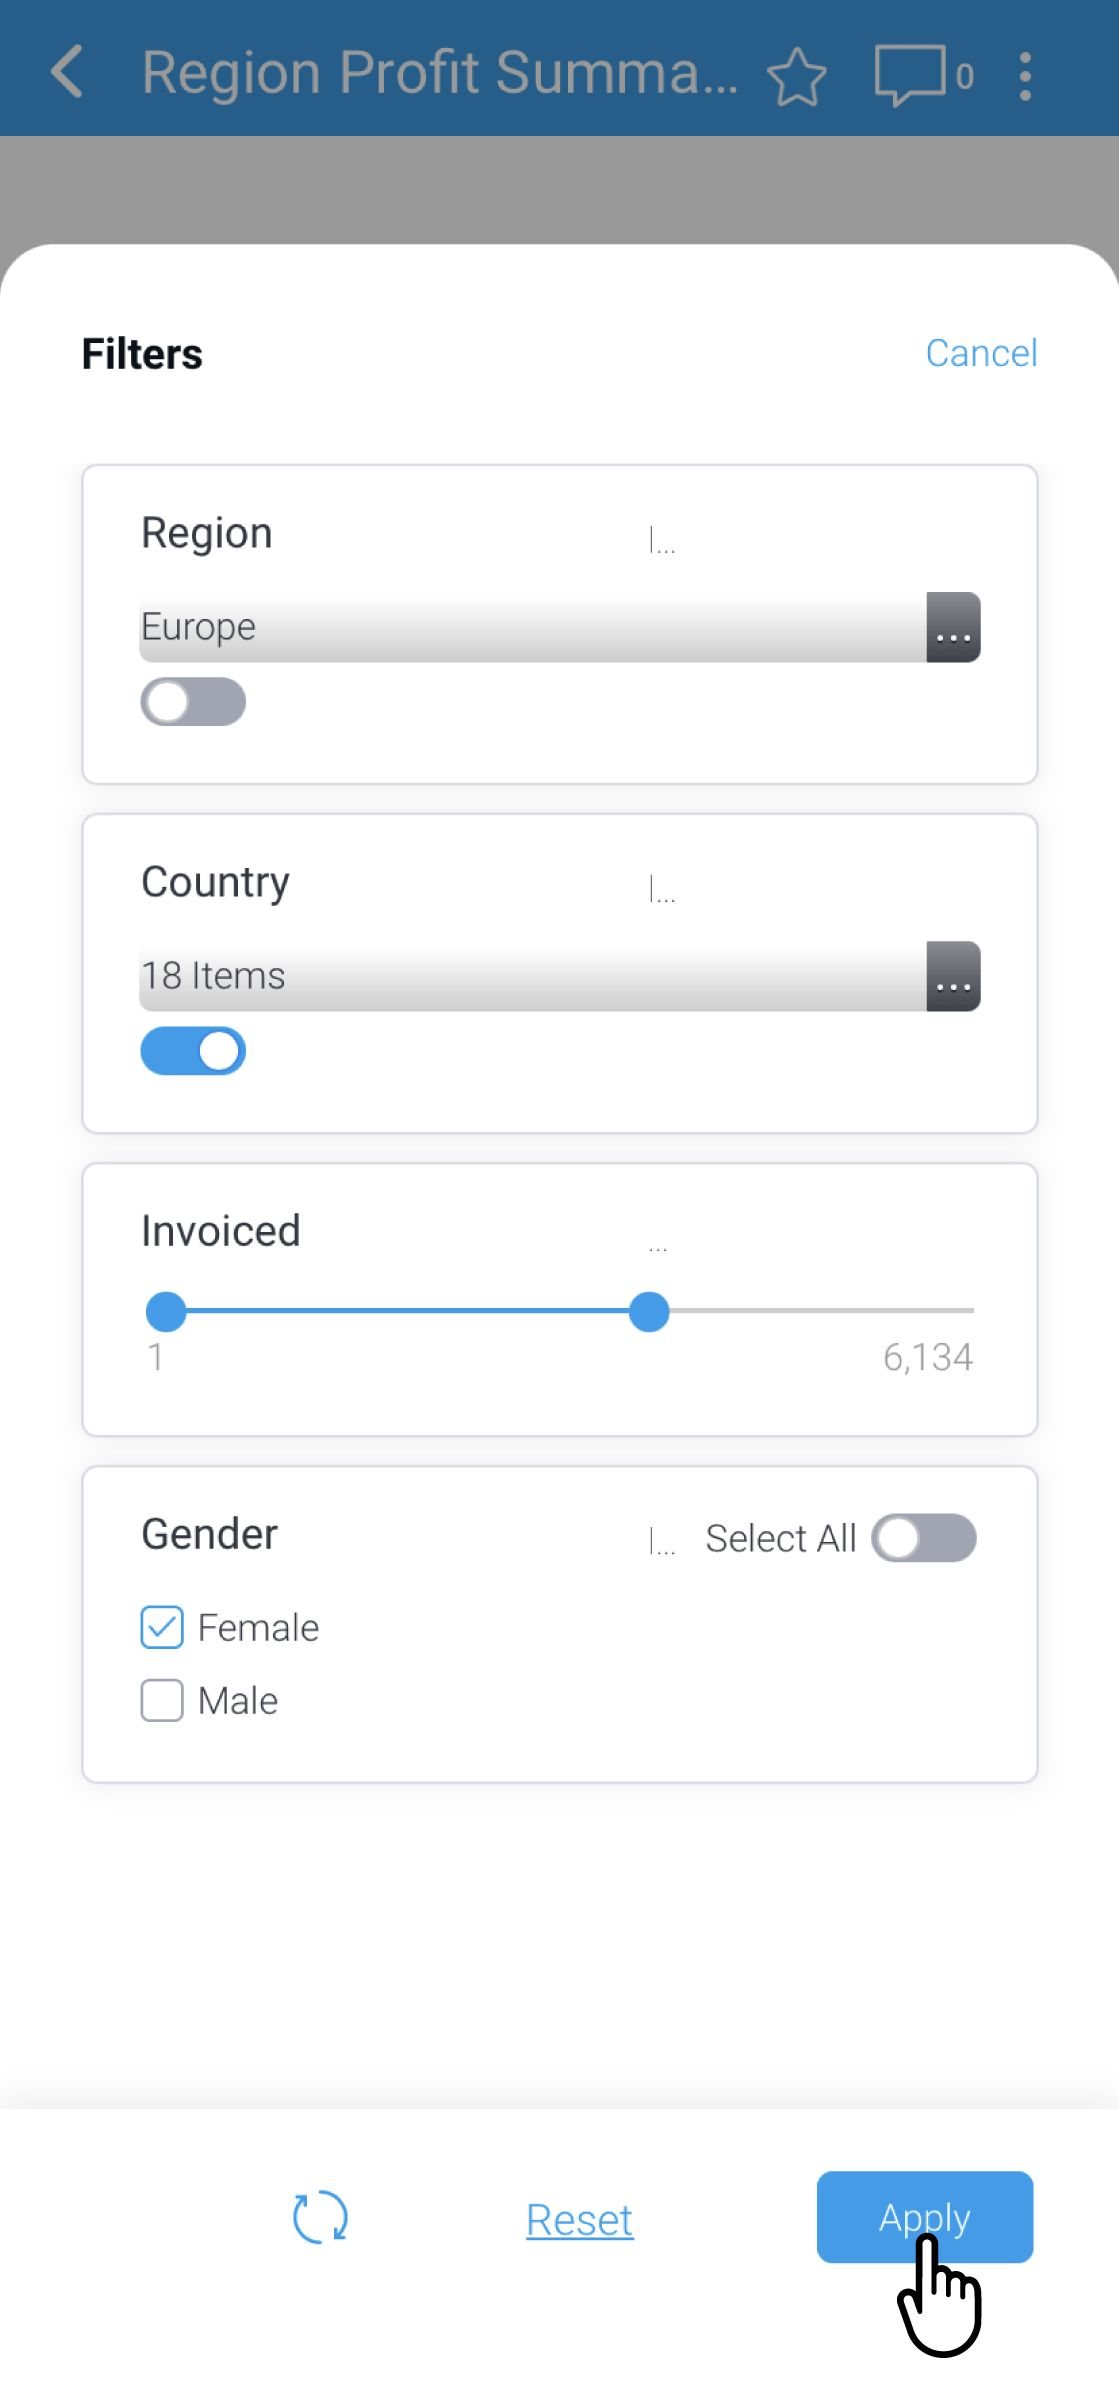
The data in the report changes to reflect your selected filter values, and the Filters button will display the number of filters are selected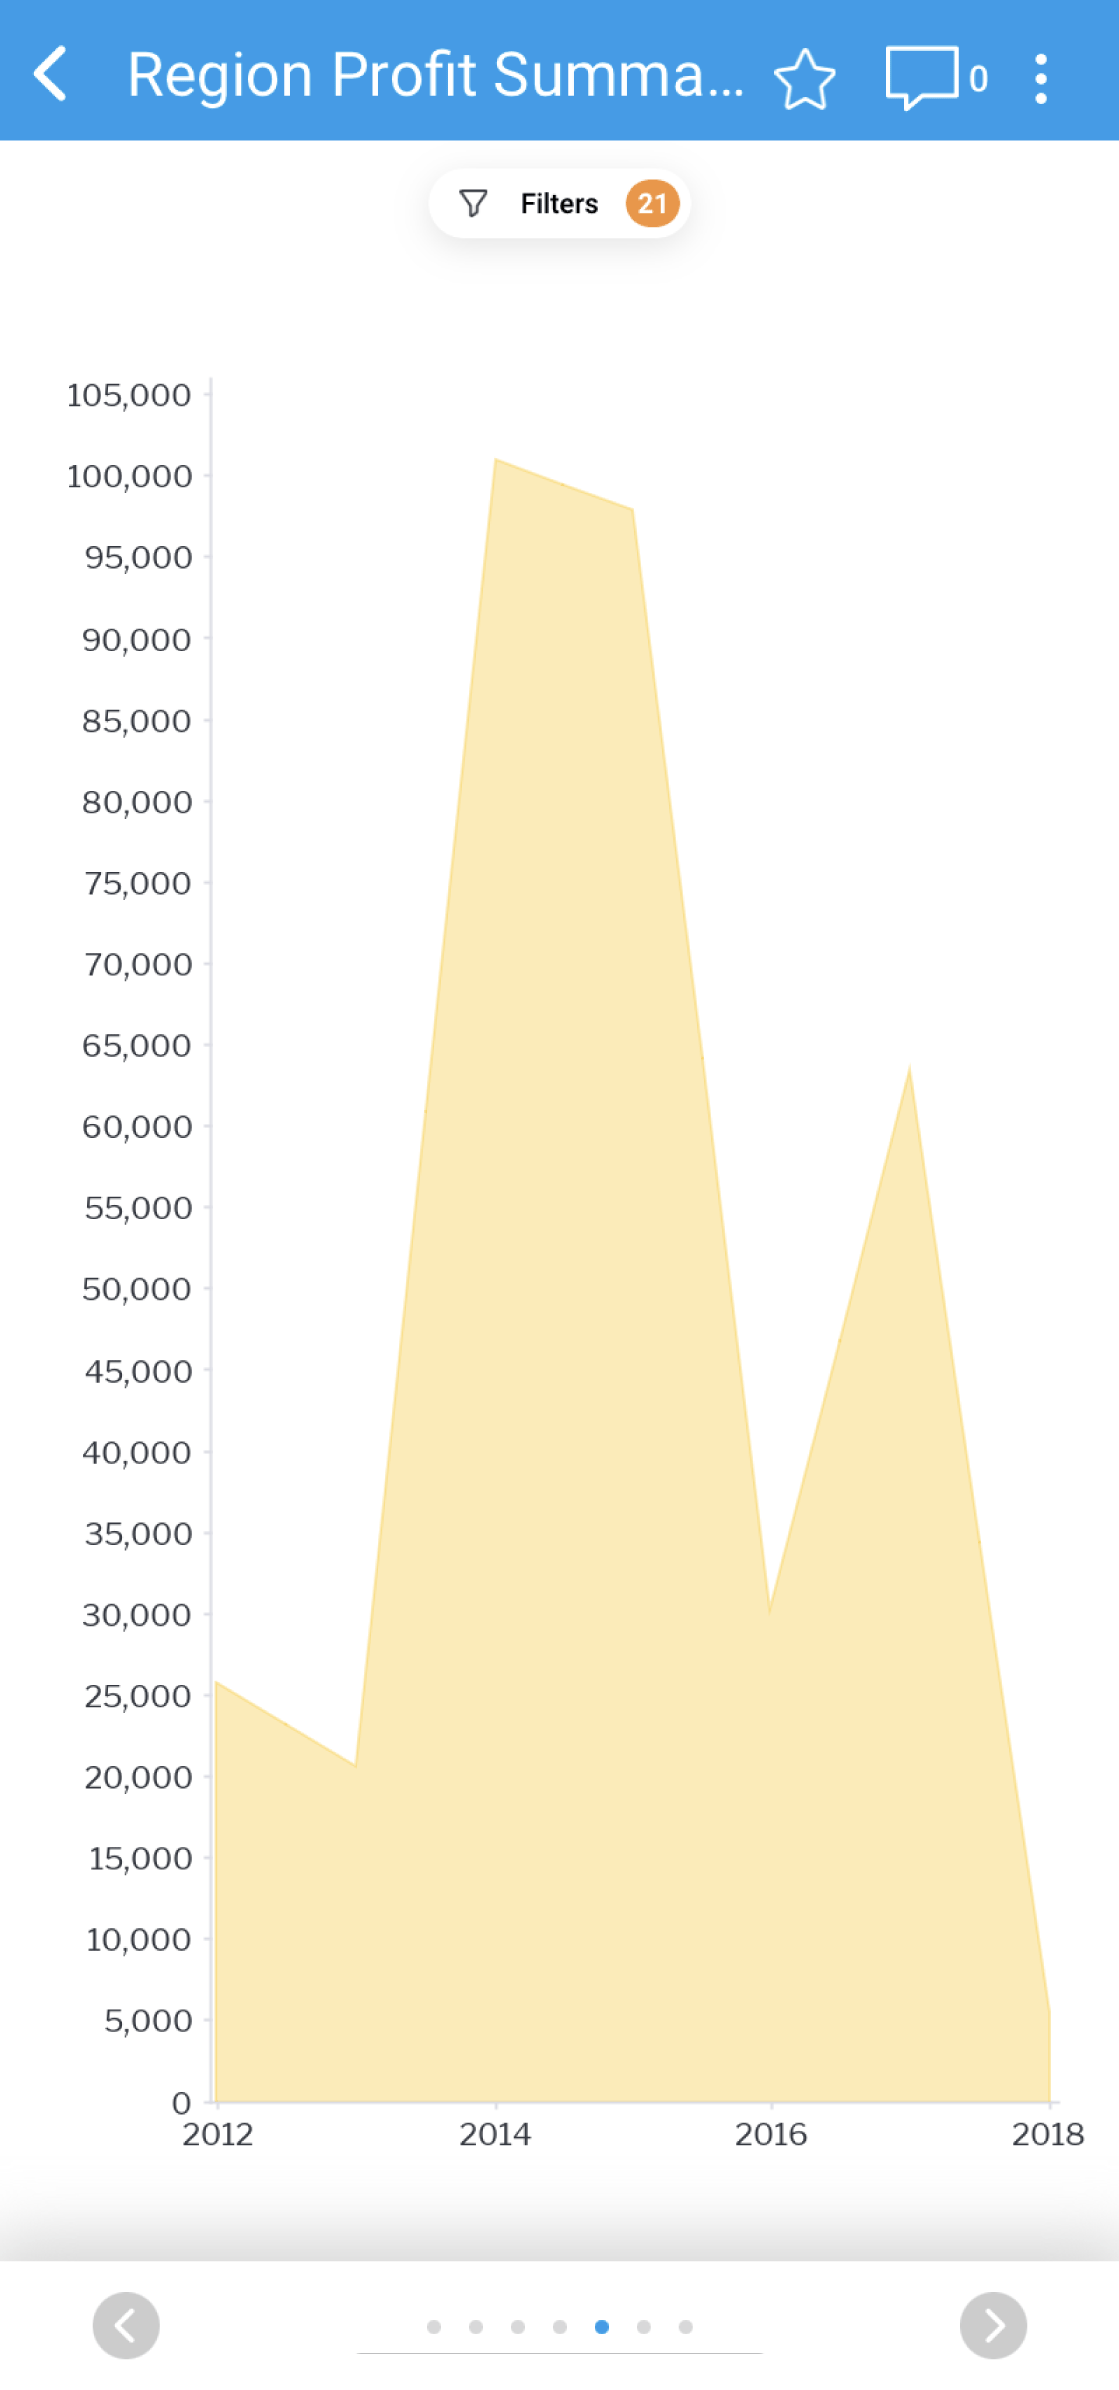
- To refine or change filters, tap the Filter button
The filters panel will be displayed - In this situation, you would like to reset the report — tap Reset to restore the default filters for the report
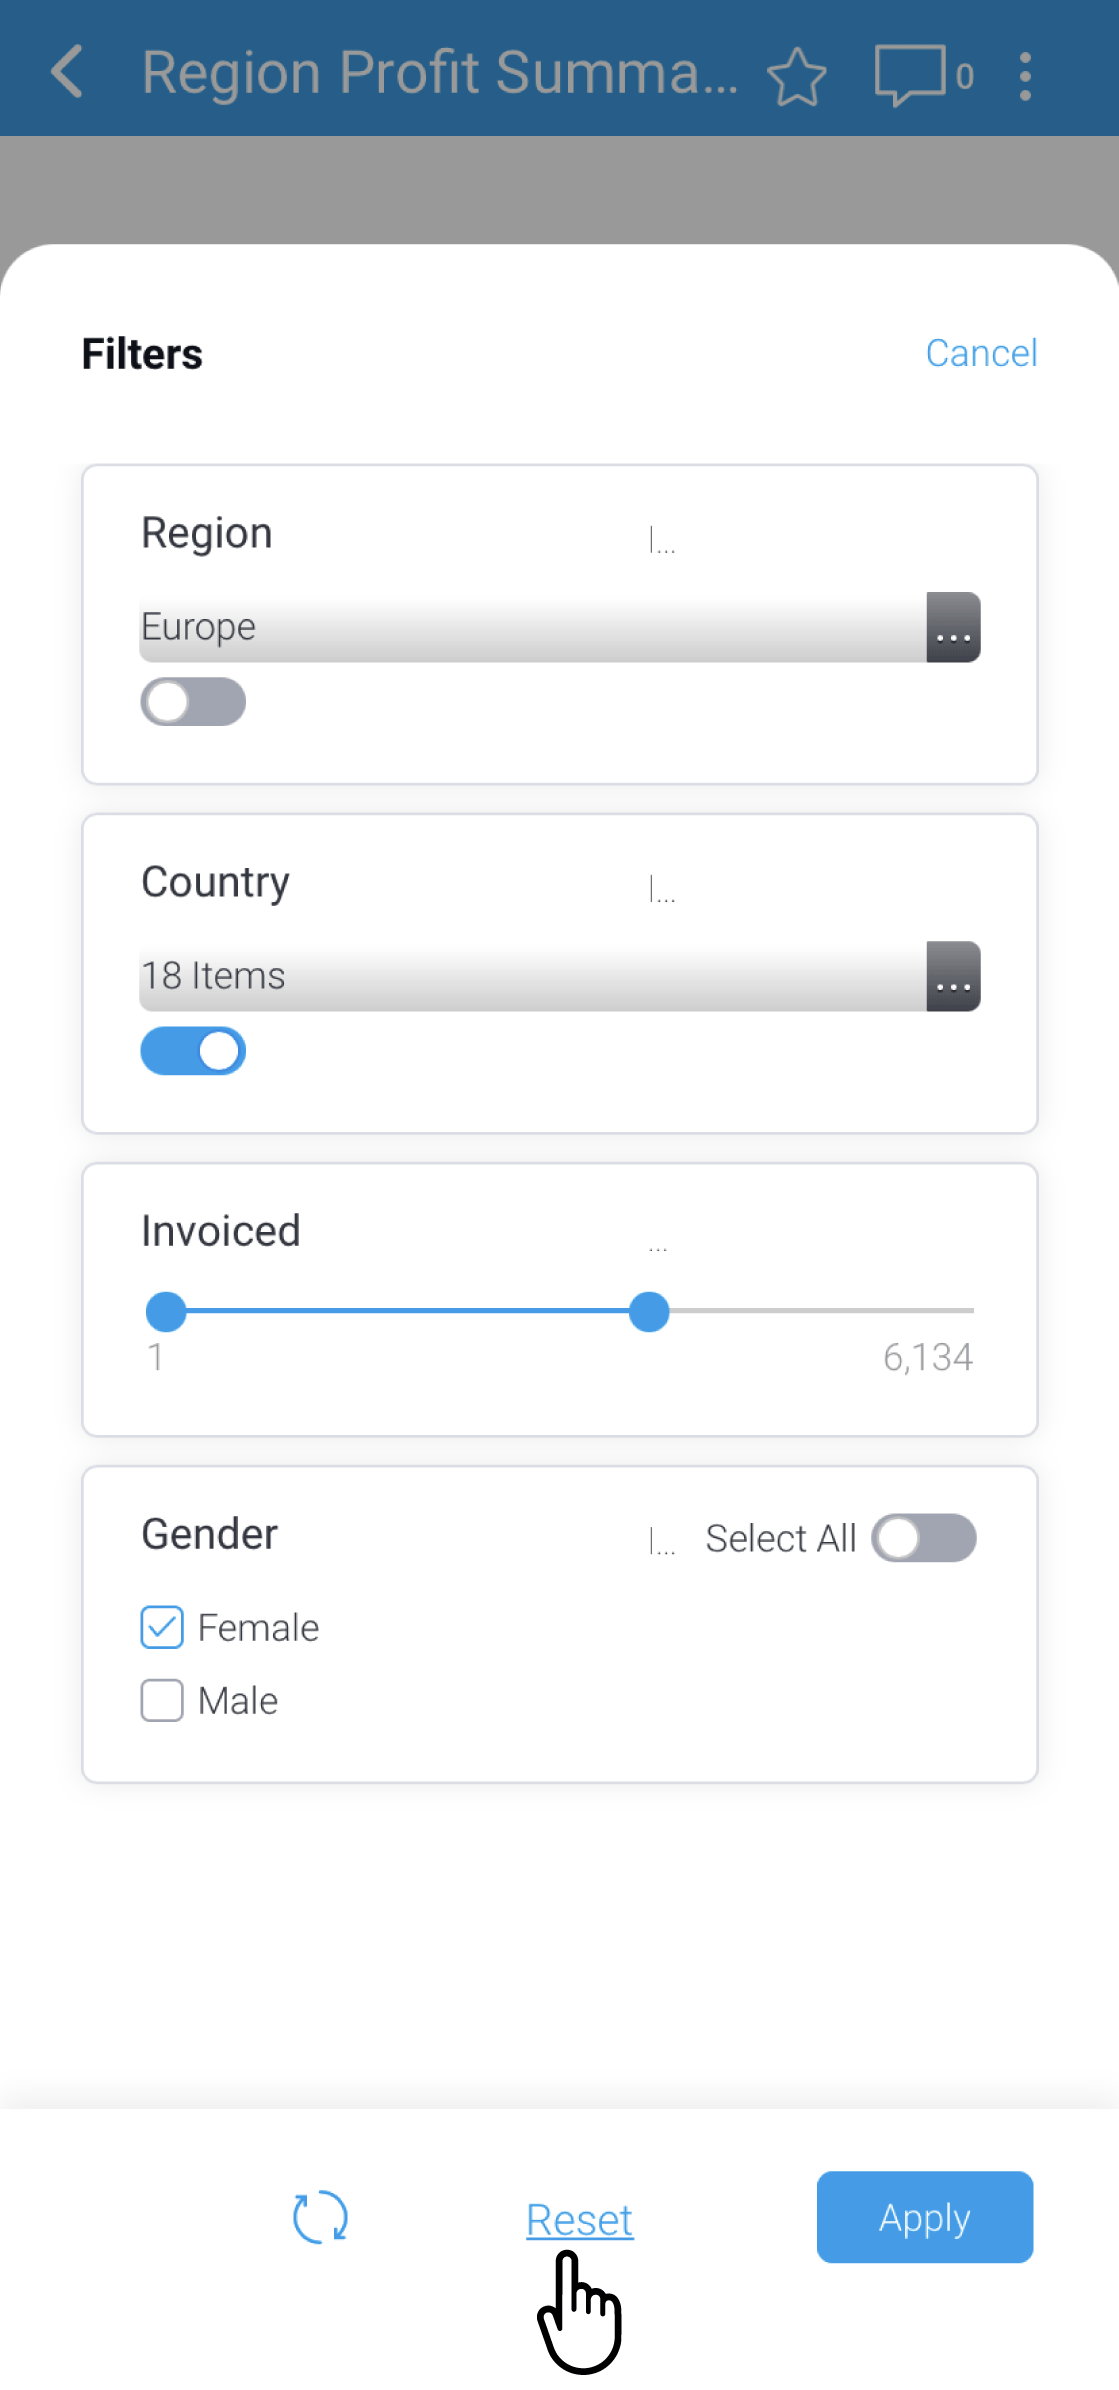
The report page will be displayed automatically with the default filters applied
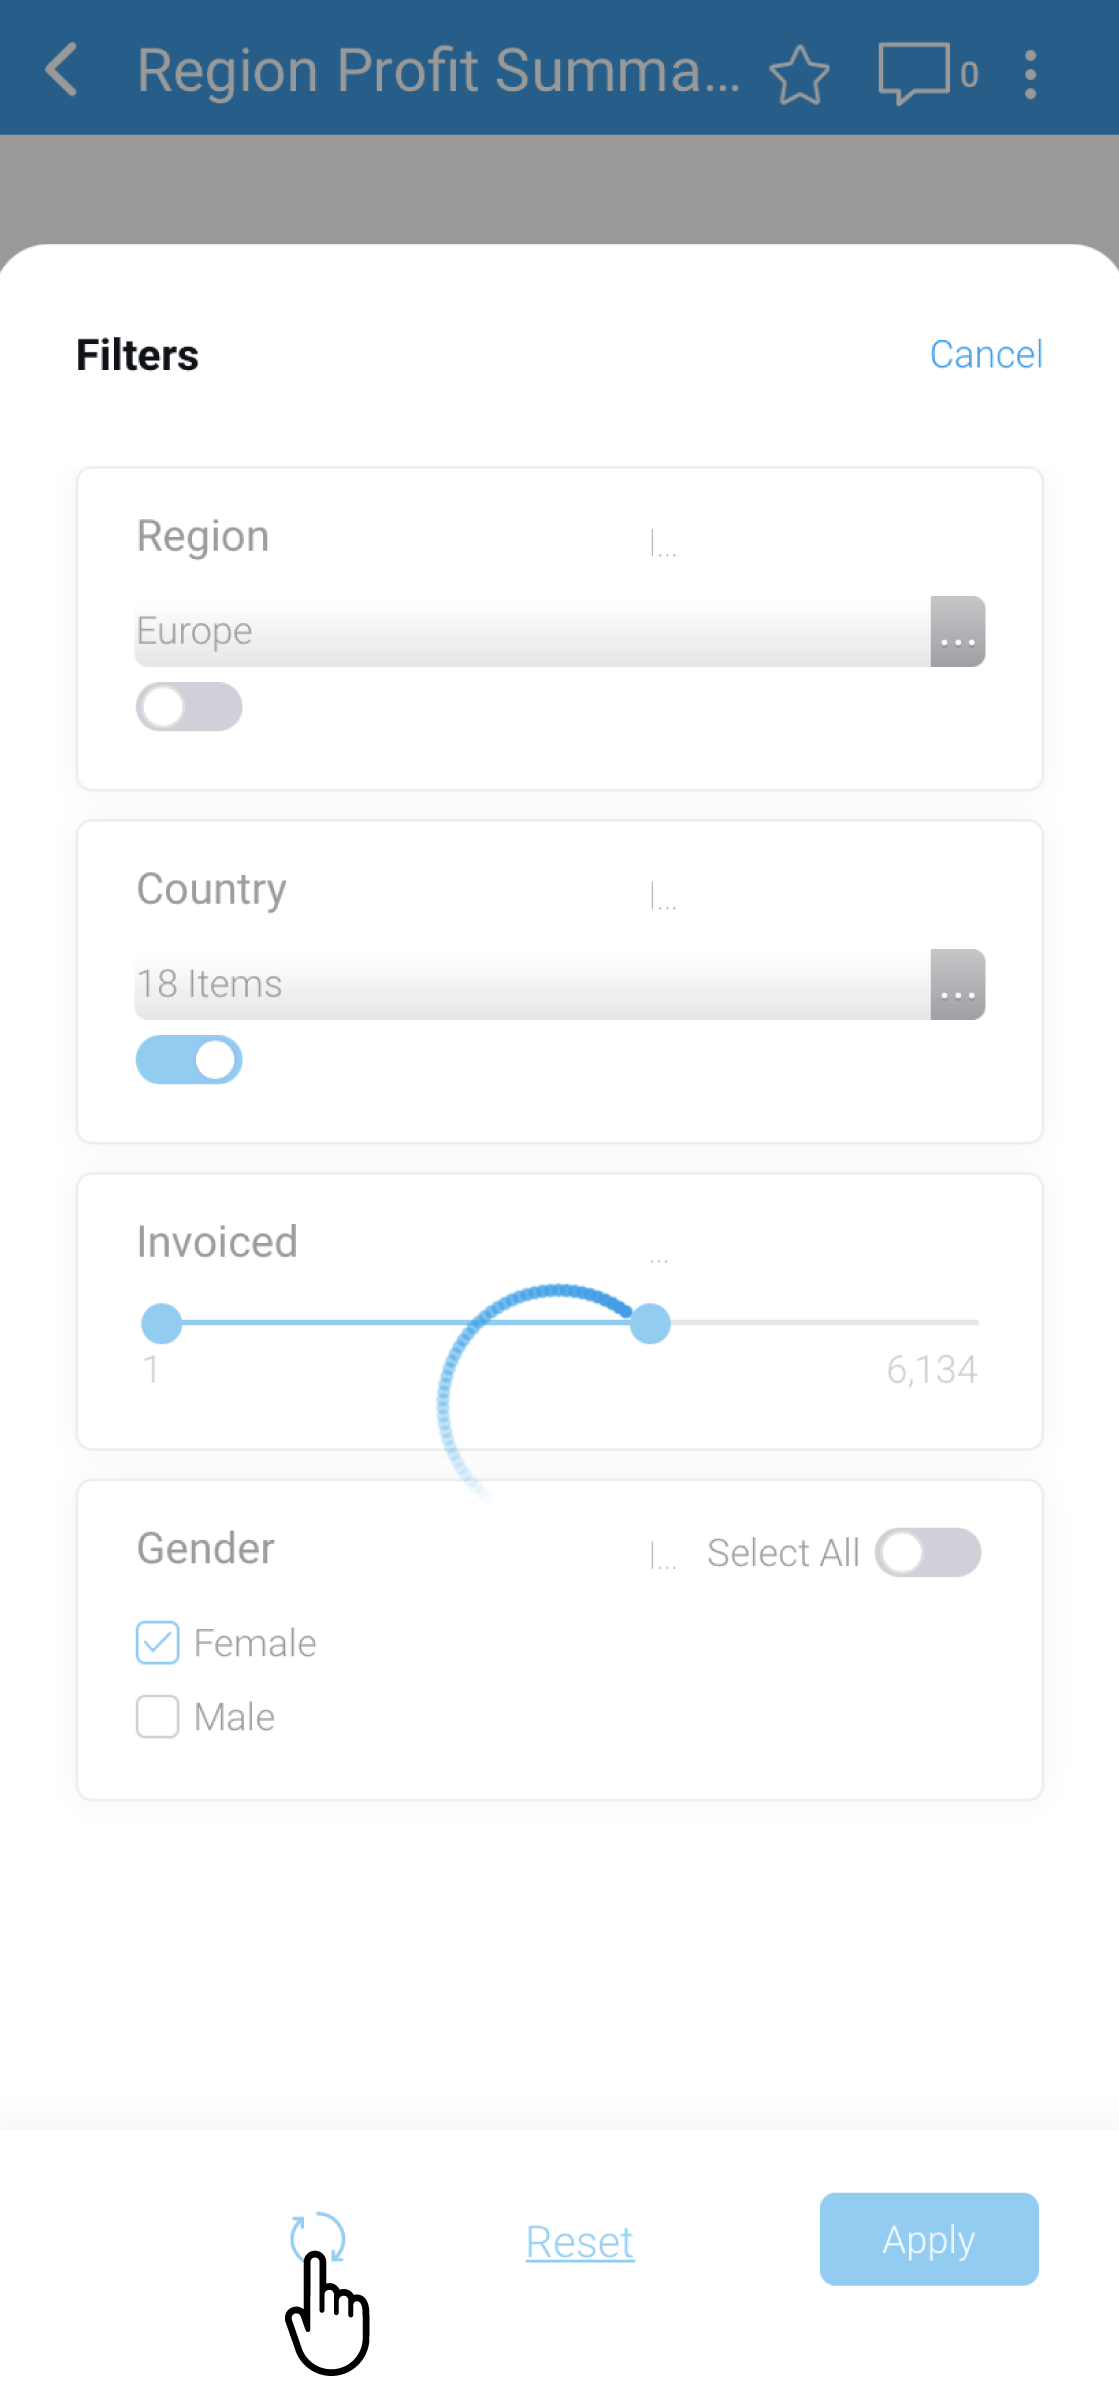
Refreshing cached filter values
Some reports contain cached filter values that can be refreshed manually. Refreshing the cache makes sure all filter values are available when displaying the report.
- Tap on the Filters button
Tap the refresh button at the bottom-left of the screen to refresh any cached filter values in the report
| Styleclass | ||
|---|---|---|
| ||
Anchor drillingreports drillingreports
Drilling down
| drillingreports | |
| drillingreports |
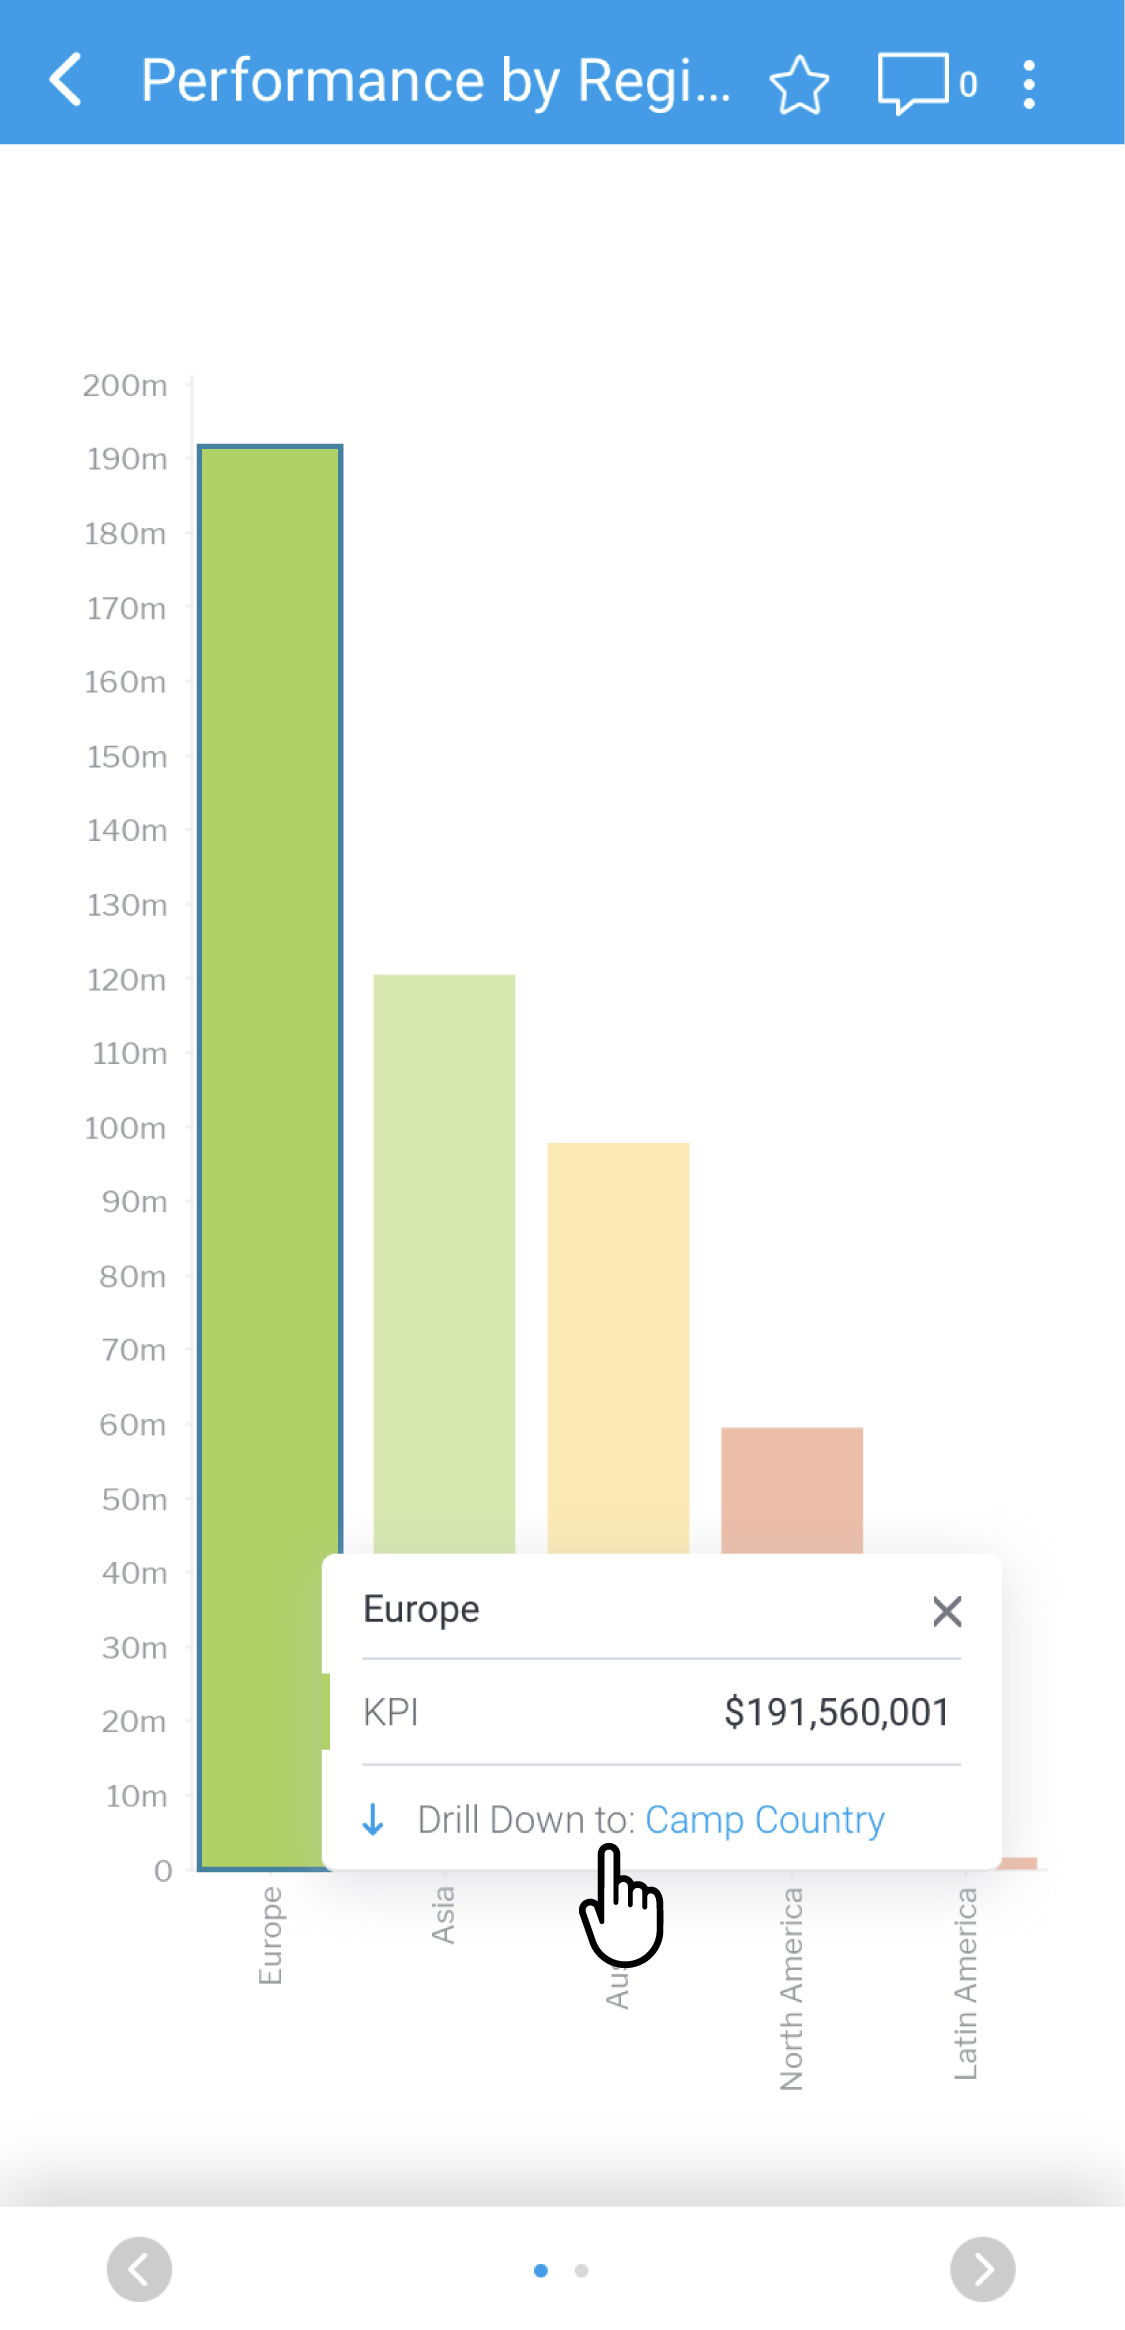
The Yellowfin mobile app supports Drill Down functionality where Drill Down has been configured for a report. Drill Down provides you with the option to access logical hierarchies within your data, allowing you to view the data from different angles and levels.
To Drill Down in a report:
- Open a report by tapping on a report tile
You can access reports from the Reports page, or from your Timeline - Tap on a report element to display more detail about that element
A tooltip will be displayed showing the Drill Down options and value for the element - Tap Drill Down... to drill down the hierarchy
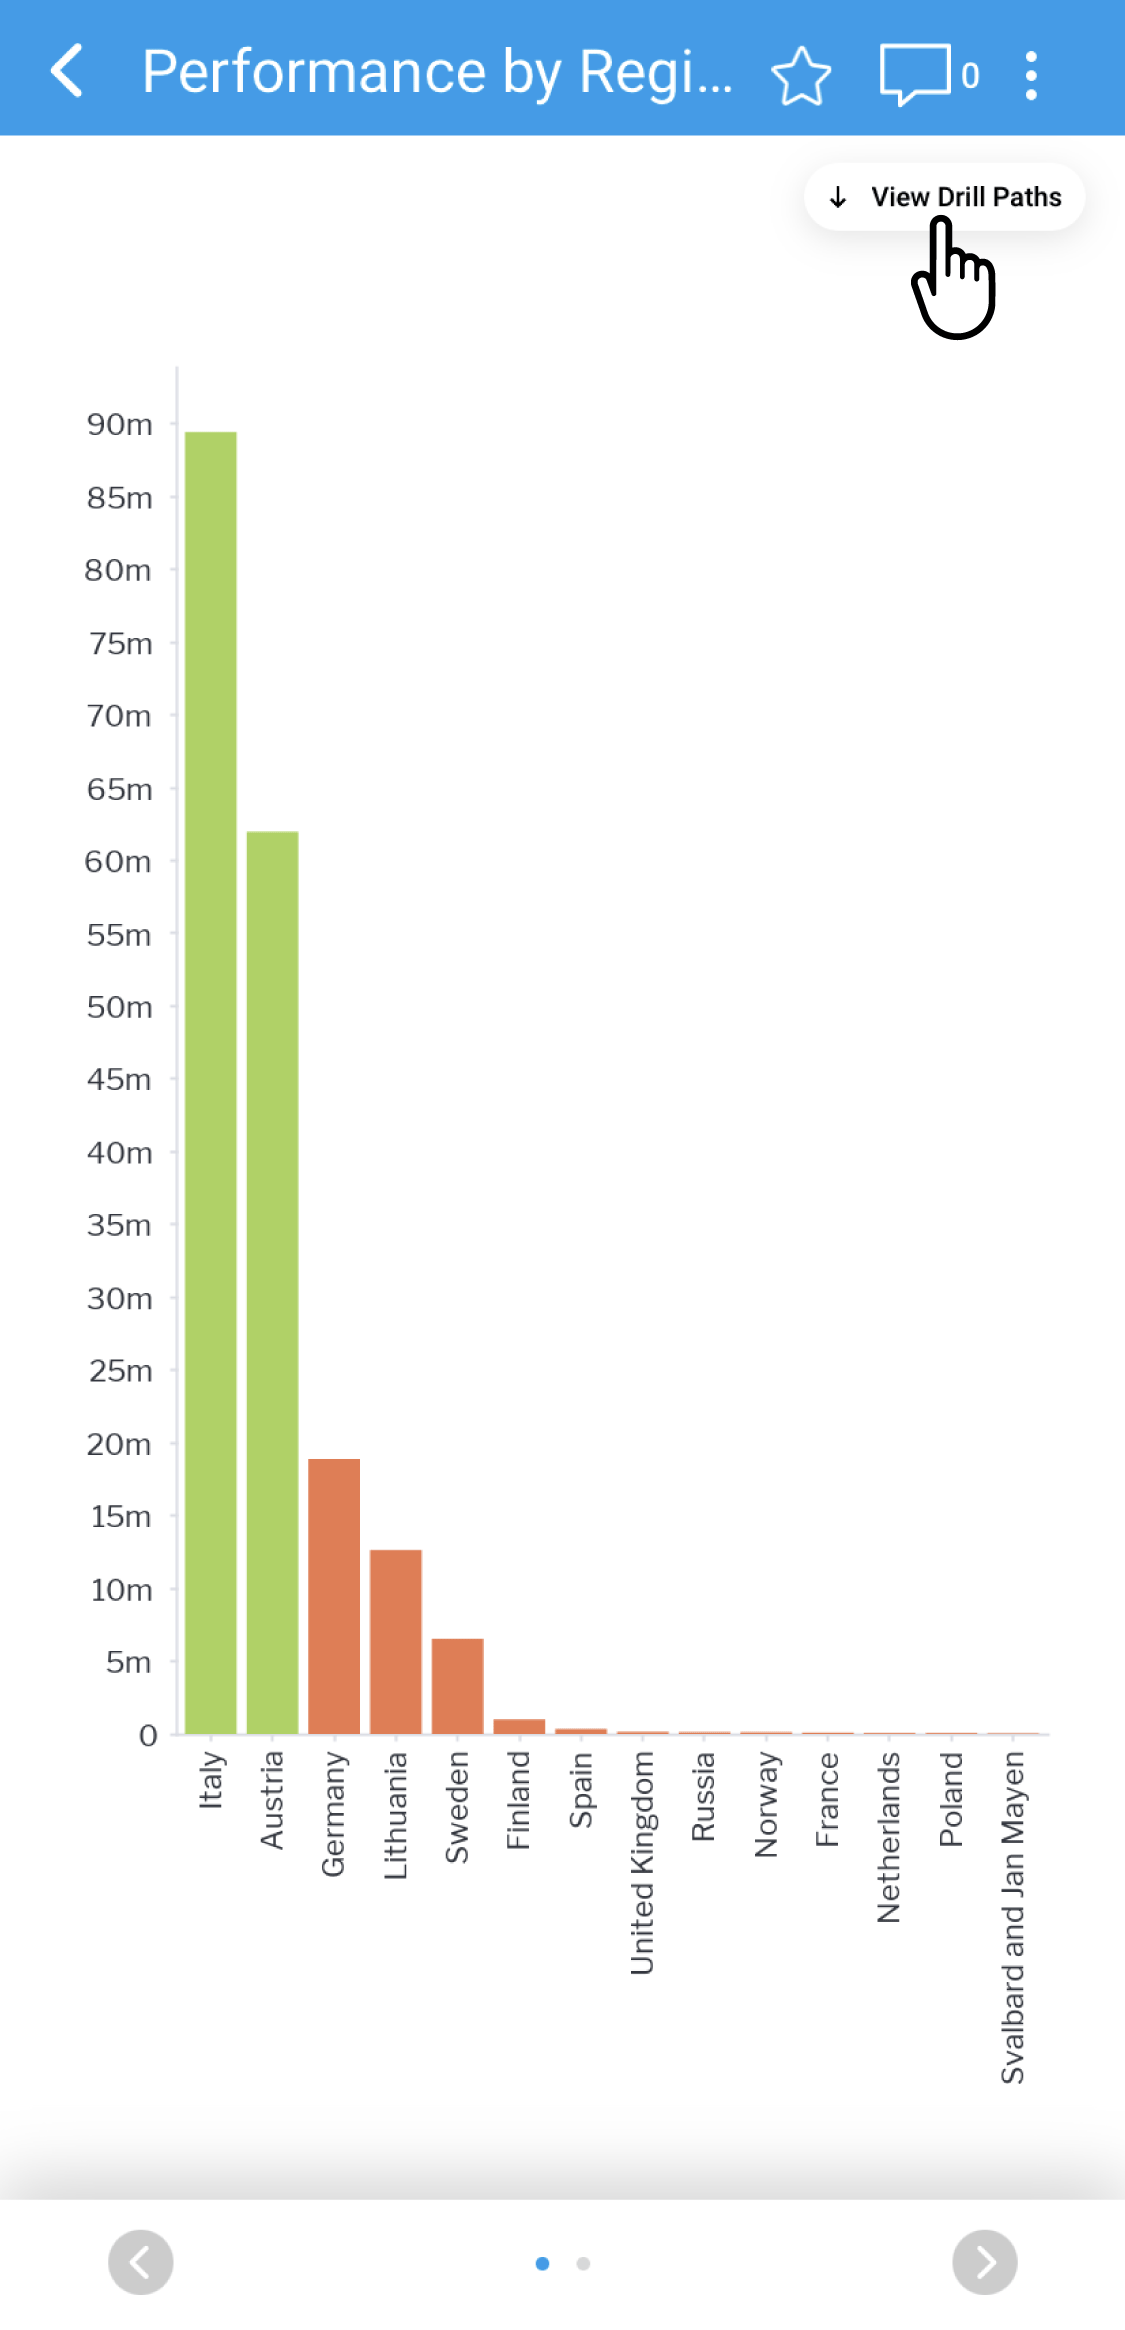
Once a report is drilled, a new button labelled View Drill Paths will appear
- Tap on the View Drill Paths button to view the Drill Down Settings menu
The Drill Down Settings pop-up will be displayed, showing the current drill path along with the option to reset the drill, remove individual drill elements, or cancel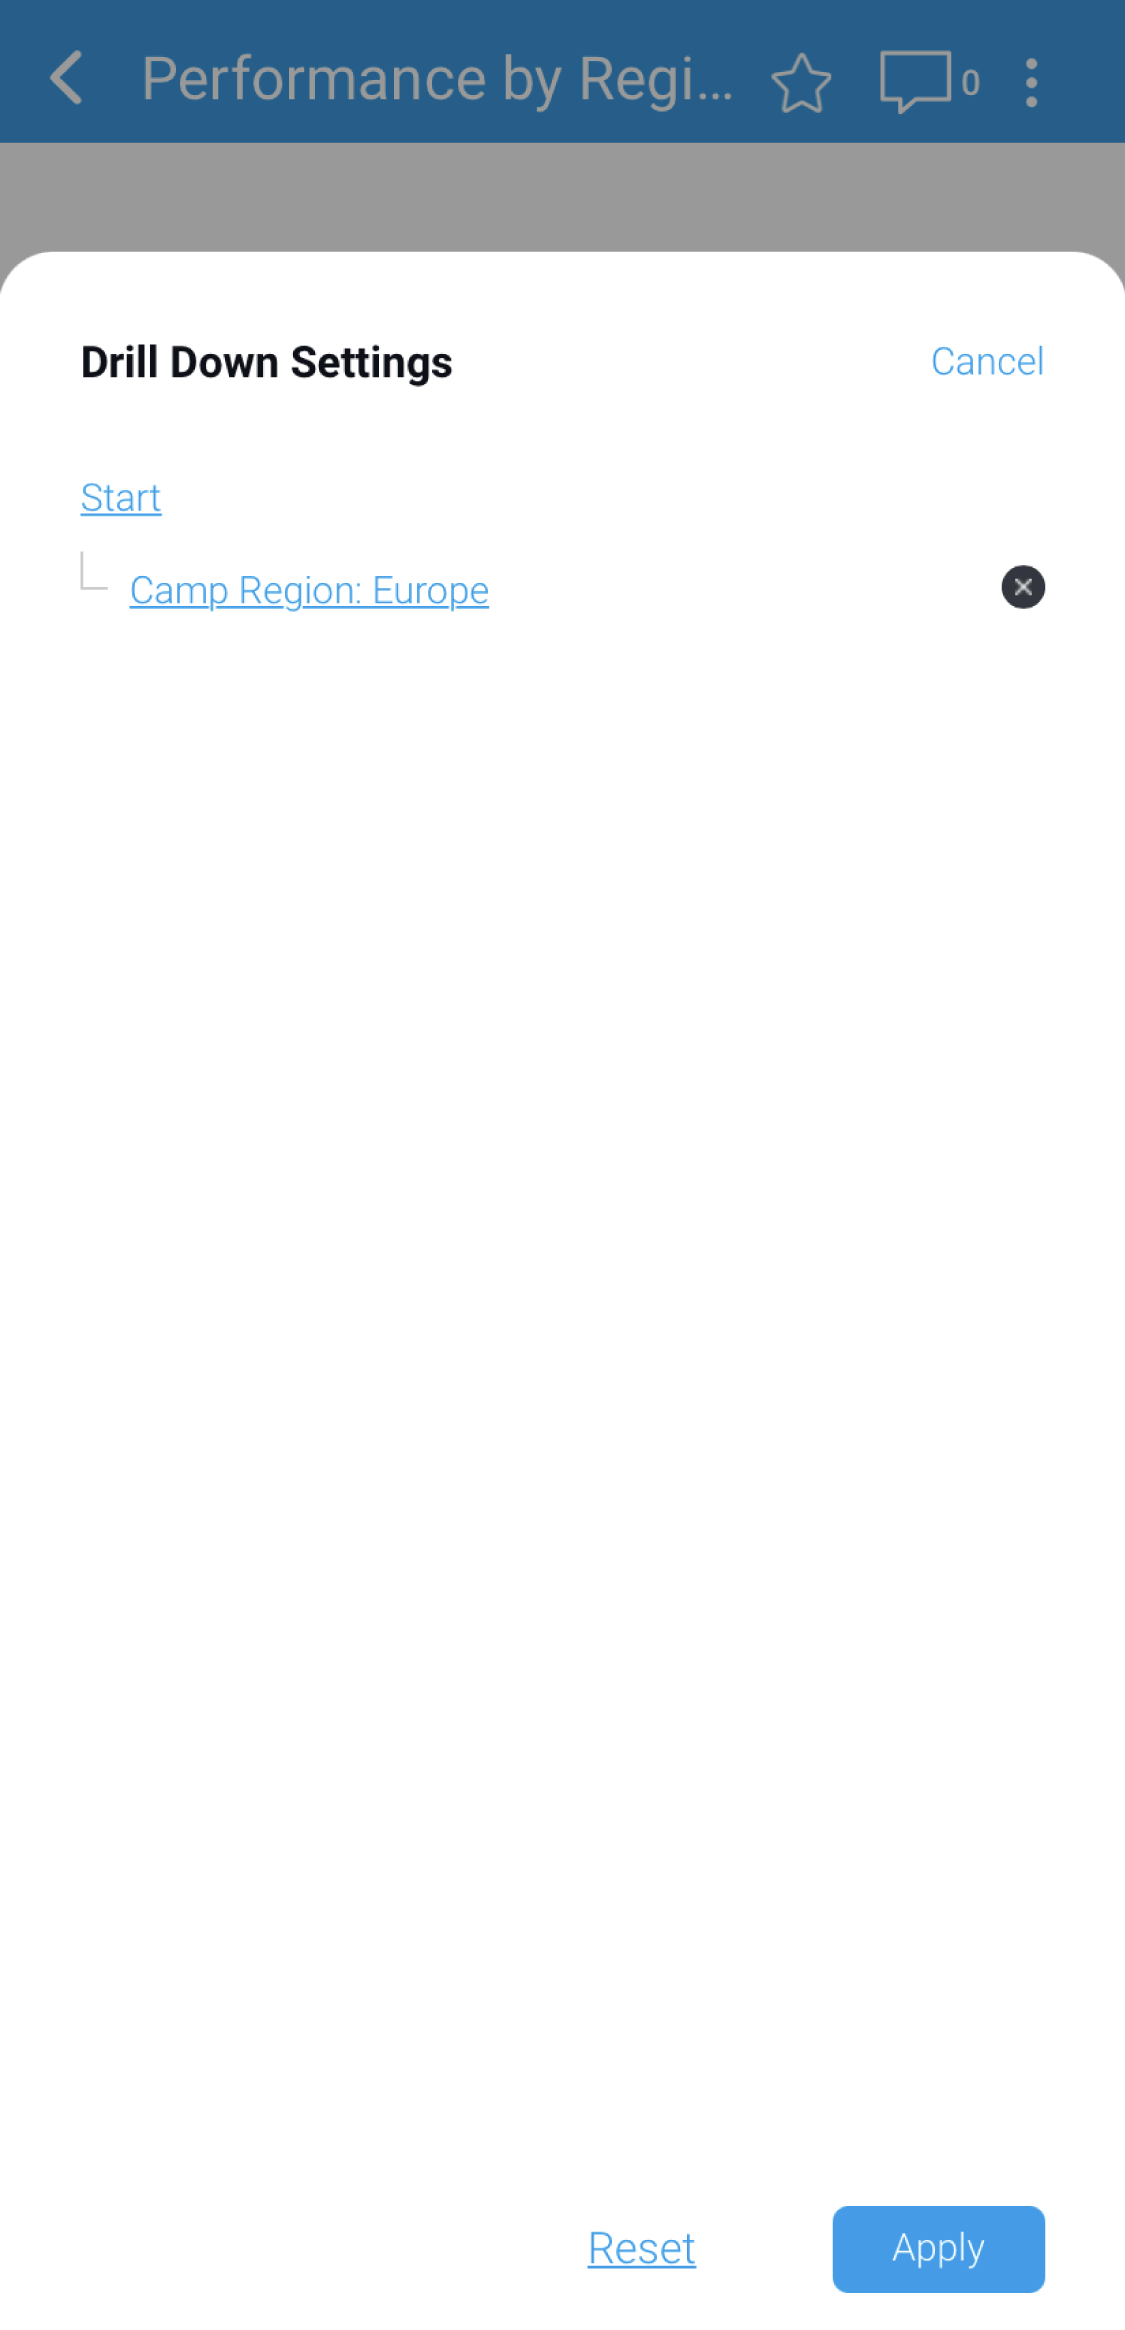
- Tap Cancel at any time to return to the report
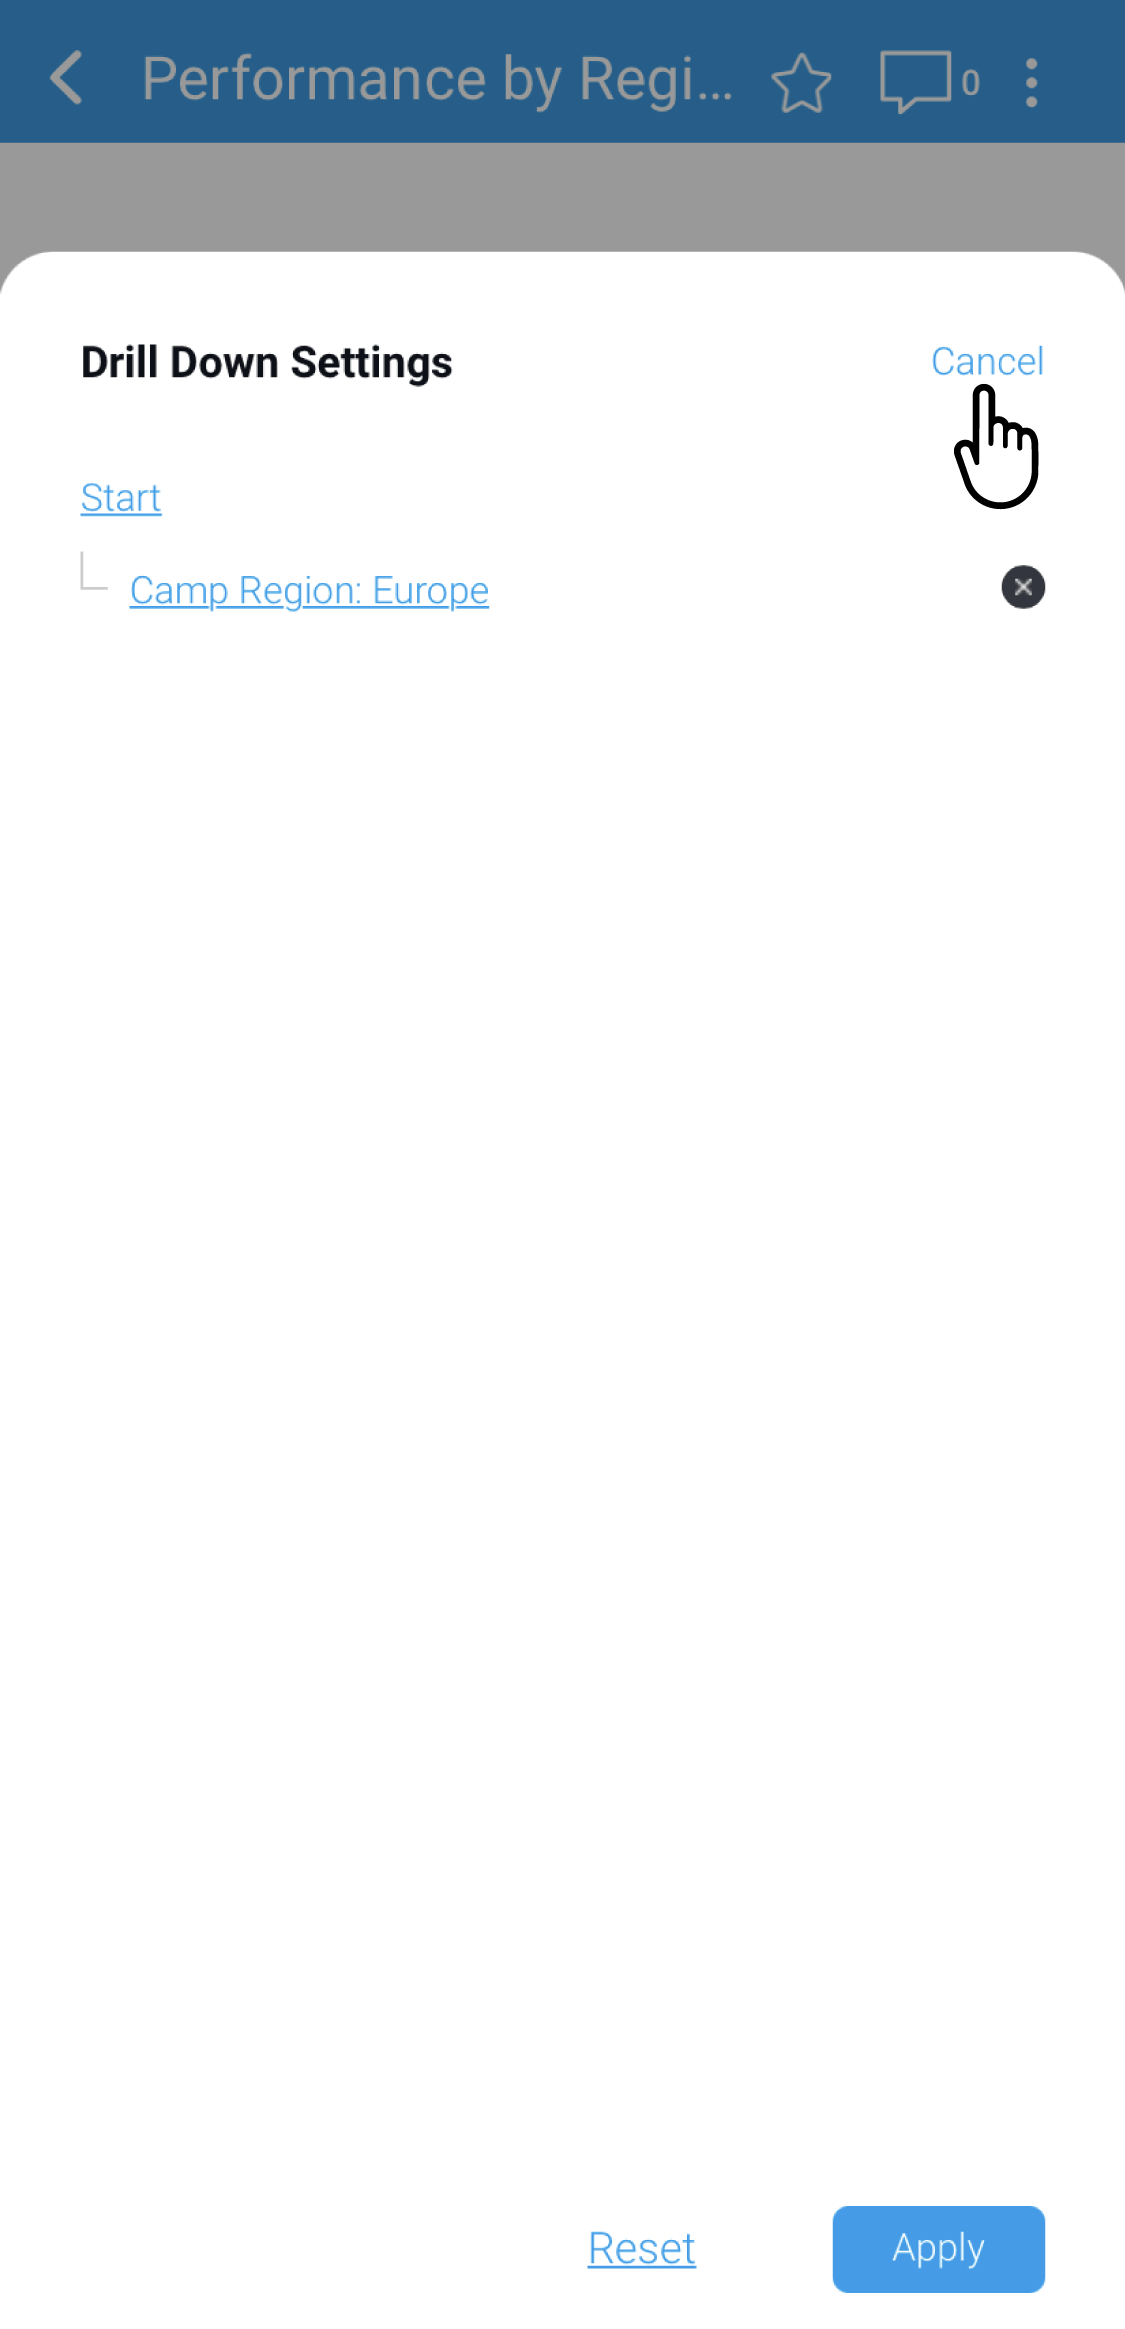
The report page will be displayed automatically with the previous drill setting applied - Tap another bar chart element to bring up the Drill Down tooltip

The Drill Down tooltip will be displayed, providing the option to Drill Down further in the hierarchy, Drill Up, or perform a Drill Reset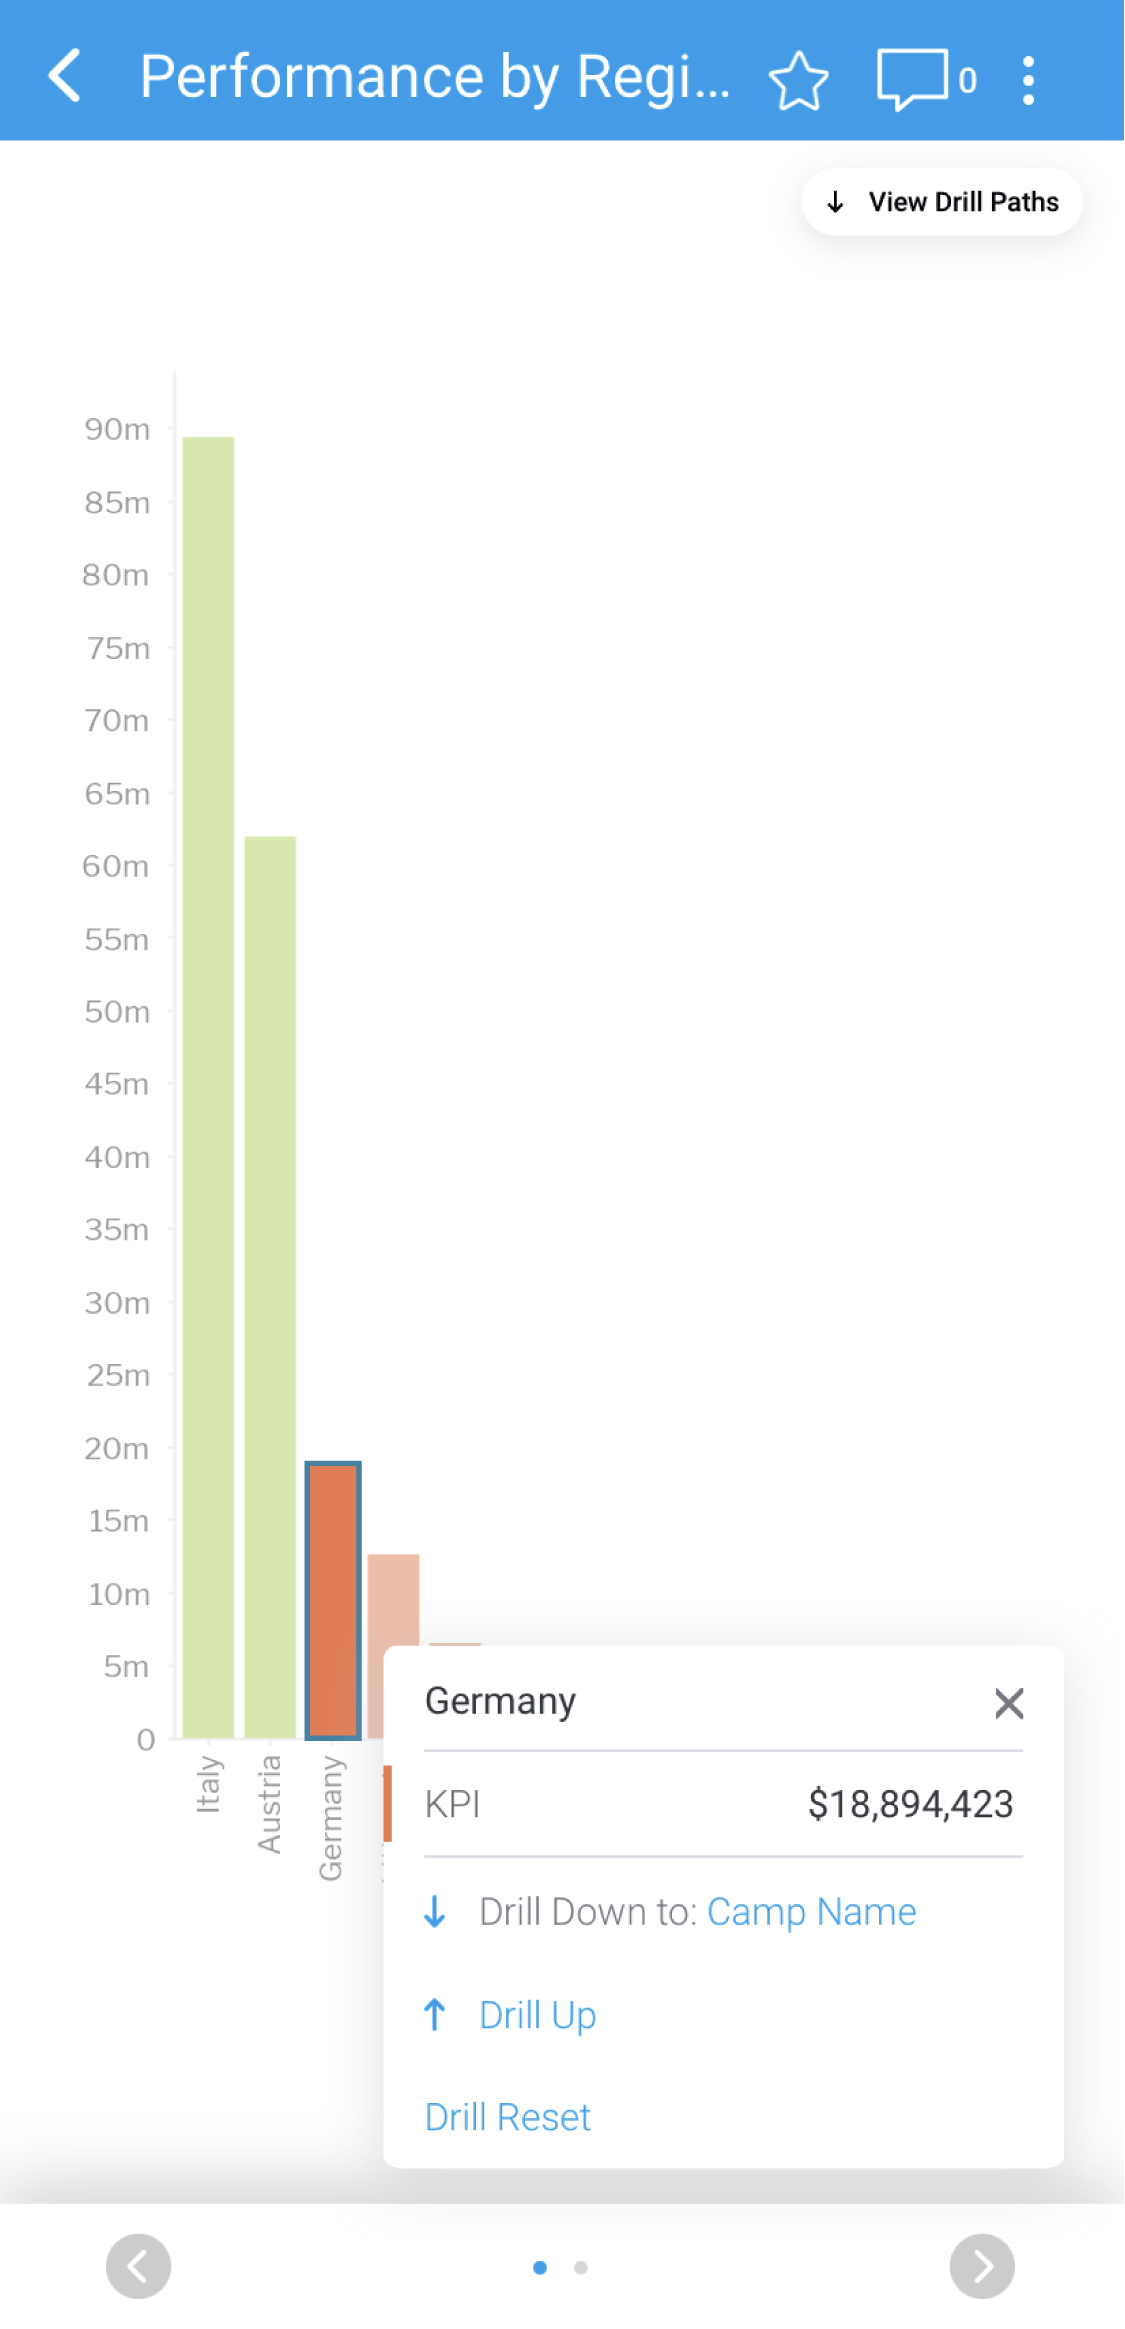
- Tap Drill Reset to remove any drill settings
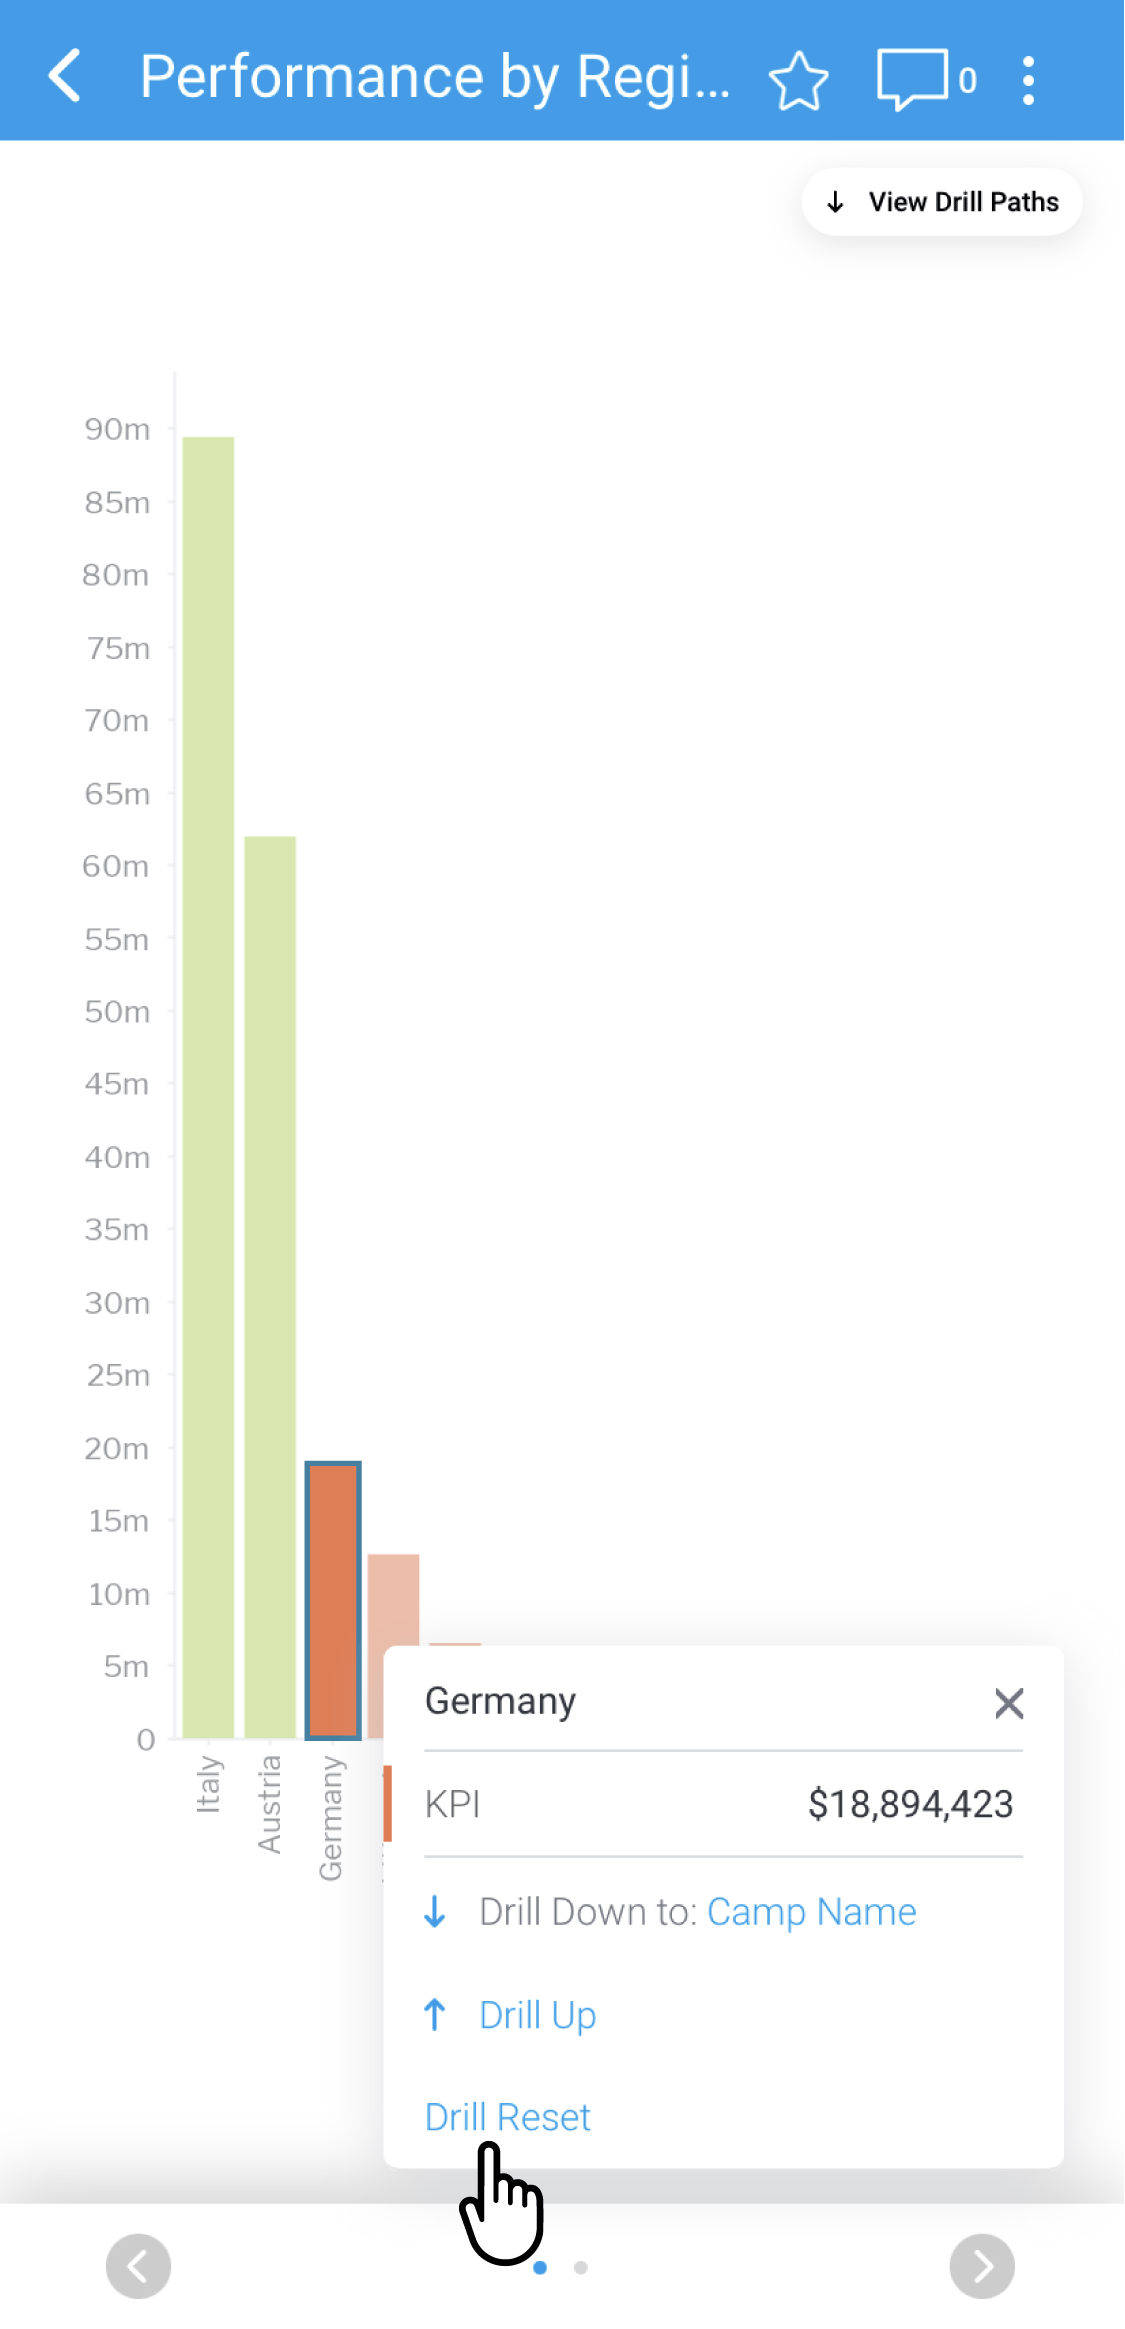
The report will be displayed automatically once the Reset button is tapped, with no drill settings applied
| Styleclass | ||
|---|---|---|
| ||