The procedure below allows you to enable JavaScript Charts on your chart canvas.
- Get to the Admin Console screen through Main menu > Administration > Admin Console
- Expand Roles and choose the user role you want to enable this feature for; you will be taken to the Role Details page
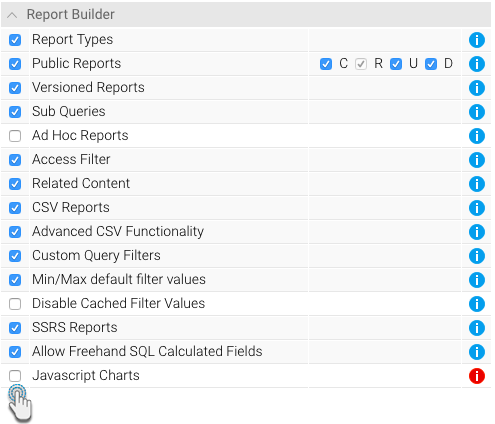
- On the roles permission panel, expand Report Builder
- Select the JavaScript Charts checkbox and click on save
- Then log out of the system and back in again to let this selection take effect
- Next navigate to Administration > Configuration
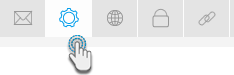
- Click on the Settings icon
- Select the Security option on there
Now enable the JavaScript Charts button
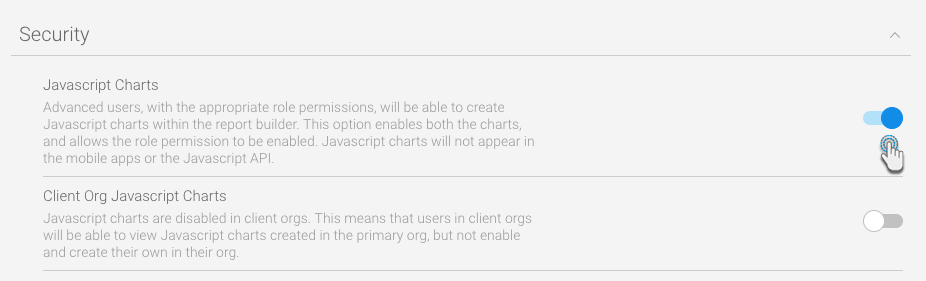
If you have a multi client organisation, you can use the Client Org JavaScript Charts button to switch this feature on for your clients.
- Click on the Save button
JavaScript Charting
Once you've completed the steps above, you should be able to create JavaScript Charts.
- Get to the Charts builder page
- A new button should appear on the right side icons menu
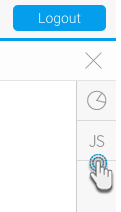
- Click on it to expand the panel, and then select the JS icon
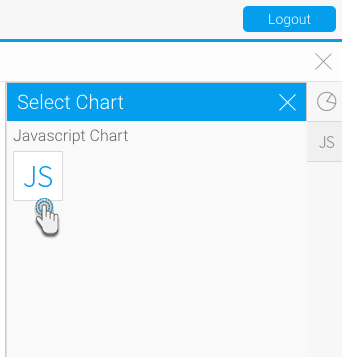
- The JavaScript chart builder page will appear, consisting of some helpful JavaScript templates to get you started with your charts
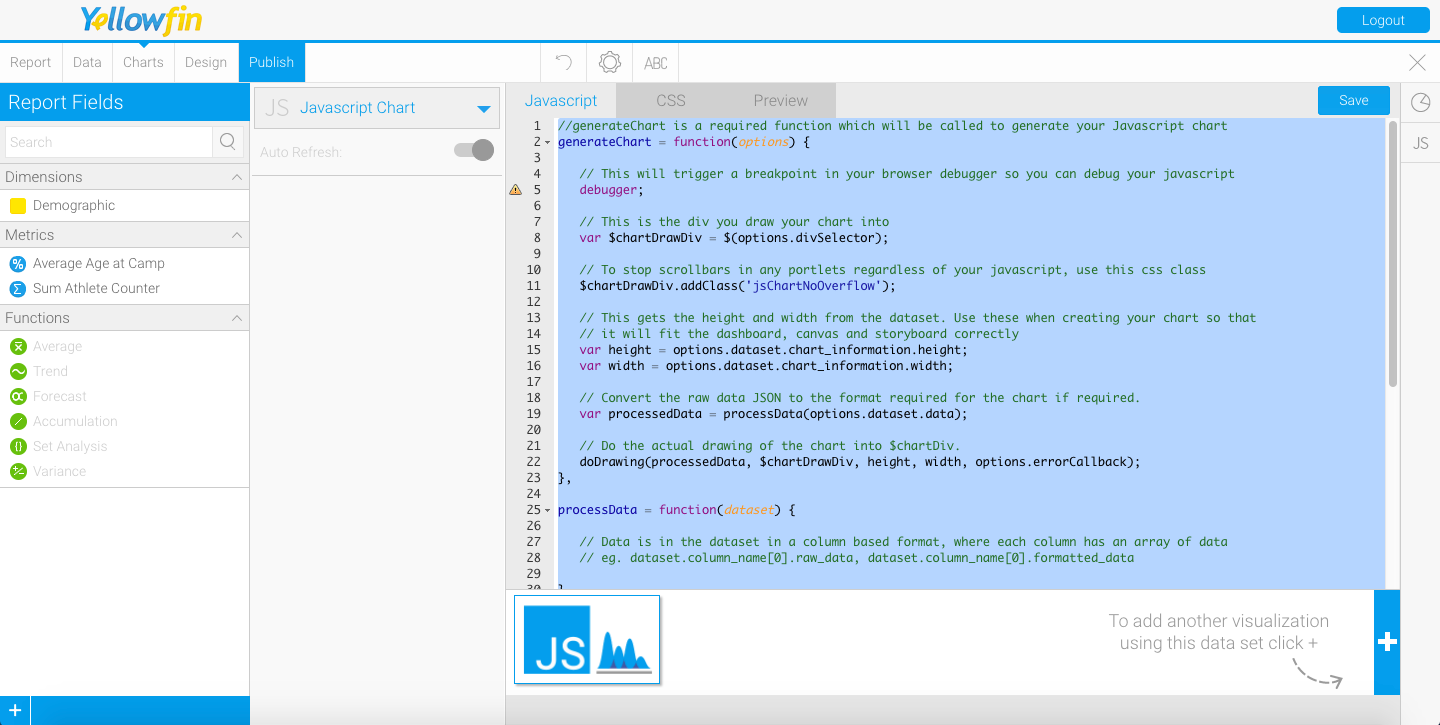
- To learn more about creating JS charts, click here.