Overview
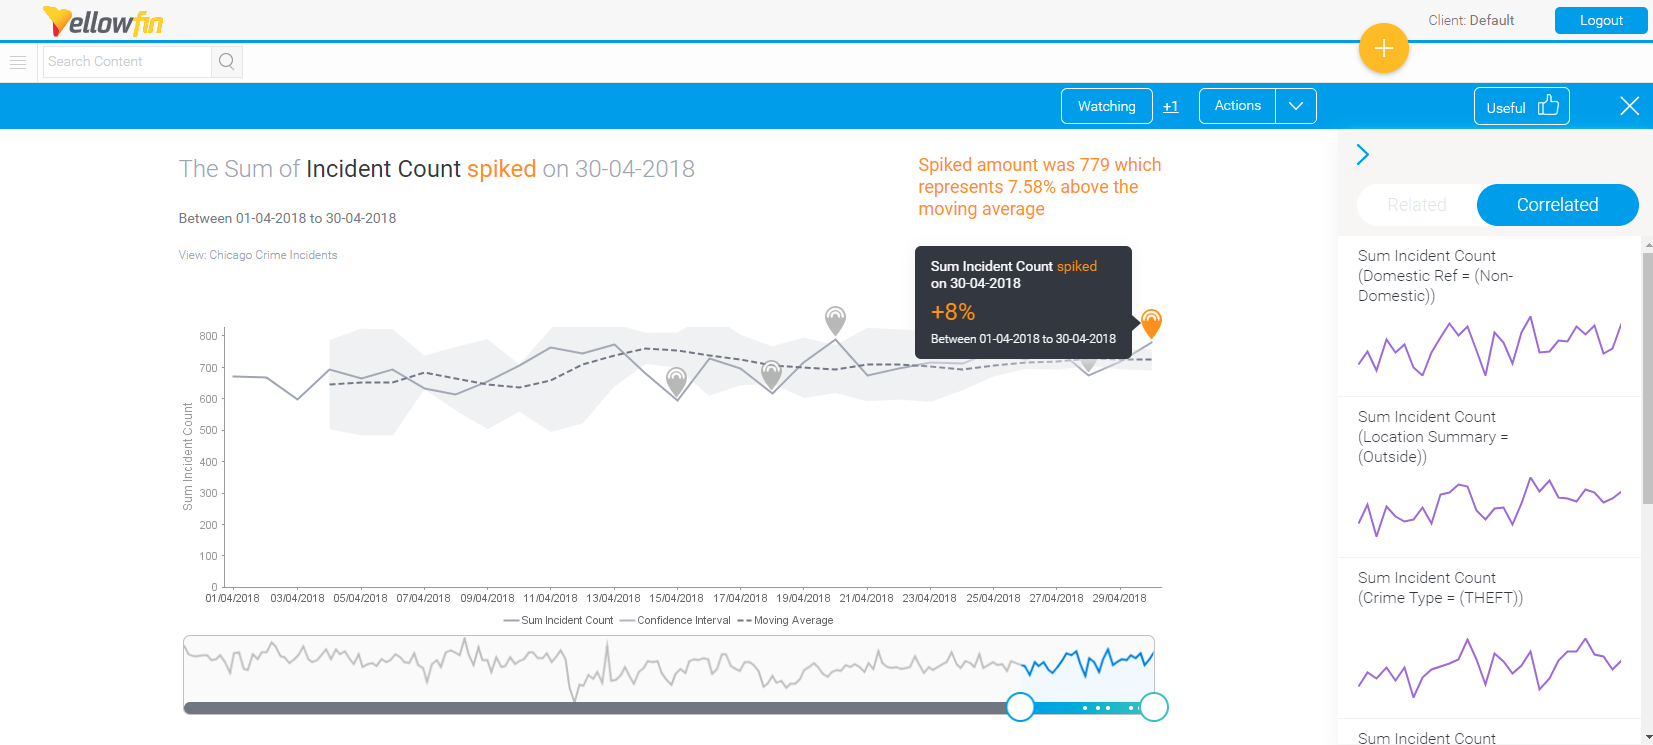
Yellowfin Signals automatically discovers and surfaces the most important changes in your data as they happen. Alerts are immediately delivered as these changes occur. Yellowfin Signals performs time series analysis - taking slices of time series data based on the dimensionality available. It will automatically deliver statistically significant changes, but based on the machine algorithms that are constantly scheduled.
Yellowfin Signals will inherently know the data and content you have access to and will only serve up Signals based on your data permissions. It will also become more personalized the more the user interacts with it. The Signals that a user watches, rates or ignores - Yellowfin stores this and refines its recommendation engine so it knows what matters to the individual, and can serve more relevant Signals in the future.
Main Features
- Automated analysis: Important changes are automatically detected by Yellowfin Signals and sent directly to you as soon as they’re discovered. This aims to reduce human bias, and analysis fatigue.
- Configurable & scalable: The Signals analysis is easily configurable. Let the system know what data trends and insights are important to you. Creating a Signals analysis schedule is a one-time task, but can be updated as your data changes. You can schedule the analysis to run as frequently as you like.
- Personalized: The system knows the data and content you have access to, and will only send Signals based on your data permissions. It also personalizes the Signals it sends to you based on how you interact with all Signals (by rating or watching it).
- Interactive & collaborative: Users that receive a signal can collaborate with other users on it. The system offers other forms of interaction as well, including exploring other related signals, providing a natural language explanation of the generated Signal, tweaking the main Signals chart to compare with similar data, etc.
- Self-improving: The system continuously learns about user’s preferences based on their feedback and interaction. Users can rate Signals, which lets Yellowfin know about the type of Signals of interest to them. Yellowfin aims to avoid sending irrelevant insights to users by tracking the Signals that they rate as 'not useful'.
- Relevance: Understands how relevant and important a signal is in relation to your data.
- Explanation: Yellowfin provides additional automated analysis to get to the root cause of the signal using the Assisted Insights functionality.
Types of Signals detected
Yellowfin Signals automatically looks for the following patterns.
Signal type | Related analysis group | Description |
Spikes & drops | Detected using the Outliers analysis | Sudden increases or decreases in the metric. For example, a lot of extra visits occurred on the product page of your website yesterday. |
Breakouts | Outliers | Successive increases (called Prolonged Spikes) or successive decreases (Prolonged Drops) in metric. For example, chocolate sales going up the entire week before Valentine’s day is a prolonged spike. |
Change in trend | Trend change | A trend line changes from up to down, or vice versa. For example, PC sales were growing but then started to decline last month. |
Change in volatility | Trend change | Volatility describes how much the value changes from one period to another. For example, the share price becomes very volatile after news that the trade deal was cancelled. |
Change in Total (one period to another) | Period comparison | Compares the total this week, month, quarter with another similar period - last week, month, this quarter last year. |
New lost attributes | Period comparison | Significant attributes that entered or left the data this period. For example, a customer that bought every month stopped buying this month. |
Section Guide
- Getting started - See our tips on setting up and enabling Yellowfin Signals.
- Workflow overview - Get an idea of the Signals workflow.
- Configuring a Signals analysis - covers all the steps required to configure a Signals analysis job.
- Locating Signals - The system sends relevant Signals directly to your Timeline, but you can also view and interact with all the Signals that were generated via the Signals list.
- Exploring and understanding Signals - This section covers the main Signals page and how to understand the insights detected.
