How to Create JavaScript Charts
A JavaScript Chart is essentially made up of two components: JavaScript and CSS code. CSS is optional.
For the JavaScript portion, you could write your own or leverage an existing library. We ship with multiple different libraries which you can find in the /js/chartingLibraries/ folder. It is recommended that you add any extra libraries you need to this folder. Note that it is not technically necessary to always use a charting library, you can create anything you like using JavaScript and your report data.
When defining CSS rules, it is recommended that you give them unique names so that they don’t conflict with Yellowfin styling. For example, a good unique name is mycompanyname_chart_ textcolour
How the generateChart function works
The only function required when creating a JavaScript Chart is generateChart. The other functions provided in the example code are recommendations. Yellowfin will call generateChart to execute your JavaScript code.
All the options and data that you need from Yellowfin will be sent as part of the Options JSON object to the generateChart function.
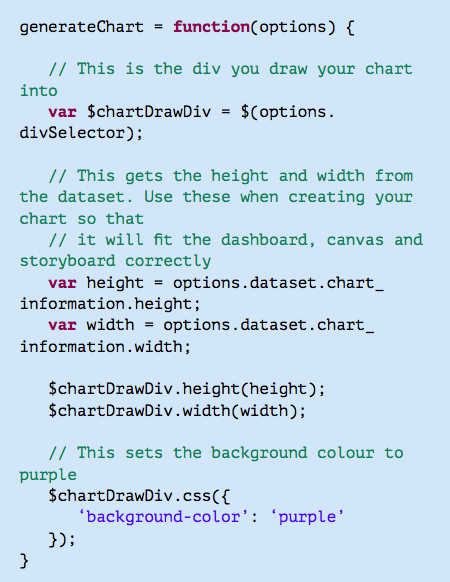
You will be drawing everything into a provided div (options. divSelector) which the dataset will give you the id for.
JavaScript Chart Example
This is an example of a very simple piece of JavaScript which will use the width and height sent in via the Options object and set the chart div to be purple.
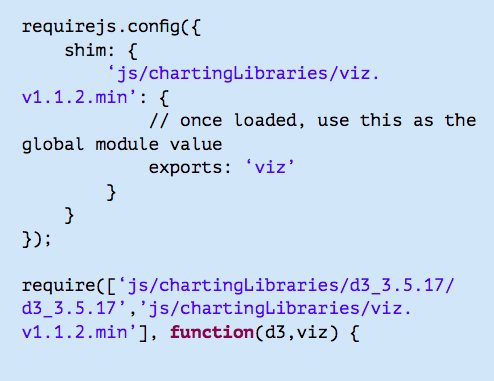
Require and Shim
Use Require to load any libraries that you need for your JavaScript Chart. If you are planning to embed via Javascript API or publicly share the report, you will need to use absolute paths. Otherwise, relative paths will be fine.
To use Require, simply define the path of what you need to load as follows:

In certain scenarios where a non-AMD Javascript library is used, Shim is required. While the shipped charting libraries within Yellowfin does not require Shim, you might need it for specific libraries sourced from the Web.
For more information about Shim, please see the requireJS documentation.
Here is an example of using Shim to require the non-AMD library VizJS:
Options JSON object
Example of a data set
We will be using the example shown below in our explanations. Please note thatsomeofthedatainthisexampleisabbreviated(as shown by . . . . )
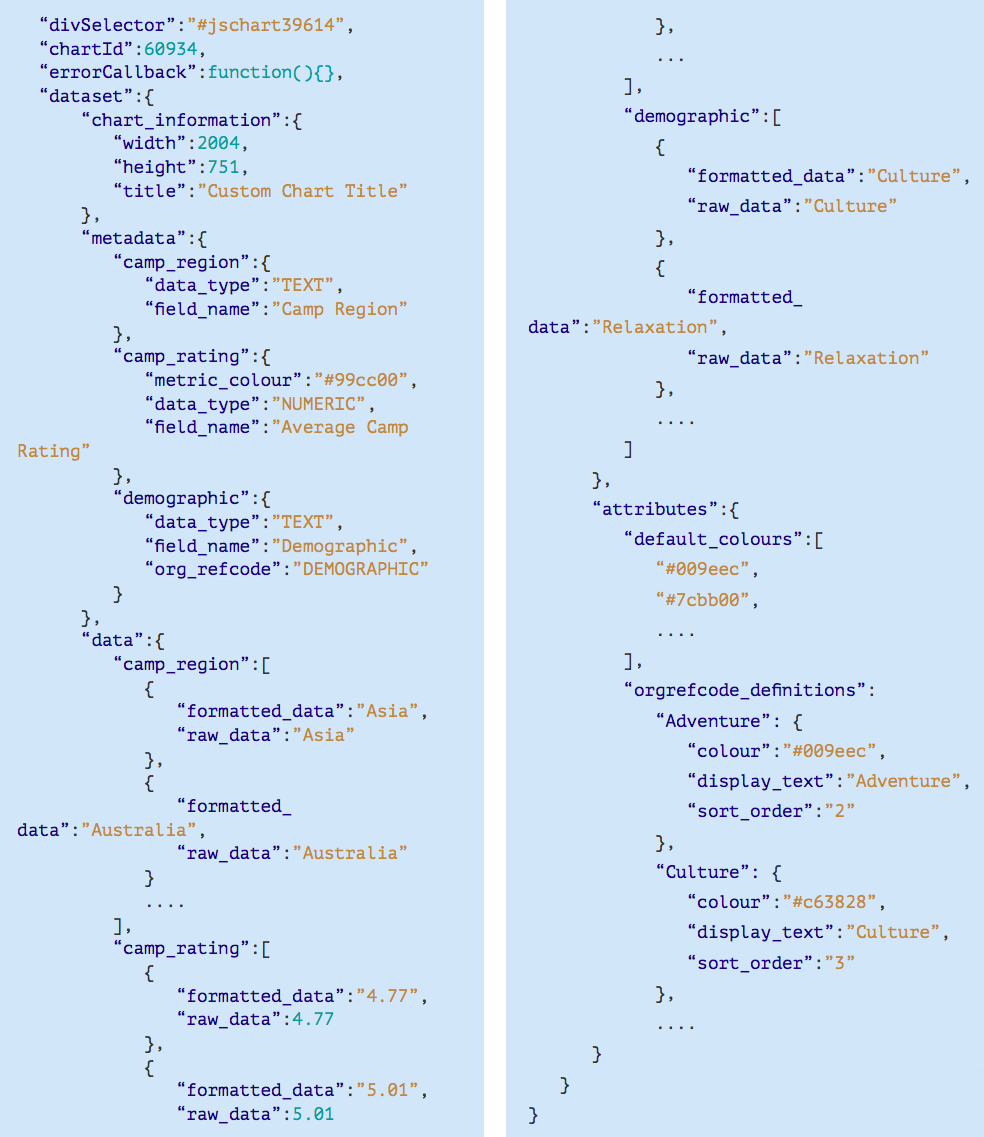
1. divSelector (options.divSelector)
A CSS selector using the ID of the div which the chart should be drawn within. This can be used with jQuery, D3 or any library which uses CSS style selectors.
E.g: to select the chart div in jQuery, you would do the following
var $chartDrawDiv = $(options.divSelector);
2. chartId (options.chartId)
The internal Yellowfin ID of the current chart.
3. errorCallback (options.errorCallback)
This is a function you can call to show the default Yellowfin error message. Use this if you want errors from the JavaScript Chart to look consistent with Yellowfin styling. It is not required that you use this. This will also print to console the error which occurred.
4. dataset (options.dataset)
An object whose attributes represent the report’s data and some rendering information. The dataset object will contain the following attributes:
4.1 chart_information (options.dataset.chart_information)
An object containing information used for chart rendering.
- height and width: contains height and width attributes for the area the chart is rendering into (dashboard portlet, canvas widget, storyboard, chart builder output, JavaScript API). When the chart is a single chart on the report output page, it will be the height & width set for the chart. Ensure that these values are used in your JavaScript Chart container to ensure proper resizing.
- title: if a chart title is defined, it will be part of the dataset object.
4.2 metadata (options.dataset.metadata)
Information about the fields in the report. Attribute names are based on the fields in the report (all lowercase with spaces replaced by underscores, and duplicate field names will append numbers to the end of the names). Field names used here correspond to the field names used for the data. Within metadata, these objects below contain the following attributes for each field:
| Attribute | Description |
|---|---|
| data_type | A string representing the data type of the field (TEXT, NUMERIC, etc). |
field_name | The formatted name of the field. If translations are switched on, the translated version of the field name for the user’s preferred language will be returned. |
metric_colour | <Optional> Ifametriccolour has been set for this field at the view level then there will be a metric_colour attribute which contains the hex code (e.g #FFFFFF)fortheselectedcolour. |
org_refcode | <Optional> If a field has a ref code applied to it on the data page, then this ref code information will be included with the JavaScript Chart dataset object. This returns the ref code name e.g “DEMOGRAPHIC” according to our example above. The Attributes object contains the actual data for the ref code (e.g sort order, display text, colour, etc). See orgrefcode_ definitions below. |
4.3 data (options.dataset.data)
An object containing the actual data in the report. As with metadata de ned above, attribute names are based on the elds in the report e.g all lowercase with spaces replaced with underscores. These represent arrays of objects with the following attributes for each field:
| Attribute | Description |
|---|---|
| raw_data | The underlying data contained within this field. |
| formatted_data | The formatted data for this field with prefix, sufiix, decimal places, etc. These data arrays are in the order that the data appears in the report. This means that options.dataset.data.camp_region[4] and options.dataset.data.camp_rating[4] refer to the same row of data. |
4.4 attributes (options.dataset.attributes)
An object which contains additional rendering information. This contains the following attributes:
| Attribute | Description |
|---|---|
| default_colours | An array of the default chart colours configured in the Administration->Content Settings page. These are also in the order that they are specified within that page. |
| orgrefcode_definitions | Contains all the org ref code definitions used by any fields on the report. This is a map of maps. The key is the org ref code which matches with the org ref code for the field in the metadata object defined earlier above and is keyed by the field name used in the data object. Each definition contains the colour and sort order if they exist, as well as the display text for the org ref code. |
Behind the scene operations
Calling a JavaScript Chart will first generate a dataset server side which contains the following:
- Chart JavaScript
- Chart CSS
- Chart Failure Image (used in the Chart error callback)
- JavaScript Chart dataset object
If Javascript Chart functionality is turned o at the Con guration level, the Javascript, CSS, and dataset will not be returned.
The Javascript handler will call your generateChart function, sending in the Javascript Chart dataset object, chartId, divSelector, and an errorCallback function.
The CSS is appended to the chart div within a style tag.
All of this logic is wrapped within a try/catch function which will show the standard error message for charts if there is a failure.
Additional Data Processing
Yellow n simply returns the dataset as you see from the table output in your report.
However, you can de ne additional functions within your Javascript Chart code to process the data further as needed.