Overview

The most important reason for creating a Conditional Format is to assist an end user to interpret the data presented to them. You can create rules to highlight or alter data on your report and charts.
It is recommended that Conditional Formats are used whenever the reader of a report needs to be drawn to act or interpret data based on a pre-determined set of rules.
General Settings
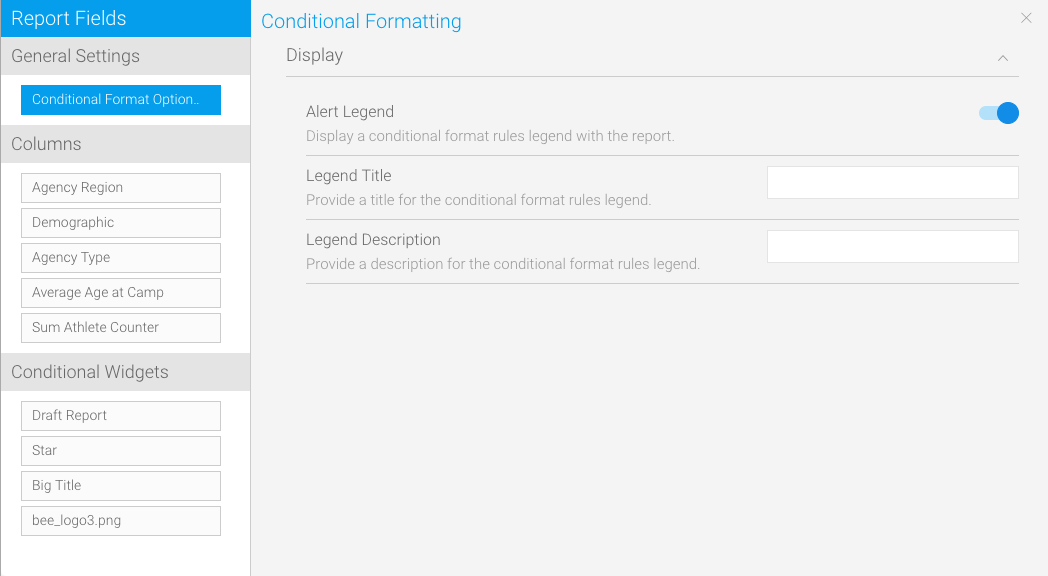
Field Settings - Basic Rules
Basic rules allow you to set the format of a column using comparisons to either its own values or another field’s values. This is the most common forms of Conditional Format that are applied.

Option | Description |
|---|---|
Alert Type | Select the complexity of the alert rules.
|
Style | Select a display method for the alert. There are three options available:
|
Type | Select the comparison type from the following options:
|
Target | If you select a column comparison type you will have to choose the column that you want to compare your data to. Choose the appropriate column. |
Creating Basic Rules
Once you have selected how you want to highlight your data you must set the alert rule. See Columns Conditional Formatting to learn more about this.
Field Settings - Advanced Rules
Advanced rules allow you to create complex rules for determining the format of the column. For example, if you wanted to create a rule such as: If Region = Europe and Revenue > $200,000 then highlight Profitability as RED.

Option | Description | |||||||||||||||||||||
|---|---|---|---|---|---|---|---|---|---|---|---|---|---|---|---|---|---|---|---|---|---|---|
Alert Details | Provide a description for this rule. | |||||||||||||||||||||
Style | Select a display method for the alert. There are four options available:
| |||||||||||||||||||||
Icon Set | If the Style is set to Icon then select the set of icons to apply to the alert.
| |||||||||||||||||||||
Colour | This option requires you to define either the colour, or the icon from a set, to be applied to the rule. | |||||||||||||||||||||
Rules | Enter the logic of your rule. You can select a column the operator and the value. By clicking add you can add additional rules with bracketing etc.
|


Conditional Format Data Validation
When inserting values into the Conditional Format type a number of rules need to be followed. These include:
Value Overlaps
If you are creating a number of Conditional Formats, as in the example above, care will have to be taken to ensure that the Conditional Format values do not overlap. For instance you cannot set one record that is 50 to 60 and another 55 to 65. This will cause a clash in processing and may result in your report failing.
Value Sequence
When creating a range of values – such as for a BETWEEN operator the lower end variable must be inserted as the first value of the Conditional Format followed by the higher. Example – 30 then 40 not 40 then 30. If this is not followed you report Conditional Format will fail since no data will meet the criteria.
Value Applicability
You do not have to create a Conditional Format for every possible value that will be returned. If there is a measure that does not meet a Conditional Format criterion it will be returned in a normal font. Conditional Formats should only be put on values that you want to draw attention to.