Overview
At the core of your dashboards are your reports that provide the analytical view of your data. Pre-existing reports can easily be added to the dashboard, accessible via the Reports panel, which appears by clicking on the Reports button on the left side.
Report branching
You can include multiple copies of a report, such as its individual charts, table, or even the report canvas, to the dashboard. This holds true for live reports, snapshots, and bookmarks. Adding multiple copies of the same report provides further flexibility to the design.
During report branching, the system runs the SQL only once. This limits resource consumption and increases performance.
Note: Report branching is possible if your selected report contains multiple types of content.
Multiple report versions
You can also add multiple versions of the same report onto your dashboard; this means snapshots, bookmarks, and the live report itself. For any of these versions, you can choose the content type you display them in. This is ideal if you wish to add various bookmarks of the same report, or want to add different charts, or even the same chart multiple times, and provide different filters on each.
How to add reports to a dashboard
This tutorial is suitable for pre-existing reports, and also works if your report contains snapshots or bookmarks.
- Click on the Reports button on the left side, to bring up the Reports panel.
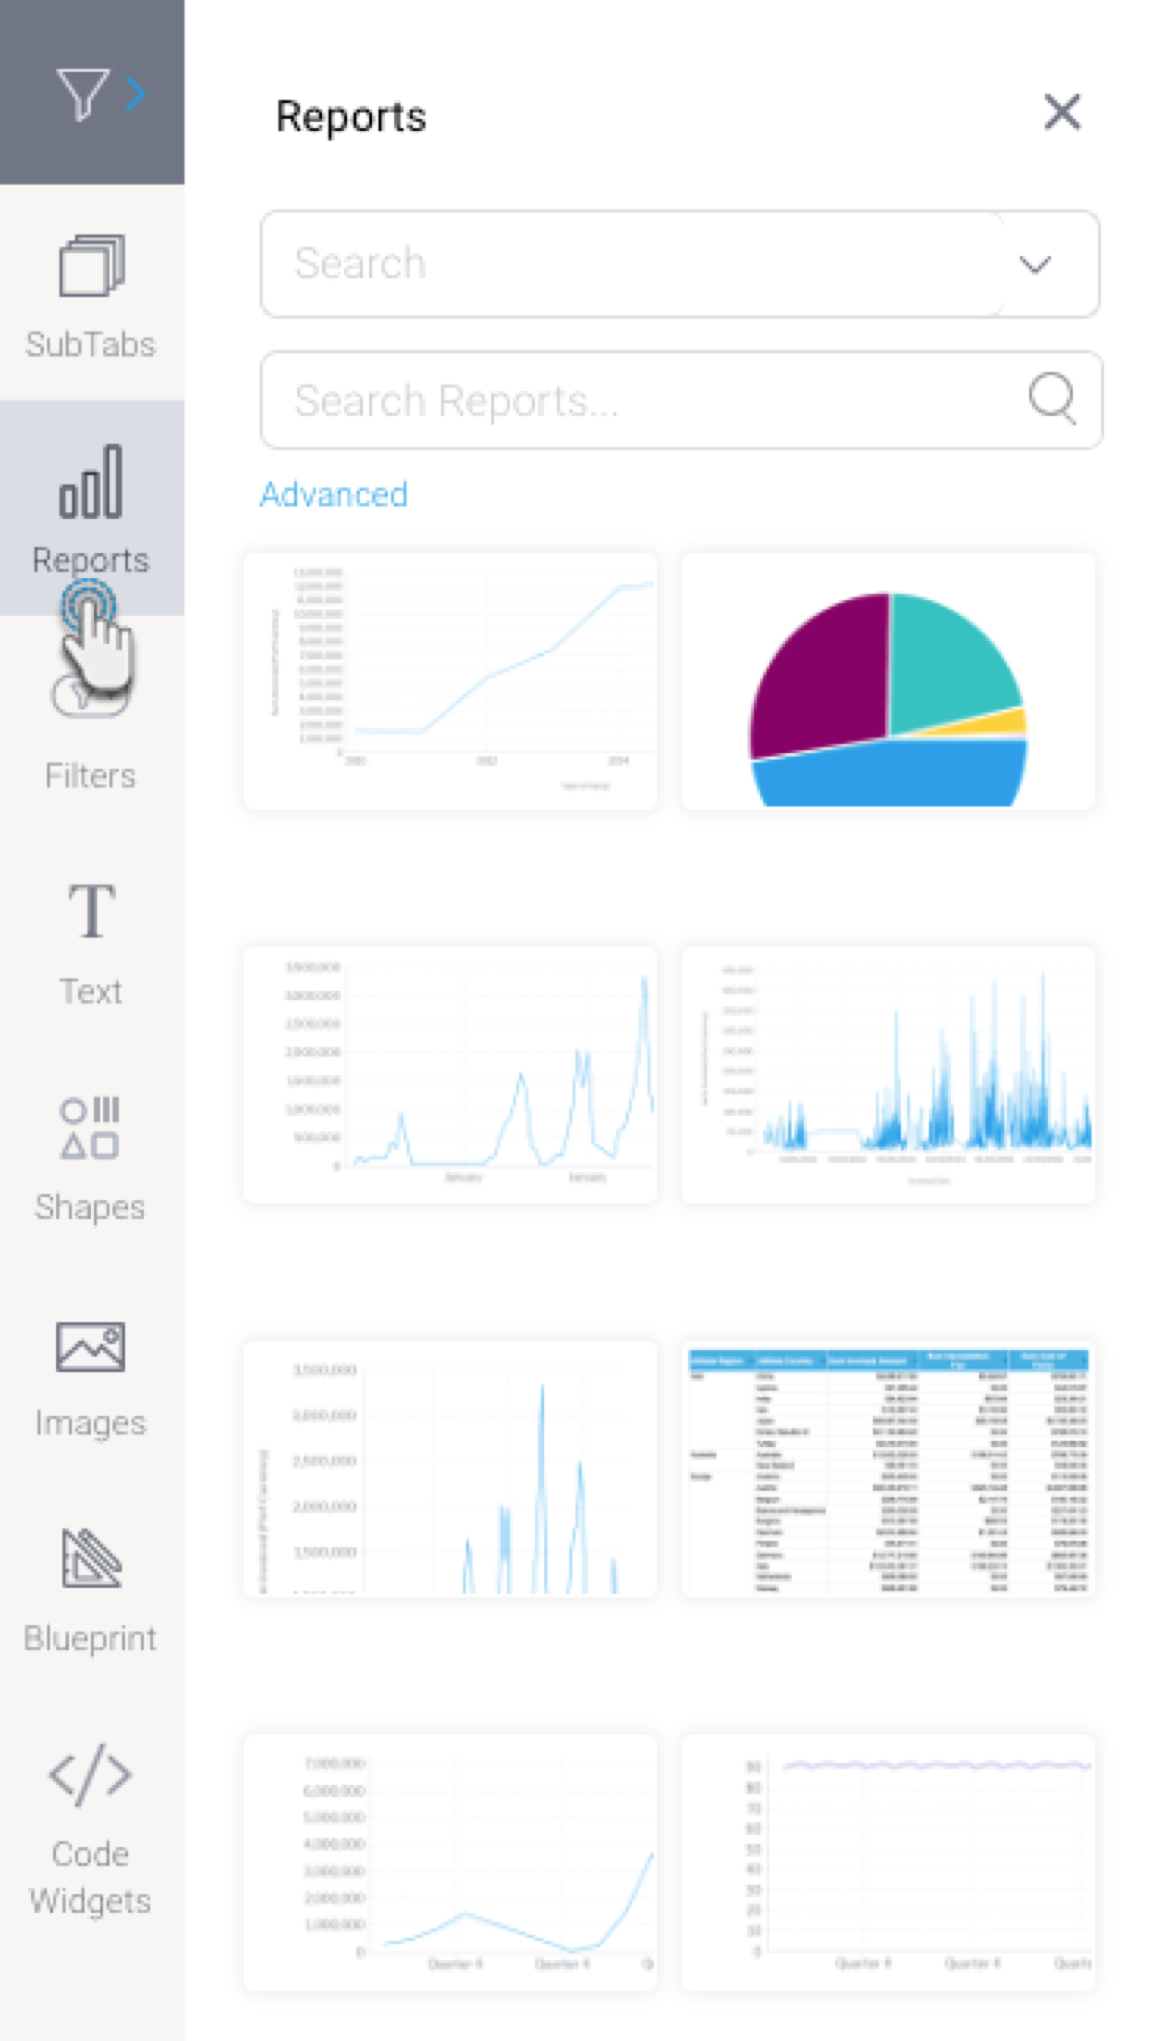
- To search for a report, enter the report name into the second Search bar.
- Alternatively, use the first search dropdown to look up reports that were recently accessed, are newly created, or are in your favorite content list.
You may also click on Advanced to use additional search filters to find your report. See below for details on these search filters.
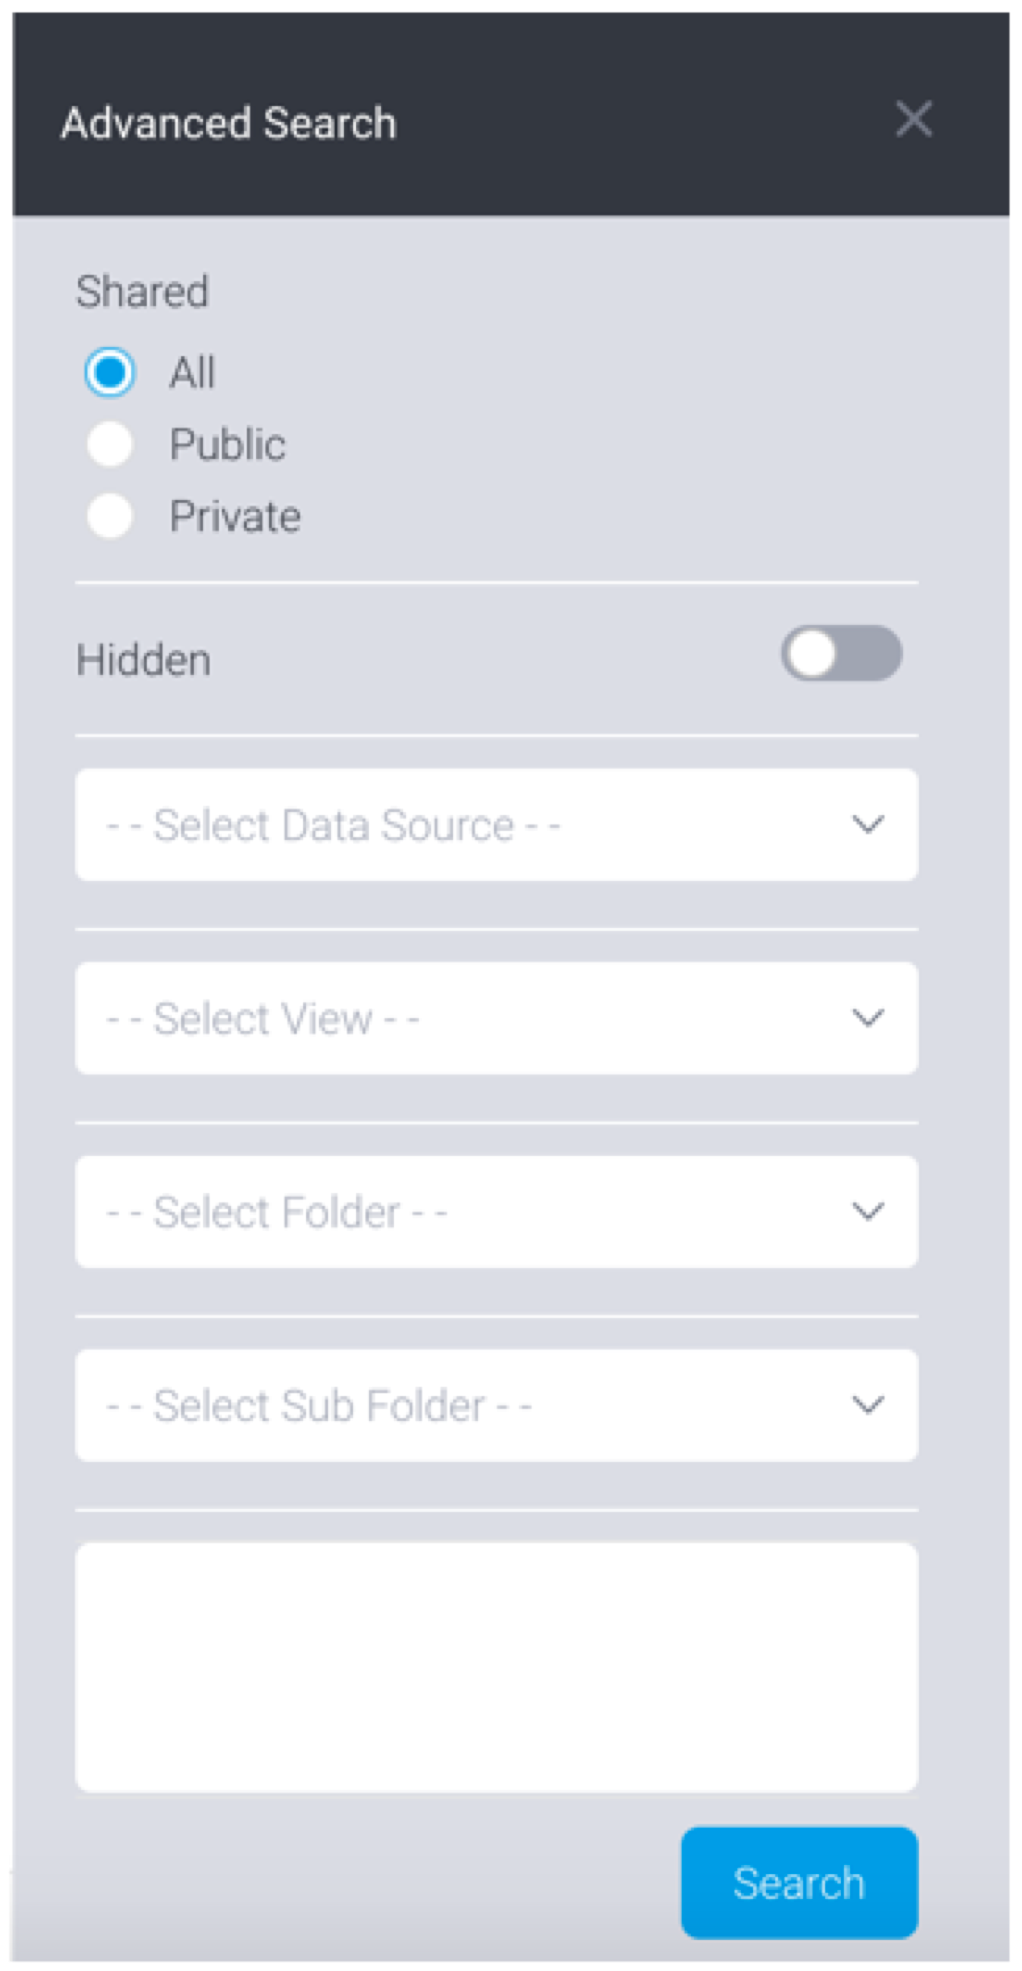
Option Description Shared
Select whether to look up public, or private, or any shared reports. To be able to view the private reports, you must have been given access to them.
Hidden
Enable this to search for hidden reports. Reports are sometimes hidden if they’re intended to be accessed via Drill Through.
Select Data Source
Search for reports belonging to a specific data source.
Select View
Search for reports belonging to a specific view.
Select Folder
Search for reports saved in a specific content folder.
Select Sub Folder
Search for reports saved in a specific content sub folder.
Text box for tags
Provide tags to look for reports that were tagged with specific keywords.
- Drag a report on the dashboard’s content area to add it. If it contains multiple content types, multiple charts, or even bookmarks or snapshots, then the following Choose Report Type popup will appear. (But if it doesn’t contain multiple content types, then the selected report will simply be added to the tab).
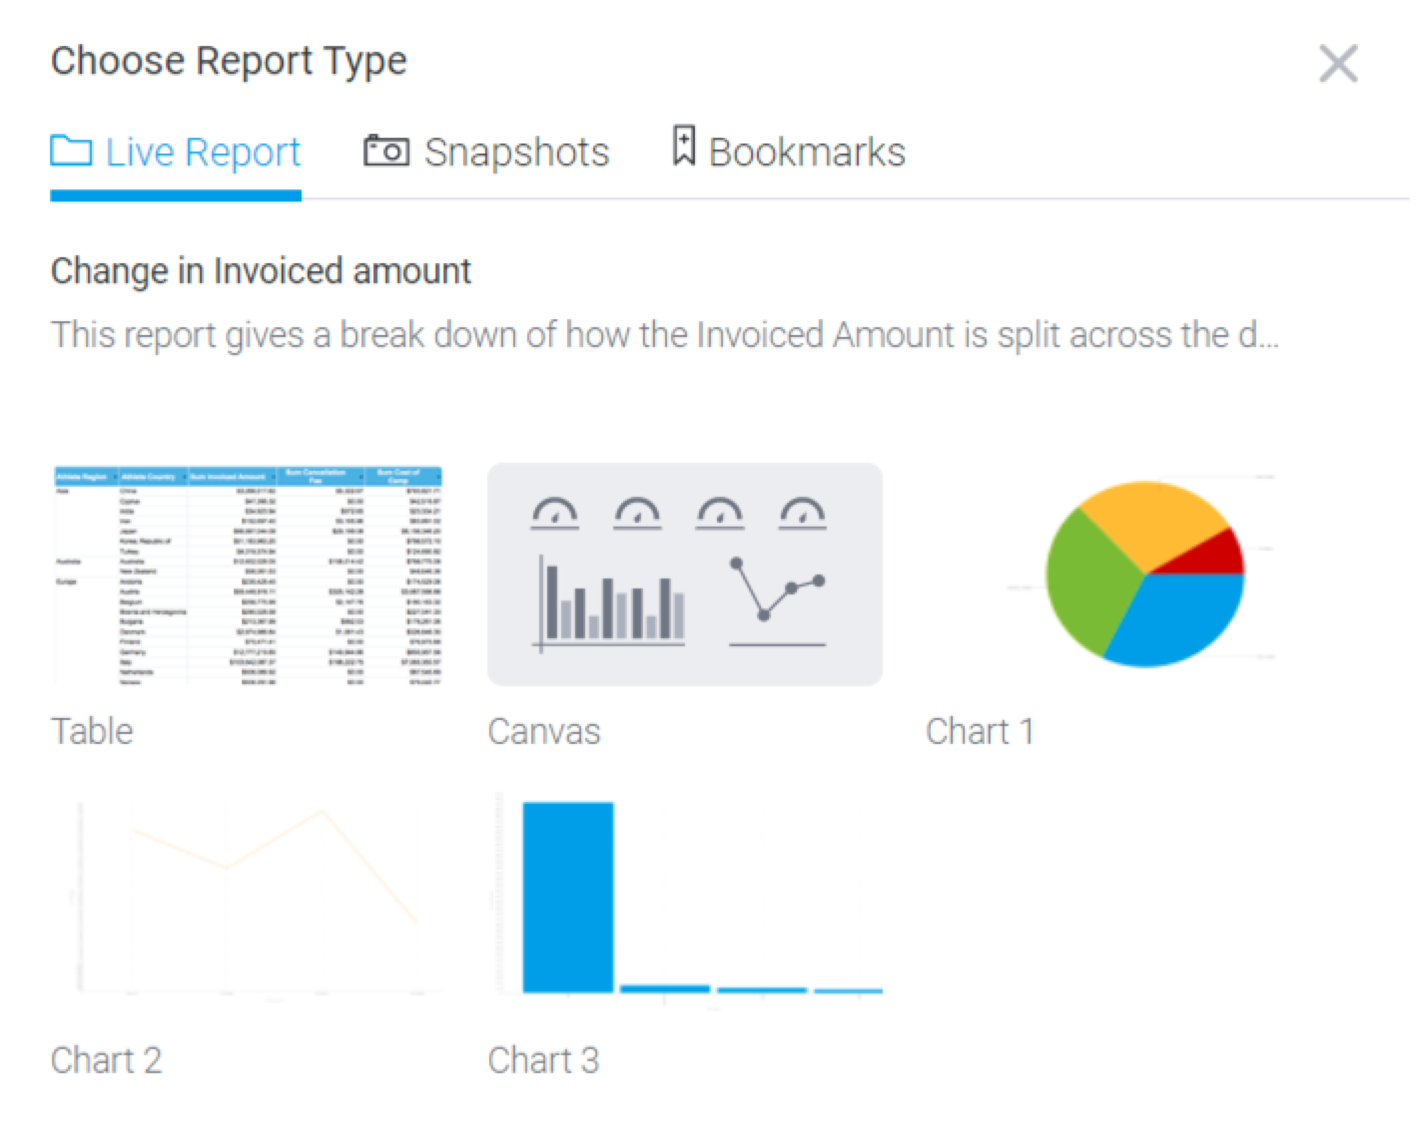
- You can use this popup to change the default report display type. This popup divides the report content into 3 tabs: one for all individual charts, tables, and canvas of the report, another for similar content of its snapshot, and a third for bookmarks.
- Switch to a tab by clicking on its name. For example, to add a snapshot, click on the Snapshots tab. Then choose name of snapshot from the list on the left.
Next, select the content type you want to display this snapshot as by clicking on it.
Note: You can also change this selection after adding it. See the Report Type configuration in the properties panel.
- After adding the report item, you can further customize it. To do so, bring up to report properties panel on the right side by clicking on the report widget, and use the configurations to customize it. Refer below to learn about the type of customization done on a report widget.
- You can also add an action event that will be triggered when this report is clicked. See the Actions section in the report's property table below for more information.
- You can further manage this widget by right-clicking on it, and using the menu that appears. Learn more about the menu options here.
Report properties
Click on a report to bring up its properties in the Properties panel. You will be able to edit these on a canvas layout.
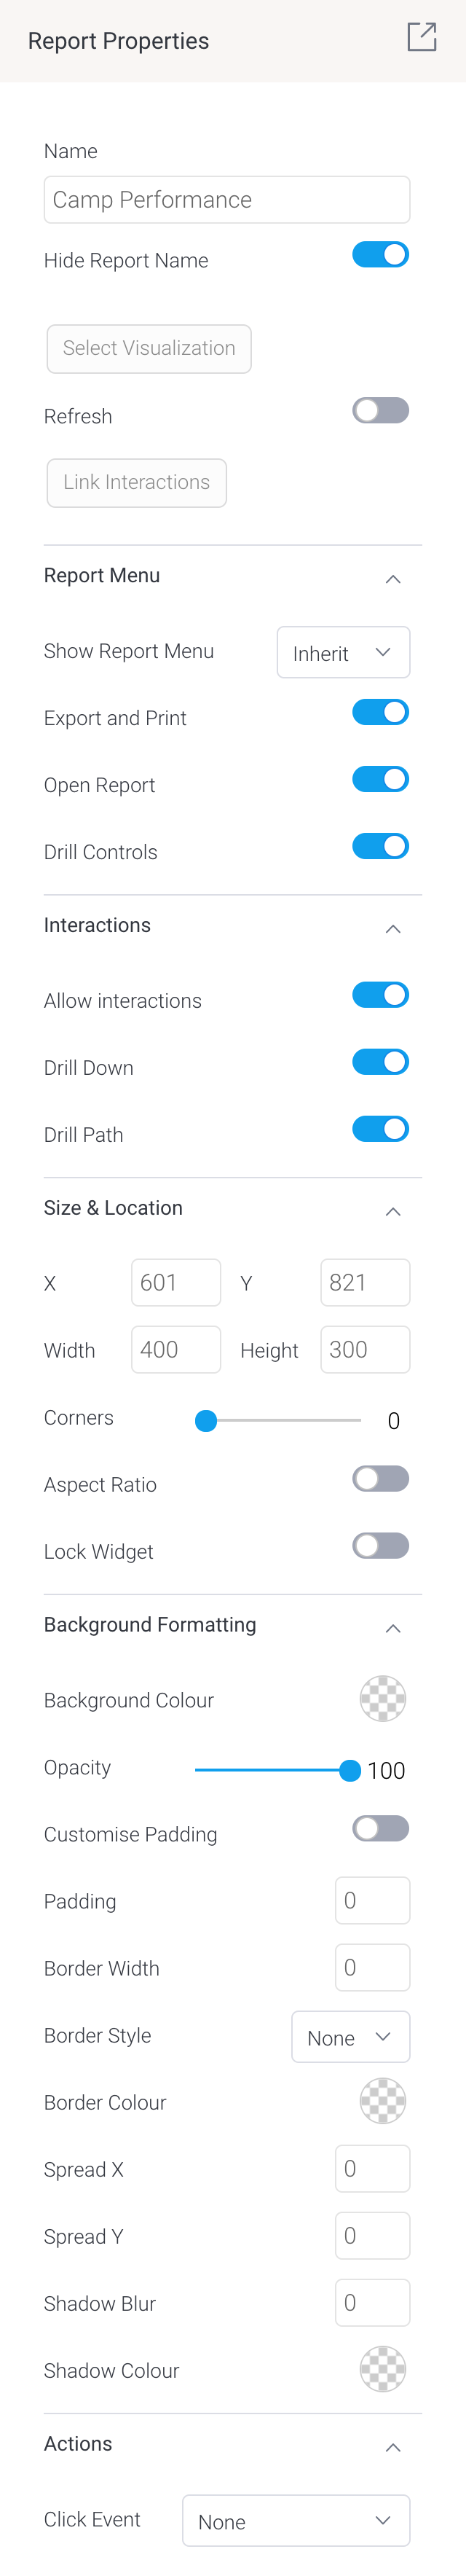
Note: these property options will differ based on the selected dashboard template; the dashboard layouts will have limited properties options, whereas the canvas will have all.
Property name | Supported Template | Description |
|---|---|---|
Name | Canvas & static layouts | Allows you to edit the default report name. |
| Hide Report Name | Canvas & static layouts | By default, the report name will be hidden on the canvas. Toggle this to show/hide the report name. When shown, the report name appears directly above the report and cannot be formatted. |
Report type | Canvas & static layouts | Allows you to change the report’s content type. Example, if your report has multiple charts, you can choose which one to display on the dashboard. Similarly, a live report can be changed to a saved snapshot or bookmark. |
Refresh | Canvas & static layouts | Enable this toggle to allow your report to be refreshed periodically once the dashboard is published. |
Refresh time | Canvas & static layouts | If opting to refresh reports, define frequency of time (in seconds) that the report should be refreshed. |
Link interactions | Canvas & static layouts | This button allows you to enable and link interactions to your report, such as drilling, or brushing. To do this, your report must be set up beforehand to allow for these interactions. For example, to perform drilling, the report must have data hierarchy that takes it from one level to another level. |
| Report Menu | ||
| Show Report Menu | Canvas & static layouts | This controls the visibility of the report object menu at the individual report level. Options include:
Note that the individual report level setting will override menu visibility setting at the canvas and admin levels. |
| Export and Print | Canvas & static layouts | Enable this toggle to show the |
| Open Report | Canvas & static layouts | Enable this toggle to show the |
| Toggle Display Type | Canvas & static layouts | Enable this toggle to show the option to switch the display between chart or table in the report widget menu. Note that the toggle option will only appear for reports that contain a single chart and table. |
| Drill Controls | Canvas & static layouts | Enable this toggle to show the drill up or drill reset options that appear in the report widget menu when a drill function is applied on the report. |
| Interactions | ||
Allow interactions | Canvas & static layouts | Enable this toggle to allow interactions to be performed on the chart. This toggle allows you to display additional toggles, so you can choose the exact interaction functionality to be enabled on a chart. |
Brushing | Canvas & static layouts | Allows users to perform brushing on a chart if enabled. The chart must have brushing capabilities set up prior. |
Drill down | Canvas & static layouts | Allows users to perform drill down on a chart if enabled. The chart must have drill down capabilities set up prior. |
Drill path | Canvas & static layouts | Allows users to use the drill path on a report if enabled. |
Size & location | ||
X | Canvas | Specify the x coordinates of the top left corner of the report, in order to position it exactly on your dashboard canvas. |
Y | Canvas | Specify the y coordinates of the top left corner of the report, in order to position it exactly on your dashboard canvas. |
Width | Canvas | Specify the width of the currently selected report, in pixels, in order to resize it exactly. |
Height | Canvas & static layouts | Specify the height of the currently selected report, in pixels, in order to resize it exactly. |
Corners | Canvas | This option allows you to define the roundness of your report border corners. Tip: For maximum circular edges, enter half the value of the widget height. For example, if the height is 400 pixels, then set the edge value to 200 pixels. Moreover, any value greater than 200 for the edge, will not have any further effect in this example. |
Aspect ratio | Canvas | Enable this toggle to maintain the aspect ratio. This means when increasing or decreasing the report’s size, it maintains its shape (i.e. the relationship between its width and height). If this is disabled, the report can be stretched out of shape either vertically or horizontally. |
Lock widget | Canvas | Enable this toggle to lock the report in its location. This stops you from moving or resizing it. This holds true even when selecting multiple widgets on the canvas. Note that the report widget can still be customized. |
Background formatting | ||
Background color | Canvas | Allows you to specify a background color for the report. |
Opacity | Canvas | Allows you to specify the transparency of the report’s background color. |
Customise padding | Canvas | This option allows you to define a custom padding or buffer around the report, in pixels, when enabled. This includes padding for each side to the report. If disabled, you can still define an overall padding size. |
Padding top | Canvas | When custom padding is enabled, this allows you to define padding to be added to the top of the report. |
Padding bottom | Canvas | When custom padding is enabled, this allows you to define padding to be added to the bottom of the report. |
Padding right | Canvas | When custom padding is enabled, this allows you to define padding to be added to the right of the report. |
Padding left | Canvas | When custom padding is enabled, this allows you to define padding to be added to the left of the report. |
Padding | Canvas | This allows you to define an overall padding size for the report. This size, defined in pixels will be constant for each report side. To add different sized padding on any of the sides, enable the Customise Padding option. |
Border width | Canvas | This allows you to specify the thickness of the report border. Note: to make the border visible, you must define values for all three border properties. |
Border style | Canvas | This allows you to select a style for the report border. Options include: dashed, solid, dotted, groove, and more. |
Border color | Canvas | This allows you to specify the color of the report border. |
Horizontal shadow | Canvas | This option allows you to drop a horizontal shadow on the report, by defining its size in pixels. |
Vertical shadow | Canvas | This option allows you to drop a vertical shadow on the report, by defining its size in pixels. |
Shadow blur | Canvas | This option allows you to define the sharpness of the report shadow. The smaller the value, the sharper and more defined the shadow will be. For a blurry or softer shadow, provide a bigger value. |
Shadow color | Canvas | This option allows you to set a color for the report shadow. |
| Actions | ||
| Click Event | Canvas | Select an event that will trigger when the selected report is clicked. Event options include:
|
| Report ID | Canvas | If navigating to a report using the ‘Go to report’ click event, provide the UUID of the report. |
| Sub Tab # | Canvas | If navigating to a sub tab using the ‘Go to sub tab’ click event, enter the order number of the sub tab. |
| URL | Canvas | If navigating to an external page using the ‘Go to URL’ click event, provide the full URL of the page. |
| Target | Canvas | If navigating to an external page using the ‘Go to URL’ click event, specify the page target. Options include:
|
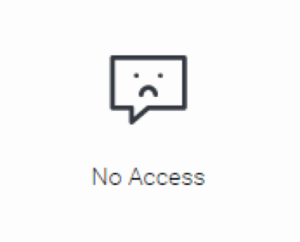
Report access
Dashboard designers, and end users alike will not be able to view reports that they do not have access to. The following image will appear in place of 'secure' reports:
Report object menu
Hover over or right-click on a report object to bring up a menu with multiple options.
Menu icon | Description |
|---|---|
This brings up another menu to perform numerous actions on the selected object. See here for more information. It can also be used to drag the widget. | |
This button allows you to carry out the following options.
| |
| Displays the report in a tabular form. |
Displays the report’s chart. | |
| Allows you to drill up from a drilled down report. This option only appears for report objects, when a drill interaction has been performed on it. |
| Allows you to reset a drill interaction on a report. This option only appears for report objects, when a drill interaction has been performed on it. |
Navigates to the Report’s output page, where you can edit the report and re-publish it. |


Report menu visibility
You can control the visibility of this menu that pops up on report objects for dashboard users. By default, this setting is set to appear on Hover, but it can be completely hidden or made to always appear.
Note that users can control this setting at the global level or the individual report object level.
- Admin level: This controls the menu visibility from the global level, for all report widgets on dashboards. Navigate to Administration > Content Setting > Dashboard Settings > Portlet Settings and enable or disable the Action Buttons toggle. If enabled, the menus will appear all the time; but if disabled, they only appear if the users hover over the report. By default this is set to appear on hover.
- Canvas level: This controls the menu visibility from the canvas level for all report objects on the canvas. This is controlled through the Canvas dashboard’s sub-tab properties panel. Note that this setting will override the specified admin level setting, but not the individual report level setting. By default this is set to Never.
- Individual report level: This controls the menu visibility for the selected report. Note that this setting will override admin level and canvas level settings. By default this is set to Inherit. See below for more information.
How to change menu visibility
- To change the menu visibility for an individual report, open a report object's property panel and jump to the Report Menu section.
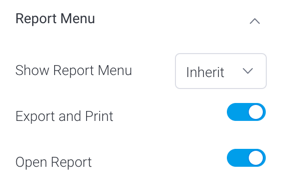
- Select visibility option from the Show Report Menu dropdown. Options include:
- Inherit: (Default selection) The object menu will inherit this setting from a higher level. Note that this menu visibility is also controlled at the admin level, and canvas level. For dashboard canvas, the canvas level setting will be inherited, and for static dashboard layouts, the admin level setting will be inherited.
- Never: The report menu will never appear in a published dashboard, however will still appear when hovered on in edit mode.
- Always: The report menu will always appear. For static layout dashboards, this will make the menu appear constantly in both edit and published modes; however for canvas dashboards, it will continue to hover in edit mode, and always appear in published mode.
- Hover: The report menu will only appear when hovered on. Use this to make the menu appear only as long as users hover over it.
- Note that the individual report level setting will override menu visibility setting at the canvas and admin levels.
- You can further control each of the report menu options by choosing to display or hide them using the following configurations.
Refer the to Report Menu section in the report's property table above for further information.
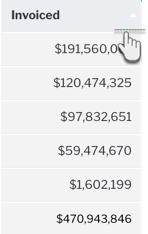
Sorting Report Columns
You can sort a column in a report table on your dashboard in an ascending or descending order. This is possible is the dashboard canvas, as well as static layouts - in draft or published dashboards.
- Add a report to the dashboard. In case of a multi chart report, choose report table as the display type.
- Click on the arrow menu icon of the column you wish to sort. This will bring up a menu.
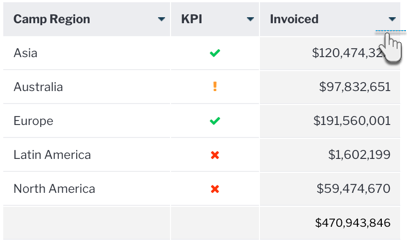
- Select Sort and then choose how to sort the column values, in ascending or descending order.
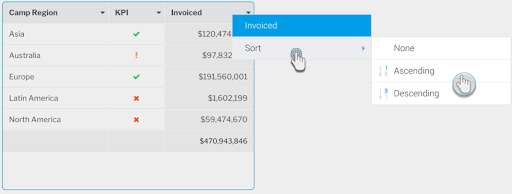
- Your column will be sorted, and the selected sort order will be visible in the column name.